Knowledge Enclosures, Forced Specializations and
Investment Crisis
Filippo Belloc, Ugo Pagano1 Abstract
Like land before the industrial revolution, in the present global economy much knowledge is being enclosed in private hands. In this paper we argue that these enclosures have become a major factor in specialization among firms and among countries: both are forced to specialize in the fields that are not restricted by the enclosures of the others. We use data on 26 OECD countries over the 1978-2006 period. We estimate the effect of patents endowments of countries on their investment specialization across sectors and show that knowledge enclosures involve self-reinforcing innovation patterns. Moreover, we perform a structural change analysis and find that the TRIPs agreement has significantly strengthened the relationship between countries’ patents specialization and investment specialization. We conclude by suggesting that stronger international patent protection may restrict global investment opportunities, and this may be one of the factors contributing to the present crisis.
JEL classification: F55, F14, L20, O34, P17.
Keywords: IPRs, innovation, knowledge enclosure, technological specialization.
1. Introduction.
At present, only relatively few innovations are pioneering, building on a single stand-alone invention. Rather, most innovations are interdependent, with each technology linked to another in the production chain (see, for example, Boldrin et al. 2005). The owner of an Intellectual Property Right (IPR), therefore, has not only the right to exclude others from the use of a given technology, but he can also prevent the non-right-holders from investing (and so innovating) in the industrial activities requiring that proprietary technology. As a result, at the macro level – under a worldwide IPRs protection system – countries rich of IPRs can prevent countries poor of IPRs from using their knowledge for production, with the possible consequence of generating a “snowball dynamics” according to which IP-rich countries exploit larger investment opportunities and acquire new (proprietary) knowledge, and IP-poor countries tend to stagnate in a low-investments/low-patents equilibrium.
In this paper we try to explore such dynamics empirically. In particular, the aim of this article is two-fold. First, we want to investigate if the amount of IPRs
1 Filippo Belloc: Department of Economic Studies, University of Chieti-Pescara, [email protected]. Ugo
(specifically, patents) that a given country owns in a certain sector positively affects the investment opportunities which the same country is able to exploit in the same sector. Second, we want to measure whether the magnitude of the relationship between patenting specialization and investment specialization has increased after the 1994 international Agreement on Trade Related Aspects of Intellectual Property Rights (TRIPs). Since the TRIPs, the global definition and enforcement of IPR indeed has become much tighter. These new enclosures may initially have provoked a gold rush for the private appropriation of important fields of knowledge, but since then they may have restricted opportunities for investment at both firm and country level. They may have altered then the comparative advantages of nations by further forcing countries to invest only in those processes that do not require rights owned by other nations.
We estimate the marginal effect of IPRs endowments and investment activity on each other by a system of simultaneous equations, using data from 26 OECD countries over the 1978-2006 period and considering countries’ specialization patterns in five industries. The OECD countries considered in this study show strong heterogeneity in their sector-level patent endowments, and this makes a comparative analysis of their innovation patterns highly informative. We also disentangle the before-TRIPs and after-TRIPs periods and study how estimated coefficients vary across periods. We find that, on average, the within-country distribution of patents between industries determines the within-within-country distribution of investments between industries, and vice-versa, so that a country’s technological development is showed to be both sector-specific and non-ergodic. Moreover, we observe a statistically significant increase of the effect of patent specialization on sectoral investment opportunities after the TRIPs.
We contribute to the literature on countries technological development and international industrial specialization (Dixit and Stiglitz, 1977; Krugman, 1980; Helpman, 1993; Lai, 1998; Hall and Soskice, 2001) by arguing that a virtuous circle of cumulative causation between intellectual property and investments may have arisen for countries rich of IPRs (and it may have become even stronger after the TRIPs), while those poor in IPRs face the possibility of a vicious circle between investment and innovation opportunities. Whilst this restriction of investment opportunities is associated with a new sort of comparative advantage, and may lead to an increase in the level of international trade, it may also contribute to the overall depression of investment opportunities and, together with other causes, to the present crisis of the global economy.
our empirical study. In Section 5, we develop the econometric analysis and present the results. Section 6 concludes.
2. Motivation.
In 1994, the creation of the World Trade Organization (WTO), with the associated TRIPs agreements, marked a structural break in the world economy and the beginning of a new era of capitalism: one of intellectual monopolies in which ideas themselves could be securely owned and become capital investments. The priority of ideas, which in the past had been associated with the “idealism” of Hegelian philosophy, was now a concrete reality.
In the framework of the mainstream view expressed by Solow’s (1956) model, technological knowledge was available to all countries and would eventually lead to the convergence of the growth rates of all countries. Unfortunately, the only feature that knowledge shares with pure public goods is non-rival nature, whilst excluding others from knowledge is easily accomplished with various devices (such as secrecy and intellectual property rights). Moreover, the inclusion of others in the use of knowledge (that is, its transmission and diffusion) may be very costly. Thus, exclusion from the use of knowledge is not only feasible but also particularly costly for those excluded because its private ownership is meant to imply that only the first discoverers have the right to use it. Ironically, non-rival goods like ideas, which can be simultaneously used by many users without additional costs, cannot be replicated by other individuals in the same way as the other standard production inputs can. This circumstance may generate two interrelated phenomena at micro and macro level or, to put it in another way, at firm level and country level.
by the fields privatized by others, the resulting forced specialization is likely to be associated with a dramatic squeeze of investment opportunities.
At macro level, the traditional theory of comparative advantage is based on the idea that each country acquires the specialization dictated by the natural endowments of the immobile resources enclosed in its geographical field. However, in the present global economy, the ownership of knowledge (potentially, the most mobile resource) generates an artificial field and a related comparative advantage. This artificial field includes the ideas owned by the country’s production units and those under common ownership, while it is limited by the ideas owned by other nations. If a good like knowledge is moved from the public to the private sphere, the legal positions on intellectual property influence the comparative advantages of nations and cause patterns of asymmetric development (Pagano, 2007a). The legal ownership of knowledge that limits the liberty of some countries to enter certain specialization fields has consequences more drastic than those of tariffs. At most, tariffs can completely close the market of the country imposing them. By contrast, the IPRs imposed by a firm or by cluster of allied firms close global markets for all the other firms. While these clusters do not coincide with specific countries, they closely overlap with them, and as a consequence tend to create a new sort of national comparative advantage. However, although IPRs act like global tariffs, other countries cannot reciprocate them. Thus, unlike tariffs, they are associated with forced specialization and with increases in global trade. Countries which are prevented from specializing in certain fields must import goods or licenses from the holders of the legal rights on the related knowledge.
Both countries and firms are forced to specialize in restricted fields, the overall consequence being a possible polarization in innovativeness across firms as well as across countries. Moreover, if in all industries (albeit to different extents) technology is cumulative in nature, the same polarization dynamics should persist at sectoral level as well. A picture of these dynamics emerges rather sharply from Figure 1 (panel A and B). As will be seen from Figure 1, the degree of inequality in the distribution of patents increases over time both among firms and among countries. The degree of polarization is shown to be constantly higher for countries than for firms. There are many reasons why this is so: for example, within the same country firms undertake joint research activities that are impossible across national borders, or they more easily engage in cross-licensing or alliances to fight rival patenting activities.2 But the main reason is probably
2 The market exclusion of competitors can be secured by pre-emptive patenting focusing on obvious and
related to the fact that countries can wield different punishment devices in order to support, or defend, their national companies. Thus, at the micro level each firm has a sense of insecurity due to the fear that its investment strategies may be blocked by other firms. At the macro level, this sense of insecurity is exacerbated by differences among the political, military, and economic retaliation capabilities of countries.
Figure 1. World distribution of patents.
Panel A. All sectors.
.5
.6
.7
.8
.9
1
0
50
00
00
10
00
00
0
15
00
00
0
20
00
00
0
P
a
te
nt
s
o
u
ts
ta
nd
in
g
1980 1985 1990 1995 2000 2005
Year
Patents outstanding Gini between-firm Gini between-country
Panel B. Per sector (Gini index between-country).
.7
.7
5
.8
.8
5
.9
.9
5
G
in
i be
tw
ee
n-c
o
un
tr
y
1980 1985 1990 1995 2000 2005
Year
Electrical eng. Instruments
Chemistry and pharm. Process eng. Mechanical eng.
Source: authors’ calculations on European Patent Office data (EPO, 2008). For reasons of space, we do not report a comparison between the Gini index between firms and the Gini index between countries for each sector. However, an unreported analysis shows that, also at an industry level, patent polarization is always higher between countries than between firms.
Because of TRIPs, this cross-country polarization dynamics became sharper and affected the relative economic importance and power of the major capitalist countries. In spite of the scientific, political and military dominance of the US, the 1980s saw a remarkable challenge raised by West Germany and Japan against American capitalism. While the US relied on a science-based system of top-down innovation which had its counterpart in a detailed Fordist division of “flexible labour” at the bottom level, West Germany and Japan relied on an engineering-based system of bottom-up innovation and continuous quality improvement which privileged long-term labor relations (see Hall and Soskice, 2001, and Barca et al., 1999). In a world of weak formal intellectual property rights, the American system was at an evident disadvantage: top-down formal science had to be expressed in fairly clear language and could be freely exploited by competent users, while bottom-up engineering improvements consisted much more of tacit knowledge embodied in humans, equipments and their relations, and they could not be easily used by competitors. The situation changed with the reinforcement of IPRs: top-down systems were better able to express their innovations in clear formulas which could be patented, while bottom-up systems saw the scope of their flexibility seriously restricted by the risk of infringing the IPRs of other countries. Thus the relative innovative performances of the US and its main competitors reversed.
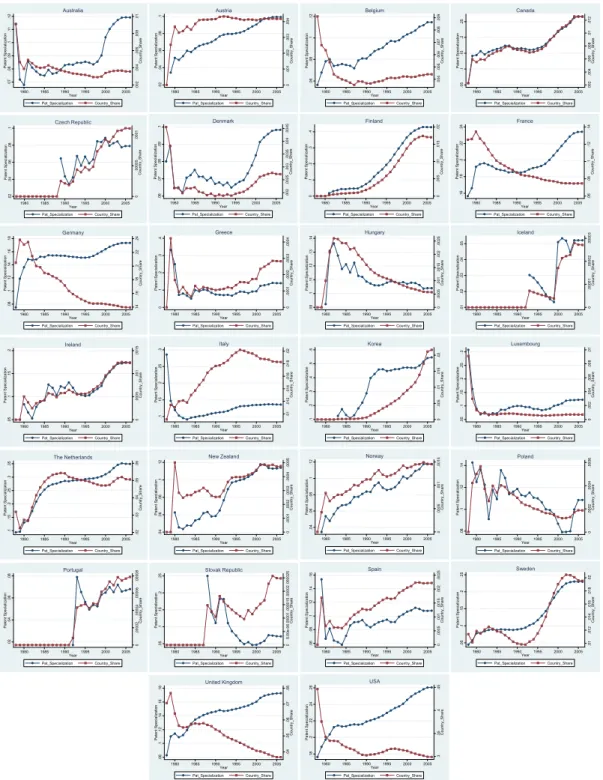
Available evidence, indeed, shows that, after the TRIPs, the US continued to increase – even at slightly increasing rates – their patent specialization in ICT technology. But Germany was forced (and has now succeeded) to adapt its patent specialization pattern to the new system, enhancing its patenting activity in ICT – such as electrical engineering and precision instruments – at the expense of its innovation activity in mechanical engineering (see figures A1 to A5 in the Appendix, where it is shown how after the TRIPs the within country share of mechanical engineering patents in Germany starts to decline). However, it should also be noted that the positive effect of the TRIPs on the US’s innovation performance did not last long, because the share of US patents (relative to the total of global patents) in all sectors entered progressive decline from around 2000. This recent worsening of the US’s relative position may be the consequence of a reduction of investment opportunities for US firms due to the exacerbated fragmentation of IPRs in a country that particularly strongly enforced intellectual monopolies as well as it may be the result of successful industrial strategies of other countries.
other’s investments (even within IP-rich countries) through restrictive contractual practices such as refusal to license and exclusive licensing. Finally, this restriction of investment opportunities may be associated with a new sort of comparative advantage which is quite different from the standard comparative advantage considered in the Ricardian theory of international trade (and, as we shall see in the following section, also from the more recent theories of intra-industry trade).
3. Related literature.
The traditional argument in favor of a tighter system of IPRs is that it fosters innovation, since it guarantees a monopolistic position (and monopolistic profits) to the innovator.3 From a macro point of view, this argument has been
translated into a strengthening of the IPRs system worldwide. While some authors argue that this should result in an increased aggregate R&D activity, because it positively affects the ability of firms to transfer technology abroad and go multinational (see, for instance, Taylor, 1994), others claim that a stronger IPR system may also give rise to an increasing differential in innovation rates across countries. For example, Helpman (1993) proposes a model with endogenous innovation and shows that the rates of innovation differ across countries whenever a given country has a stock of knowledge in inventive activity higher than that of the other countries, so that the more this country invests in innovation, the greater become its cumulative stock of knowledge and its subsequent innovation rates. A tighter system of IPRs thus has a negative effect on the innovation rates of the less developed countries, inasmuch as it reduces the South’s possibilities to imitate the North’s technology. Using a model similar to Helpman’s (1993), Lai (1998) discusses different channels of international technology diffusion and maintains that stronger intellectual property protection depresses the rate of product innovation in less developed countries if production is transferred from the North to the South mainly through imitation.
Whilst this body of literature shows that stronger IPRs may produce a polarization in innovativeness by protecting countries already rich in knowledge and decreasing the international transfer of existing technology, it also assumes that stronger IPRs do not affect the costs of producing new technology.
In our opinion, this strand of analysis fails to acknowledge the fact that innovations build also on past proprietary innovations. In knowledge-intensive productions, indeed, new technology has a sort of IPR pedigree, so that the production of new technology requires an increasing number of proprietary
3 This is probably the most frequently cited purpose of patents. More generally, as Mazzoleni and Nelson
intellectual assets (see Heller and Eisenberg, 1998, and Pagano and Rossi, 2004). As a consequence, a tighter system of IPRs increases the cost of producing innovation relatively more for countries with relatively lower endowments of IPRs. Thus, some countries enjoy security from owning knowledge and will invest in the relative skills and assets, which, in their turn, in a cumulative process, enable those countries to acquire the ownership of additional knowledge, thus generating a “snowball dynamics”. Other countries may be trapped in a vicious circle whereby the lack of proprietary monopoly knowledge discourages investments in human capital and other related assets, whose absence discourages, in turn, the acquisition of intellectual property rights. In such contexts, countries poor in IPRs are unable to catch up with countries rich in IPRs.
A new perspective on comparative advantage thus emerges. In particular, each country is forced to specialize in those industrial fields in which it has a relatively larger initial IPRs endowment; in these fields, in turn, each country acquires increasing innovation and production capabilities.4
The neoclassical “pure” theory of trade, as formulated in the Heckscher-Ohlin tradition, explains the relative specialization of countries by arguing that it is determined by relative factor endowments, where by “factors” are meant immobile or physical resources (Heckscher, 1919; Ohlin, 1933). Despite the very large amount of studies that have further developed the standard approach to comparative advantage, this traditional understanding has also been strongly questioned by a more recent body of literature. A heterogeneous strand of economic analysis suggests that the determinants of specialization may lie at the institutional level, to the extent that national institutional architectures affect both production and transaction costs.5
Dosi et al. (1988) argue that differences in patterns of technical change among countries are not due to differentials in physical resource endowments; or, at least, different factor endowments are not a sufficient condition for diverging innovation patterns to arise. They instead maintain that the fundamental international differences relate to country-specific conditions of technological learning and accumulation. Specifically, recalling the “local learning” intuition of
Atkinson and Stiglitz (1969), Dosi et al. (1988) affirm that the degree of
match/mismatch between sector-specific learning dynamics and
4 An important body of literature proposes that countries’ innovation patterns may be also further
specific institutions at the country level determines the comparative advantages of nations.
More recently, Hall and Soskice (2001) have explained that national technological trajectories are strongly connected with national institutional systems and national systems of coordination among economic actors. On the one hand, in market forms of coordination (i.e. the Anglo-Saxon model), both the equity market and the labour market have a high degree of flexibility, which encourages the use of the “exit” option by the parties to contracts in economic relations. Hence liberal market economies should be better at supporting radical innovation, which requires a low asset specificity. On the other hand, non-market forms of coordination (i.e. the German model) favor long-term relationships among most actors within the economy, and they facilitate the development of highly specific assets which substantially characterize incremental innovation. Using a similar approach, Pagano (2007b) and Belloc and Bowles (2009) argue that international trade can be generated by comparative institutional advantage and can amplify institutional and cultural diversity.
It deserves to be mentioned, in addition, also the role played by institutional path dependence in dynamic systems’ evolution and learning spillovers. A well-known stream of literature (see, e.g., David, 2005, 2007, and David and Olsen, 1992) discusses how the institutional dimension in technological progress strongly impacts on economic system equilibria, inducing non-ergodic configurations. In particular, Nelson and Sampat (2000) and Nelson (2008), among others, explain how long-run technical change must be understood as involving the co-evolution of physical technologies, social technologies and regulating institutions. Cohen and Levinthal (1989), moreover, show how innovative activities can generate learning spillovers, so enhancing the “absorptive” capacity of firms (see also Griliches, 1992, Ciccone, 2002, Autant-Bernard and Mairesse, 2007, Mancusi, 2008).
We build on this literature by arguing that countries’ initial conditions – physical resource endowments and national institutional settings – almost certainly have had a role in determining initial technological conditions and, hence, the initial distribution of proprietary intellectual assets. However, in the presence of a worldwide system of IPRs, the possession (or the lack) of proprietary knowledge assumes a crucial role in opening (or closing) opportunities for future investment. The effect of physical resource endowments, if any, disappears and institutions evolve to support the specialization dynamics.
Our approach also differs from the theory of intra-industry trade developed by Krugman (1980) by drawing on Dixit and Stiglitz’s (1977) work on monopolistic competition where monopoly power makes it possible to recoup the set-up costs originating increasing returns, but free entry precludes the possibility of earning extra-profits. Under increasing returns to scale, there is a trade-off between product variety and the abatement of costs. Dixit and Stiglitz show that, under some conditions, markets can approximate the optimal variety of products. Building on their findings, Krugman argues that, for the selfsame reasons, countries specialize in different products, and that gains from trade arise from the fact that the opening of markets allows for a greater variety of products. Krugman’s approach provides an adequate rationale for the very large amount of intra-industry trade among countries with similar factor endowments, which the traditional theory of comparative advantage fails to explain. However, it shares with the latter theory the assumption of free entry: monopolistic competition implies that intellectual monopoly and market closure cannot have important roles. In both cases, specialization follows from an enlargement of investment opportunities due to international trade. In this sense, our hypothesis is different from both these contentions. We maintain that specialization arises from a restriction of investment opportunities due to intellectual monopoly, and that increased trade may be an outcome of forced specialization. In our view, all three of these forces are at work in the present economy and it would be desirable to compare their relative abilities to explain different patterns of international trade. In this paper we take only a first step in this direction, trying to show that intellectual monopoly constraints can explain investment opportunities and specialization patterns.
4. Theoretical underpinnings.
By definition, underlying the innovation process there is a process of discovery aimed to produce new knowledge and the embodiment, combination or synthesis of such knowledge in a new object or method. IPRs can be seen as residual ownership claims over this novel knowledge (Merges, 1999).
In a context in which an innovation can be reproduced by a third party through free ride imitation, the inventor loses the ex-ante incentive to invest in the innovation process, inasmuch as he cannot anticipate the share of the benefits from the investment that he will be able to reap, or if he anticipates to enjoy returns from innovation lower than the costs. This is essentially the consequence of a problem of contractual incompleteness, since it is impossible to write a contract that specifies which party has which rights about the intangible asset usage in every possible state of the world. IPRs, thus, can be understood as (decisive) residual rights of control in the sense of Hart (1995).
residual uses by default. Nonetheless, IPRs are only a second best solution, given that they entail a social welfare loss due to monopoly exploitation of the new technology. While the efficiency gap between the first-best and the second-best solution is always strictly negative, the efficiency loss is lower for stand-alone innovations than for interdependent innovations. In the case of interdependent innovations (as most innovations are), IPRs add to the static costs of monopoly two other sources of inefficiency, which can be interpreted in terms of negative
externalities (Parisi et al., 2004). First, when innovations are complementary
inputs for production, there are static externalities, in that each IPRs owner has the right to exclude the other complementary IPRs owners from the possibility of undertaking production (simultaneous anticommons), so that the exercise of the right of exclusion by one eliminates the value of the same right held by the others. Second, when innovations are cumulative – with each subsequent innovation building on the last – there are dynamic externalities, in that the exclusion rights are exercised in consecutive stages (sequential anticommons), so that the exercise of the right of exclusion by the IPRs owner at a lower level of the chain incapacitates following potential innovators.
As historical and industrial studies recognize, only few innovations are pioneering, while most technologies are highly interdependent (e.g., David, 1985). Innovations undergo a gradual evolutionary development in which they are not only outputs but also inputs to the creative process, and in which, so, they are intimately interconnected both horizontally and vertically. This makes the negative externalities arising from IPRs pervasive in knowledge intensive productions. Such negative externalities can be also seen as a problem of loss in investment opportunities, that is peculiar to the exclusive control of intangible assets. The ownership of physical assets does not prevent third parties from investing in the same technology in order to produce a similar asset. IPRs, instead, do so: IPRs prevent unauthorized non-right-holders from reproducing the (proprietary) technology and from using it as an input for production. In other terms, IPRs affect investment opportunities, in such a way that only the IPR holder is entitled to invest in a certain technology, while others cannot. Therefore, when technologies are cumulative and interdependent, on the one hand, an individual that lacks IPRs also loses the possibility to invest in those technologies that are based on proprietary knowledge owned by others; on the other hand, an individual that enjoys some IPRs can invest only in those technologies that do not require other IPRs than his own, unless transactions of IPRs are undertaken in the market of intellectual assets.
rights. Put differently, that each party follows a certain investment-innovation path should not be a matter of concern, since such trajectories of technological development are efficient. Indeed, if at any time it is technologically efficient for some IPRs to be exchanged between two parties – for example on the basis of their technological competencies –, this transaction will be executed.
However, in the real world this does not happen, because the transaction costs are positive (and high) in the market of IPRs. First, in technologically active environments, the search to find the proprietary technology appropriate for a certain production is costly (Somaya and Teece, 2000). Second, technologies are subject to a technical and commercial uncertainty that may lead parties to substantially different beliefs about an IPR’s value, and this can entail costs during licensing negotiations (Mergers and Nelson, 1990, 1994; Merges, 1994). Third, if the exact boundaries of the IPRs are unclear, the parties to an IPR transaction can use this uncertainty to their advantage, giving rise to a “hazard” in licensing contracts, which in its turn results in further costs (Maskus, 1998; Somaya and Teece, 2000).
The main direct consequence of positive transaction costs is that they stifle the IPR market and dissuade parties – at least to some extent – from undertaking efficient exchanges of proprietary intellectual assets. Innovators thus tend to invest in the development of new knowledge in the technological field where they enjoy some IPRs from the outset. This in turn induces them to acquire further IPRs in the same field, and so on (Pagano and Rowthorn, 1994; Landini, 2012). Moreover, while transaction costs characterize the within-country IPR market to a certain extent, they are likely to have a stronger effect in cross-country transactions, as we have mentioned in Section 2. Thus, what we could finally observe is that assets encounter great friction in moving across borders, with relatively more wealthy nations finding the development of their innovative production capability protected by the ownership of IPRs assets (Pagano and Rossi, 2004).
5. Estimating IPR constraints on investment opportunities.
5.1. Basic estimation strategy.
Our argument is that the amount of intellectual assets (protected by IPR) that a given country owns in a certain sector positively affects the investment opportunities which that same country is able to exploit in the same sector, while, simultaneously, the higher the country’s investment effort in a given sector, the more intense its patenting in that sector becomes. The empirical investigation of our hypothesis poses two difficulties.
impossible. As a consequence, a traditional cross-country methodology would make it difficult to interpret the correlations observed in a causal sense. To solve this problem, we rely on the methodology proposed by Rajan and Zingales (1998) and we make predictions about within-country differences in investment levels between industries based on a measure of patent activity outcomes that varies with both country and industry. Specifically, closely following the empirical approach by Rajan and Zingales, we express both the dependent and independent variables in the regression model as a ratio between industry level and global level quantities, for each sector, country and year. This particular specification allows us to ask whether industrial sectors that show a relatively larger share of patents over the total country’s patent endowment also show higher share of investments, and viceversa. As Rajan and Zingales (1998) point out, in so doing, we are able to correct for country and industry characteristics in ways that traditional cross-country studies are unable to correct for and that are less subject to criticism about omitted variable bias or model misspecification.
A second problem concerns the investigation of a two-way relation between country patenting and country investing and, in particular, the existence of complementarities between these two variables. An equation-by-equation estimation would not enable us to detect causal relations. Thus, we develop a system of two equations, in which we explicitly model the two-way relationship.
Formally, we consider the following baseline two-equation system:
I t
k,i
I t
k =β0+β1
P
tr
k,i
t0
t
∑
P
tr
k
t0
t
∑
+β2...KCk+βK+1...NSi+βN+1...ZTt+εi,k,t (I)P
tr
k,i
t0
t
∑
P
tr
k
t0
t
∑
=δ0+δ1I
t−1
k,i
I
t−1
k +δ2...KCk+δK+1...NSi+δN+1...ZTt+δZ+1ϑi,k,t+ηi,k,t (II)
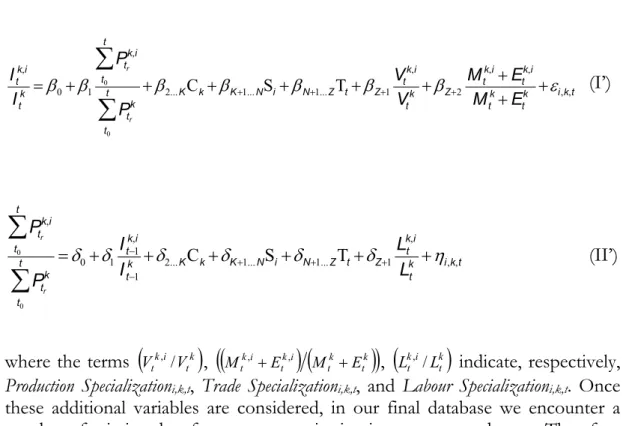
where the terms
(
k)
t i k
t I
I , / and I
t−1
k,i
/I
t−1
k
(
)
, which we call Investment Specializationi,k,tand Investment Specializationi,k,t-1, measure the share of country k’s investments in
industry i over the total of country k’s investments in manufacturing at time t and
t-1, and where the term ⎟⎟
⎠ ⎞ ⎜
⎜ ⎝ ⎛
∑
∑
tt k t t
t i k
tr Pr
P
0 0
,
measures the share of country k’s patents in industry i over the total of country k’s patents held at time t, where tr is a generic time between t0 and t. Furthermore, Ck, Si, and Tt are vectors of, respectively, country, sector and time dummy
indicators; ϑi,k,t is an excluded instrument that enables us to meet identification
requirements; β0 and 0 are the two model constants; i,k,t and ηi,k,t are idiosyncratic
disturbances that change across i, k, and t. In words, what we estimate is whether the within-country distribution of patents between industries determines the within-country distribution of investments between industries, and whether, in turn, the amount of a given country’s patents in a certain industry is affected by the previous investments undertaken by that country in that industry. Notice that Investment Specializationj,k,t-1 is lagged in equation (II), while Patent Specializationj,k,t is
not lagged in equation (I). We employ this particular lag structure of the two-equation model in order to account for the fact that, on the one hand, investments may take some time to get to patents, and that, on the other, patents should immediately affect investment opportunities. Nonetheless, we run two additional model specifications with a different lag structure and show that the choice of lags does not substantially affect our estimates.
Our two-equation model is a linear model. In principle, also a quadratic relationship between Patent Specializationj,k,t and Investment Specializationj,k,t could be
tested. However, in unreported regressions in which a quadratic term is included, we observe strong collinearity problems. Therefore, we impose a linear form on the model specification.
In our basic model estimation, we jointly estimate the two equations using a three-stage least square procedure (3SLS hereafter). The three steps in the 3SLS method are the following. The first step is identical to the first step of a two-stage procedure (2SLS): the predicted values of each endogenous variable on all the exogenous regressors are obtained. In the second step, we substitute the predictions of the patent specialization found in the first step in place of Patent Specializationi,k,t on the right-hand-side of equation (I) and applied OLS. The
residuals are then used to obtain an estimate of the covariance matrix of the error terms of the two equations. In the third step, the estimate of the cross-equation correlation matrix is used as a weighting matrix to calculate the generalized least square estimator (GLS). The last two steps are iterated over the estimated disturbance covariance and parameter estimates until the parameter estimates converge.
with the risk of multicollinearity. Third, we do not incur the problem of limited degrees of freedom, since we use multiple observations per country over five industries and 29 years, as we will discuss below.6
5.2. Data and variables.
In order to estimate our model, we need appropriate and comparable measures of investments and patent activity. Data on investments are obtained from the levels of gross fixed capital formation provided by the OECD’s Structural Analysis Database – STAN – (OECD, 2009) which, in its turn, relies on the Official Annual National Accounts obtained directly from national sources. The data are classified by International Standard Industrial Classification (ISIC) code. Data on patents are obtained from the European Patent Office Database (EPO, 2008). Patent data are provided at the highest possible disaggregation level, because information on all the individual patents registered at the EPO are included.
In order to make patents and investments data comparable, we aggregate them through a consistent classification at the country (i), industry (ii) and time (iii) level.
i) While investment data are already available at the country level, for
patent data we perform an aggregation procedure. We use the applicant’s nationality to determine the patent’s nationality. When more than one applicant is related to one patent, we count the patent once in each applicant’s country (for instance, if two German firms had applied for the same patent, the patent is counted once for Germany, but if a German and a French firm had applied for the same patent, the patent is then counted once for Germany and once for France). By this means we have information on both patents and investments for
26 OECD countries.7
ii) At the industry level, on the one hand, investments data are
classified according to 4-digit ISIC codes, on the other, patents data are organized in a 30 classes International Patent Classification (IPC) System, which enables us to work at a high disaggregation level. Nevertheless, some economic
6 The final panel of data we use in the econometric analysis is an unbalanced panel. Unfortunately, the
unbalanced form of our panel, in which there are serial missing data, prevents us from employing Vector Auto-Regression (VAR) type models, that in our regression context provide statistically unreliable estimates. Nonetheless, in our estimation strategy we both exploit the variability of data over time and include time dummies. Hence, we are confident that our dynamic panel model captures the two-way causality process between patent specialization and investment specialization acceptably.
7 Australia, Austria, Belgium, Canada, Czech Republic, Denmark, Finland, France, Germany, Greece,
activities are characterized by a very low number of patents, so that the inter-country comparison may not be reliable in some cases. To circumvent this problem, we aggregate both investments and patents data according to the 5-industry ISI-INIPI-OST Classification System (elaborated by the German Fraunhofer Institute of Systems and Innovation Research – ISI – the French Patent Office – INIPI – and the Observatoire des Sciences and des Techniques – OST –). See Table 1 for a summary description of our final classification.
iii) As a time structure, we use yearly data. In particular, for patents data we consider the year of the application at the EPO of published patents.
Table 1. OST/INPI/ISI-technology Classification.
I. Electrical
Engineering II. Instruments
III. Chemistry and
Pharmaceuticals IV. Process Engineering
V. Mechanical Engineering
Electrical machinery and apparatus, electrical energy
Optics
Organic fine chemistry, macromolecular
chemistry, polymers
Chemical engineering
Machine tools, engines, pumps, turbines, mechanical elements
Audio-visual technology Analysis, measurement, control technology
Pharmaceuticals, cosmetics
Surface technology, coating, materials, metallurgy
Transport, space technology, weapons
Telecommunications and
information technology Medical technology
Agriculture, food chemistry
Materials processing, textiles, paper, handling, printing
Consumer goods and equipment
Semiconductors Nuclear engineering
Chemical and petrol industry, basic materials chemistry
Agricultural and food processing, machinery and apparatus, and
environmental technology
As said, we add country, industry and time indicators in both equations by means of three vectors of dummies in order to estimate country, industry and time fixed effects. More specifically, country fixed effects refer to the country-specific characteristics that can affect both patent and investment specialization (such as countries’ comparative advantage due to physical and human factor endowments, and to institutional features); industry fixed effects soak up the data variability due to technology differences across sectors, according to which some sectors exhibit patenting (or investment) activity more intensely than the others, keeping investment (or patenting) activity equal. Finally, time fixed effects explain the variation in the response variables due to unobservable time-specific factors (e.g., changes in the international IPRs standards), which may underlie both patent and investment specialization patterns in a way virtually constant across countries. Hence we do not really need to include additional explanatory variables (see Rajan and Zingales, 1998). Nonetheless, as a robustness check, we estimate further model specifications in which we include two control variables (possibly) relevant to explaining country investment specialization across industries: the
industry-relative share of the value of goods produced in a year (Production
Specializationi,k,t), which we consider to be a proxy for expected profits as well as
for funds available at the industry level; and a measure of the industry’s trade openness (Trade Specializationi,k,t) calculated as the sum of industry exports and
imports over the sum of the total country imports and exports in order to allow for the potential relationship between the degree of industry-level trade openness and investment specialization.
We also include the industry-relative share of the wages paid in a year (Labour Specializationi,k,t) as one of the determinants of the patent specialization in
equation (II), in order to meet identification requirements (i.e. Labour
Specializationi,k,t is the excluded instrument ϑi,k,t). In knowledge intensive
productions, employees are a crucial part of innovation programs. For example, Grossman and Helpman (1994) argue that the probability of R&D success is proportional to the labor employed in the research project; and, more recently, Hall (2002) reports that fifty per cent or more of R&D spending consists in the wages and salaries of highly educated scientists and engineers. Given data availability constraints, we consider a Labour Specializationj,k,t variable that includes
the wages paid to all types of employees. Although this might introduce some noise in the estimation, at the same time, however, an extensive wage variable measure allows us to take into account also the contribution to the development of innovations by the personnel not employed in R&D programs. The three variables Production Specializationi,k,t, Trade Specializationi,k,t and Labour Specializationi,k,t
are obtained from the STAN database (OECD, 2009). In our econometric study, these variables are expressed at a sectoral level according to the 5-industry ISI-INIPI-OST Classification System we used for patents and investment data.
Itk,i
Itk =β0+β1
Pt r
k,i
t
0
t
∑
Pt r
k
t0 t
∑
+β2...KCk+βK+1...NSi+βN+1...ZTt+βZ+1Vtk,i
Vtk +βZ+2
Mtk,i+
Etk,i
Mtk+
Etk +εi,k,t (I’)
P
tr
k,i
t0
t
∑
P
tr
k
t0
t
∑
=δ0+δ1I
t−1
k,i
I
t−1
k +δ2...KCk+δK+1...NSi+δN+1...ZTt+δZ+1 L
t
k,i
L t
k +ηi,k,t (II’)
where the terms
(
k)
t i k t V
V , / ,
(
(
) (
tk)
)
k t i k t i kt E M E
M , + , + ,
(
Lkt,i/Ltk)
indicate, respectively,Production Specializationi,k,t, Trade Specializationi,k,t, and Labour Specializationi,k,t. Once
these additional variables are considered, in our final database we encounter a number of missing data for some countries in given sectors and years. Therefore we are not able to exploit the full set of 5 industries × 26 countries × 29 years information.
It is worth mentioning that our model, as specified in equations (I) and (II) and equations (I’) and (II”), is subject to a two-fold caveat. On the one side, there might be a non-full geographical coincidence between IPRs endowments and investment location at a country level due to delocalization of production; on the other side, investment opportunities granted by IPRs endowments in a given sector might materialize in a different sector. We partially circumvent the first limit by restricting our sample to OECD countries, and this reduces – although it does not eliminate – the heterogeneity of the sample in terms of different countries’ delocalization strategies. Moreover, we tackle the second issue by considering a 5-industry classification rather than a more refined one, in this way we reduce the empirical consequences of inter-sectoral spillovers and of possible dispersion of investment opportunities across sub-industries.
5.3. Basic estimation results.
Table 2. Cross-country panel estimation (1978-2006 period): results.
(1) 3SLS [Baseline model]
(2) 3SLS [Partially augmented model – version a]
(3) 3SLS [Partially augmented model – version b]
(4) 3SLS [Fully augmented model]
Variable Investment
Specializationi,k,t
Investment
Specializationi,k,t
Investment
Specializationi,k,t
Investment
Specializationi,k,t
Patent Specializationi,k,t 1.483
(0.148) ***
1.201 (0.198) ***
1.414 (0.309) ***
1.214 (0.278) *** Production
Specializationi,k,t
0.266
(0.083) ***
0.248 (0.045) ***
Trade Specializationi,k,t 0.082
(0.145)
0.023 (0.130)
Constant 0.222
(0.055) ***
0.030 (0.044)
-0.072 (0.070)
0.156 (0.042) ***
Country dummies yes yes yes yes
Industry dummies yes yes yes yes
Time dummies yes yes yes yes
Variable Patent
Specializationi,k,t
Patent
Specializationi,k,t
Patent
Specializationi,k,t
Patent
Specializationi,k,t
Investment
Specializationi,k,t-1
0.477 (0.041) ***
0.521 (0.049) ***
0.481 (0.056) ***
0.515 (0.057) ***
Labour Specializationi,k,t 0.211
(0.045) ***
0.119 (0.043) ***
0.183 (0.032) ***
0.113 (0.057) ***
Constant -0.120
(0.043) ***
-0.046 (0.048)
0.055 (0.043)
-0.091 (0.039) **
Country dummies yes yes yes yes
Industry dummies yes yes yes yes
Time dummies yes yes yes yes
Statistical details
R-square of Eq. (I) 0.518 0.674 0.564 0.673
R-square of Eq. (II) 0.541 0.540 0.539 0.538
Wald Test of Eq. (I):
p-value 0.000 0.000 0.000 0.000
Wald Test of Eq. (II):
p-value 0.000 0.000 0.000 0.000
Anderson Statistic
(p-value) 94.953 (0.000) 16.123 (0.000) 14.782 (0.000) 10.175 (0.006)
Sargan Statistic (p-value) 1.667 (0.196) 0.477 (0.489) 0.212 (0.645) 0.014 (0.905)
Number of observations 682 682 675 675
Our two-way relation argument finds strong support in the data. The parameter estimates confirm the positive and statistically significant effect (at the 1% level) of patent specialization on investment specialization – in particular, the estimated effect is greater than one – also controlling for country, industry and time fixed effects. In turn, one-year-lagged investments positively affect patent activity. Hence, although estimated correlations do not establish certain economic causality, the statistical results suggest that investment opportunities of countries and their patent endowments are linked in a complementarity relationship. Moreover, the results obtained from models (2) and (4) in Table 2 show that the relative share of the value of goods produced in a given industry positively influences investment activity in the same industry, while models (3) and (4) in Table 2 reveal that the degree of trade openness does not affect investment specialization in a statistically significant way.
Results from a diagnostic analysis, reported at the bottom of Table 2, confirm the statistical validity of these findings. First, we check the relevance of the instruments used in the estimation by examining the first stage R-square. In all the model specifications from (1) to (4) we obtain a first stage R-square always greater than 0.3 (i.e. the conventionally used acceptance threshold (Shea, 1997)). Second, we verify the model’s identifiability by means of the Anderson canonical correlation statistic and the Sargan test of overidentifying restrictions. Both tests allow us to consider the instruments as adequate in identifying the model. Then, as an overall diagnostic procedure, we perform the Wald test, which leads us to reject the null hypothesis of joint non-statistical significance of all the parameters.8
One might argue that larger industries have larger shares of patents and larger shares of fixed capital investments both for the same year and across years. This could lead to the positive correlation we observe in the data between patent specialization and investment specialization. In order to check the robustness of our findings to this possibility, we run industry specific regressions on sub-samples of observations by sector. Doing so, we analyze the relationship between patent and investment specialization within industries, circumventing sector-size effects, if any. In particular, we employ the industry classification reported in Table 1 and run five regressions, distinguishing electrical engineering, instruments, chemistry and pharmaceuticals, process engineering, and mechanical engineering. We perform this robustness check through the Arellano-Bond method (Arellano and Bond, 1991). In the Arellano-Bond procedure, a
8 We rule out the possibility that collinearity between the patent specialization variable and the production
Table 3. Cross-country panel estimation (1978-2006 period) – within industry: results.
(1) (2) (3) (4) (5)
Arellano-Bond [Electrical Engineering]
Arellano-Bond [Instruments]
Arellano-Bond [Chemistry and Pharmaceuticals]
Arellano-Bond
[Process Engineering]
Arellano-Bond [Mechanical Engineering]
Variable Investment
Specializationi,k,t
Investment
Specializationi,k,t
Investment
Specializationi,k,t
Investment
Specializationi,k,t
Investment
Specializationi,k,t
Patent Specializationi,k,t
0.098
(0.020) ***
0.029
(0.015) *
0.151
(0.097)
0.415
(0.102) ***
0.029
(0.047)
Constant 0.016
(0.003) ***
0.008
(0.002) ***
0.069
(0.019) ***
0.096
(0.022) ***
0.142
(0.017) ***
Statistical details
Patent Specializationi,k,t endogenous
Instruments for differenced eq.
Investment Specializationi,k,t (1-lag)
Production Specializationi,k,t
Trade Specializationi,k,t
Wald χ2 ( prob > χ2) 377.03 (0.000) 85.95 (0.000) 72.23 (0.000) 184.66 (0.000) 11.82 (0.000)
Number of observations 292 274 212 232 231
We find again that Patent Specializationj,k,t has a positive and statistically
significant effect on Investment Specializationj,k,t, within industries. Only in the
mechanical engineering sector the estimated parameter of Patent Specializationj,k,t
has a statistical significance weaker than an acceptable threshold, while in chemistry and pharmaceuticals the statistical significance of the estimated coefficient is around 15%. Industry-size effects, therefore, if present, do not drive our estimation results obtained from the whole sample reported in Table 2.
We also check the robustness of the estimation results presented in Table 2 to a different estimation method, besides the Arellano-Bond procedure, and to a different lag structure of our model. Specifically, we consider three additional model specifications. In the first specification, we estimate the investment specialization equation (I) and the patent specialization equation (II) using a traditional two-stage procedure (2SLS) for panel data. In this case, equation (II) is the first stage equation, while equation (I) is the second stage equation. In the second and third specification, we run a 3SLS estimation in which, respectively, Labour Specializationj,k,t-1 (in equation (II)) and both Labour Specializationj,k,t-1 (in
equation (II)) and Patent Specializationj,k,t-1 (in equation (I)) are one-year lagged. The
estimation results obtained in this robustness check are reported in Table 4. In all the three additional model specifications, the empirical findings confirm the positive two-way relationship between patent specialization and investment
specialization. Moreover, we observe that when the one-year lagged Labour
Specializationj,k,t-1 is introduced in the model, parameter estimates converge only if
country, sector, and time fixed effects are excluded in equation (II) (see model (2) – version c – in Table 4). When both Labour Specializationj,k,t-1 (in equation II) and
Patent Specializationj,k,t-1 (in equation (I)) are one-year lagged, and country, sector,
and time fixed effects are included in equation (II), then the one-year lagged Labour Specializationj,k,t-1 is associated to a non-statistically significant parameter
(see model (3) – version d – in Table 4). In conclusion, it is worth emphasizing that we consider the 3SLS estimation our benchmark model in this analysis, with
respect to the Arellano-Bond and the 2SLS methods.9
9 We are aware of the fact that a cointegration test would exclude further doubts about causality.
Table 4. Robustness checks to different estimation method and lag-structure.
(1) 2SLS
[Baseline model] (2) 3SLS
[Fully augmented model – version c]
(3) 3SLS
[Fully augmented model – version d]
Variable Investment
Specializationi,k,t
Investment
Specializationi,k,t
Investment
Specializationi,k,t
Patent Specializationi,k,t 1.445
(0.143) ***
2.002 (0.225) ***
Patent Specializationi,k,t-1 1.189
(0.273) ***
Production Specializationi,k,t 0.245
(0.046) ***
0.277 (0.044) ***
Trade Specializationi,k,t 0.021
(0.106)
0.028 (0.126)
Constant -0.132
(0.041) *** omitted
0.020 (0.045)
Country dummies yes yes yes
Industry dummies yes yes yes
Time dummies yes yes yes
Variable Patent
Specializationi,k,t
Patent
Specializationi,k,t
Patent
Specializationi,k,t
Investment Specializationi,k,t-1 0.390
(0.083) ***
0.304 (0.029) ***
0.526 (0.049) ***
Labour Specializationi,k,t 0.382
(0.129) ***
Labour Specializationi,k,t-1 0.077
(0.021) ***
0.062 (0.043)
Constant 0.042
(0.033)
0.141 (0.003) ***
-0.035 (0.048)
Country dummies yes no yes
Industry dummies yes no yes
Time dummies yes no yes
Statistical details
R-square of Eq. (I) 0.460 0.227 0.684
R-square of Eq. (II) 0.604 0.328 0.549
F ( prob > F) 110.35 (0.000) -- --
Wald χ2 ( prob > χ2) 2712.96 (0.000) -- --
Wald Test of Eq. (I): p-value -- 0.000 0.000
Wald Test of Eq. (II): p-value -- 0.000 0.000
Number of observations 682 663 662
Note: significance level (“*” = 10%, “**” = 5%, “***” = 1%). Standard errors are reported in parentheses
5.4. Estimation results over the before-TRIPs and after-TRIPs periods.
In previous regressions we have shown that Patent Specializationj,k,t exerts a
positive and statistically significant effect on Investment Specializationj,k,t. We now
want to measure whether the magnitude of the statistical relationship running from Patent Specializationj,k,t to Investment Specializationj,k,t increases due to the
employ two different empirical strategies. First, we estimate our two-equation system through a 3SLS procedure using two sub-sets of observations, the first set containing observations referring to the 1978-1994 sub-period (before the TRIPs agreement) and the second containing observations referring to the 1995-2006 sub-period (under the TRIPs agreement). Second, we run an Arellano-Bond estimation over the whole set of observations and add a structural change variable to equation (I). This additional variable is calculated as the scalar product between Patent Specializationj,k,t and a dummy variable (Trips) that equals 1 if the
TRIPs agreements are implemented (and 0 otherwise). In this way we can explore if and how the marginal effect of the patent specialization on investment specialization has been affected by the TRIPs.
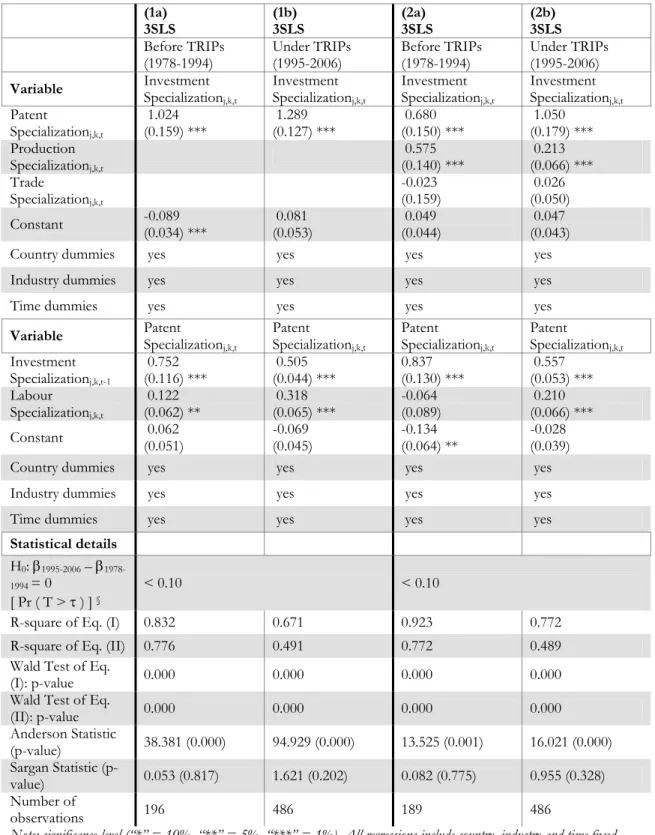
Results are collected in Table 5 and Table 6. In particular, Table 5 presents the regression results from the 3SLS estimation over the 1978-1994 and 1995-2006 sub-periods. Model specifications (1a) and (1b) of Table 5 do not contain explanatory variables in equation (I) other than Patent Specializationj,k,t and
industry, country and time dummies; in model specifications (2a) and (2b) of Table 5 we included also the two variables Production Specializationj,k,t and Trade
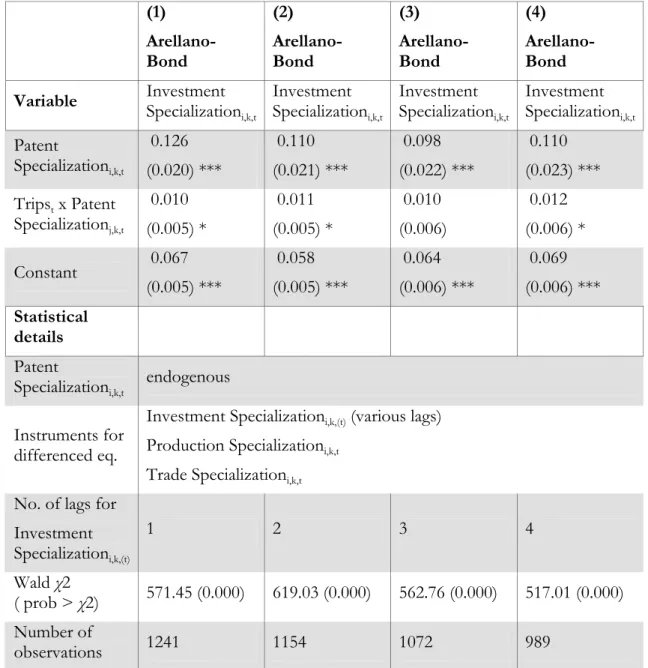
Specializationj,k,t. Table 6 shows the results from the Arellano-Bond estimation in
which the effect of a structural change variable is explicitly estimated. Table 6 contains four model specifications, where Investment Specializationj,k,t is included
respectively with one-, two-, three-, and four-year lags in the differenced
equation. Estimating the model with different lags for the Investment
Specializationj,k,t variable allows us to measure if, and to which extent, the lag
structure considered in the differenced equation modifies the final estimates. The findings from both the estimation strategies reveal an increase in the strength of the effect of patent specialization on investment activity after the
TRIPs. In particular, in Table 5 we show that the estimated effect of Patent
Specializationj,k,t on Investment Specializationj,k,t grows from 1.024 to 1.289 (i.e. by
about 25%) according to models (1a) and (1b), and from 0.680 to 1.050 (i.e. by about 54%) according to models (2a) and (2b), remaining statistically significant at the 1% level in both cases. We have then tested for the null hypothesis of zero difference between the estimated parameters of the Patent Specializationj,k,t variable
in the two sub-periods (respectively, β1978-1994 and β1995-2006): we find that the
difference between β1978-1994 and β1995-2006 is non-null and statistically significant in
both model specifications (1a)-(1b) and (2a)-(2b). This finding is corroborated by the results reported in Table 6, which show that – once the structural change variable is included in equation (I) – both such variable and Patent Specializationj,k,t
Table 5. Cross-country panel estimation (1978-1994 and 1995-2006 sub-periods): results.
(1a) 3SLS
(1b) 3SLS
(2a) 3SLS
(2b) 3SLS
Before TRIPs (1978-1994)
Under TRIPs (1995-2006)
Before TRIPs (1978-1994)
Under TRIPs (1995-2006)
Variable Investment
Specializationj,k,t
Investment
Specializationj,k,t
Investment
Specializationj,k,t
Investment
Specializationj,k,t
Patent
Specializationj,k,t
1.024 (0.159) ***
1.289 (0.127) ***
0.680 (0.150) ***
1.050 (0.179) *** Production
Specializationj,k,t
0.575 (0.140) ***
0.213 (0.066) *** Trade
Specializationj,k,t
-0.023 (0.159)
0.026 (0.050)
Constant -0.089
(0.034) ***
0.081 (0.053)
0.049 (0.044)
0.047 (0.043)
Country dummies yes yes yes yes
Industry dummies yes yes yes yes
Time dummies yes yes yes yes
Variable Patent
Specializationj,k,t
Patent
Specializationj,k,t
Patent
Specializationj,k,t
Patent
Specializationj,k,t
Investment
Specializationj,k,t-1
0.752 (0.116) ***
0.505 (0.044) ***
0.837 (0.130) ***
0.557 (0.053) *** Labour
Specializationj,k,t
0.122 (0.062) **
0.318 (0.065) ***
-0.064 (0.089)
0.210 (0.066) ***
Constant 0.062
(0.051)
-0.069 (0.045)
-0.134 (0.064) **
-0.028 (0.039)
Country dummies yes yes yes yes
Industry dummies yes yes yes yes
Time dummies yes yes yes yes
Statistical details
H0: β1995-2006 – β 1978-1994 = 0
[ Pr ( T > τ ) ] §
< 0.10 < 0.10
R-square of Eq. (I) 0.832 0.671 0.923 0.772
R-square of Eq. (II) 0.776 0.491 0.772 0.489
Wald Test of Eq.
(I): p-value 0.000 0.000 0.000 0.000
Wald Test of Eq.
(II): p-value 0.000 0.000 0.000 0.000
Anderson Statistic
(p-value) 38.381 (0.000) 94.929 (0.000) 13.525 (0.001) 16.021 (0.000)
Sargan Statistic
(p-value) 0.053 (0.817) 1.621 (0.202) 0.082 (0.775) 0.955 (0.328)
Number of
observations 196 486 189 486
Note: significance level (“*” = 10%, “**” = 5%, “***” = 1%). All regressions include country, industry and time fixed effects (coefficient estimates not reported). Standard errors are reported in parentheses.
Table 6. Cross-country panel estimation: structural change effects.
(1) Arellano-Bond
(2) Arellano-Bond
(3) Arellano-Bond
(4) Arellano-Bond
Variable Investment
Specializationi,k,t
Investment Specializationi,k,t
Investment Specializationi,k,t
Investment Specializationi,k,t
Patent
Specializationi,k,t
0.126 (0.020) ***
0.110 (0.021) ***
0.098 (0.022) ***
0.110 (0.023) ***
Tripst x Patent Specializationj,k,t
0.010 (0.005) *
0.011 (0.005) *
0.010 (0.006)
0.012 (0.006) *
Constant 0.067 (0.005) ***
0.058 (0.005) ***
0.064 (0.006) ***
0.069 (0.006) ***
Statistical details
Patent
Specializationi,k,t
endogenous
Instruments for differenced eq.
Investment Specializationi,k,(t) (various lags) Production Specializationi,k,t
Trade Specializationi,k,t No. of lags for
Investment Specializationi,k,(t)
1 2 3 4
Waldχ2
( prob > χ2) 571.45 (0.000) 619.03 (0.000) 562.76 (0.000) 517.01 (0.000) Number of
observations 1241 1154 1072 989
Note: significance level (“*” = 10%, “**” = 5%, “***” = 1%). Standard errors are reported in parentheses.
Again, as shown at the bottom of Table 5 and Table 6, the diagnostic analysis induces us never to reject the statistical validity of our estimation results.10
10 Admittedly, the robustness of our empirical results concerning the effects of the TRIPs could be tested
6. Conclusion.
In this paper we have showed that a tight worldwide system of IPRs forces countries to specialize in those sectors where from the outset they have possessed some proprietary monopoly knowledge, enabling them to acquire the ownership of additional knowledge and new investment opportunities. Countries poor in IPRs, hence, may be unable to compete effectively in product markets unless they are characterized by low labor costs in the diminishing fields left free by the intellectual monopoly of other countries. This is shown by the fact that, while in the 1990s China and America boomed (the former thanks to low wages, the latter thanks to a large endowment of IPRs), other capitalist economies stagnated, either because they were relatively poor in intellectual monopoly assets or because they had relatively high labor costs, or for both these reasons (this being the case of Italy, among others). In this context, an additional determinant of international trade emerges, i.e. trade arises also from the fact that other countries’ patents force a country to restrict its production in a limited production field and must import the goods which are not included in that field. This may be associated with “unequal gains from trade” in the sense that one pattern of specialization may yield higher monopoly profits associated with intellectual property.
At the same time, however, also in countries rich in IPRs, firms have a growing sense of insecurity due to the fear that their development of new technology may be blocked by other firms (this is a consequence of the anti-commons tragedy (Heller and Heisenberg, 1998)). Patent pools and pre-emptive patenting (Gueller et al., 2009) have created a situation in which only some large interconnected firms are able to limit the damage caused by intellectual monopoly and, in particular, by patent trolls11. Recently, 11 firms, including Sun
Microsystems, Motorola, Hewlet-Packard, Verizon Communications, Cisco Systems, Google and Ericsson, have become members of AST (Allied Security Trust), a joint trust which is a patent holding company that helps protect members against patent infringement lawsuits. Allied Security Trust (2010) claims that:
AST operates under a “catch and release” model that is unique among defensive patent organizations. AST members purchase patents for defensive purposes, secure the necessary licenses to ensure freedom of operation, and then return the patents to the marketplace for sale. These sale proceeds help to reimburse AST members for their investment in acquiring a license. Under the rules of Trust, AST or its affiliated companies seek to sell all acquired patents within one year of the date of acquisition.
If companies of the size of those that have joined AST consider it useful to join forces to avoid specialization restrictions and “to ensure freedom of
11 The term is used to indicate a person or company that enforces patents against alleged infringers in a
operation”, it is not hard to imagine the difficulties encountered by small companies, especially when they belong to the periphery of the industrial world.
Thus, strong IPRs not only concentrate investment opportunities in the hands of a few, but also may decrease overall investment possibilities, and may be therefore one of the factors contributing to the current recession (Pagano and Rossi, 2009). Although this thesis is not tested in the present paper, we believe that a relationship between stronger IPRs international protection and the fall of global investments could be detected in the data. Descriptive evidence seems to be corroborating. Figure 2, in particular, shows that total world investments increased for about five years after the TRIPs, while they have been continuously declining since 1999.
Figure 2. Global patents and global investments.
Source: authors’ calculations on data from the European Patent Office (EPO, 2008) and OECD (2009). Global investments are expressed as a percentage of global production (gross output) and refer to the 1970-2008 period; global patents are the total world’s patents outstanding and refer to the 1978-2006 period.


![Table 2. Cross-country panel estimation (1978-2006 period): results. (1) 3SLS [Baseline model] (2) 3SLS [Partially augmented model – version a] (3) 3SLS [Partially augmented model – version b] (4) 3SLS [Fully augmented model] Variable](https://thumb-eu.123doks.com/thumbv2/123dok_br/16291109.185373/20.892.139.774.175.999/estimation-baseline-partially-augmented-partially-augmented-augmented-variable.webp)

![Table 4. Robustness checks to different estimation method and lag-structure. (1) 2SLS [Baseline model] (2) 3SLS [Fully augmented model – version c] (3) 3SLS [Fully augmented model – version d] Variable Investment Specialization i,k,t Investme](https://thumb-eu.123doks.com/thumbv2/123dok_br/16291109.185373/25.892.138.772.168.926/robustness-different-estimation-augmented-variable-investment-specialization-investme.webp)