JHEP02(2014)088
Published for SISSA by SpringerReceived: December 6, 2013
Accepted: January 26, 2014
Published: February 20, 2014
Studies of azimuthal dihadron correlations in
ultra-central PbPb collisions at
√
s
N N
= 2
.
76
TeV
The CMS collaboration
E-mail: [email protected]
Abstract: Azimuthal dihadron correlations of charged particles have been measured in
PbPb collisions at√sN N = 2.76 TeV by the CMS collaboration, using data from the 2011 LHC heavy-ion run. The data set includes a sample of ultra-central (0–0.2% centrality) PbPb events collected using a trigger based on total transverse energy in the hadron for-ward calorimeters and the total multiplicity of pixel clusters in the silicon pixel tracker. A total of about 1.8 million ultra-central events were recorded, corresponding to an in-tegrated luminosity of 120µb−1. The observed correlations in ultra-central PbPb events
are expected to be particularly sensitive to initial-state fluctuations. The single-particle anisotropy Fourier harmonics, from v2 tov6, are extracted as a function of particle
trans-verse momentum. At higher transtrans-verse momentum, thev2 harmonic becomes significantly
smaller than the higher-ordervn(n≥3). ThepT-averagedv2 andv3are found to be equal
within 2%, while higher-ordervn decrease as nincreases. The breakdown of factorization
of dihadron correlations into single-particle azimuthal anisotropies is observed. This effect is found to be most prominent in the ultra-central PbPb collisions, where the initial-state fluctuations play a dominant role. A comparison of the factorization data to hydrodynamic predictions with event-by-event fluctuating initial conditions is also presented.
Keywords: Relativistic heavy ion physics, Heavy Ions, harmonic flow
JHEP02(2014)088
Contents1 Introduction 1
2 Experimental setup 3
3 Selections of events and tracks 3
4 Analysis procedure 6
5 Results 8
5.1 Single-particle azimuthal anisotropy, vn 8
5.2 Correlation functions 11
5.3 Factorization breakdown andpT dependence of event plane angle 12
6 Conclusion 13
The CMS collaboration 20
1 Introduction
The azimuthal anisotropy of emitted charged particles is an important feature of the hot, dense medium produced in heavy-ion collisions. One of the main goals of studying the azimuthal anisotropies is to understand the collective properties of the medium and extract its transport coefficients, particularly the shear viscosity over entropy density ratio, η/s, using hydrodynamic models [1]. Earlier observations of strong azimuthal anisotropies in collisions of gold nuclei at nucleon-nucleon center-of-mass energies (√sN N) up to 200 GeV at the Relativistic Heavy-Ion Collider (RHIC) indicated that a strongly coupled quark-gluon plasma is produced, which behaves as a nearly perfect liquid with a close-to-zero η/s value [2–7]. The azimuthal anisotropies have also been extensively measured at the Large Hadron Collider (LHC) over a wide kinematic range in PbPb collisions at√sN N = 2.76 TeV [8–17].
JHEP02(2014)088
along the short axis of the lenticular region. Therefore, the eccentricity of initial-state colli-sion geometry results in an anisotropic azimuthal distribution of the final-state hadrons. In general, the anisotropy can be characterized by the Fourier harmonic coefficient (vn) in the
azimuthal angle (φ) distribution of the hadron yield, dN/dφ∝1 + 2P
nvncos[n(φ−Ψn)],
where Ψn is the event-by-event azimuthal angle of the participant plane. As the
par-ticipant plane is not a measurable quantity experimentally, it is often approximated by the “event plane”, defined as the direction of maximum final-state particle density. The second-order Fourier component (v2) is known as the “elliptic flow”, and its event plane
angle Ψ2 approximately corresponds to the short axis direction of the lenticular region.
Due to event-by-event fluctuations, higher-order deformations or eccentricities of the ini-tial geometry can also be induced, which lead to higher-order Fourier harmonics (vn,n≥3)
in the final state with respect to their corresponding event plane angles, Ψn [18–24]. For
a given initial-state eccentricity, the finiteη/svalue of the system tends to reduce the az-imuthal anisotropy observed for final-state particles. The higher-order Fourier harmonics are expected to be particularly sensitive to the shear viscosity of the expanding medium.
Precise extraction ofη/sfrom the anisotropy data is crucial for investigating the trans-port properties of the hot and dense medium created in heavy-ion collisions in detail [1]. This effort is, however, complicated by large uncertainties in our understanding of the initial-state conditions of heavy-ion collisions, especially in terms of event-by-event tuations. Different initial-state models predict different values of eccentricity and its fluc-tuations, leading to large uncertainties on the extracted η/s values. In order to better constrain the initial-state condition, it was suggested [25] that in ultra-central heavy-ion collisions (e.g., top 1% most central collisions), the initial collision geometry is predom-inantly generated by fluctuations such that various orders of eccentricities predicted by different models tend to converge. Here, collision centrality is defined as the fraction of the total inelastic PbPb cross section, with 0% denoting the most central collisions. Therefore, studies of azimuthal anisotropy in ultra-central heavy-ion collisions can help to reduce the systematic uncertainties of initial-state modeling in extracting the η/s value of the sys-tem, although quantitative comparison to theoretical calculations is beyond the scope of this paper.
Furthermore, since the event plane angle, Ψn, is determined by the final-state particles,
selecting particles from different ranges of transverse momentum (pT) may lead to different
estimates of event plane angles. Also due to the effect of initial-state fluctuations, it was recently predicted by hydrodynamic models that a pT-dependence of the event plane
angle will be induced, which could be one of the sources responsible for the breakdown of factorization in extractingvnharmonics from dihadron correlations [26,27]. As mentioned
already, the ultra-central heavy-ion events are dominated by the initial-state eccentricity fluctuations. Thus, they provide an ideal testing ground for the effect of a pT-dependent
event plane angle.
This paper presents the measurement of azimuthal anisotropy harmonics, from v2
to v6, extracted using long-range (large |∆η|) dihadron correlations as a function of pT
JHEP02(2014)088
=−ln[tan(θ/2)] between the two particles, where the polar angleθis defined relative to the beam axis. ThepT-averagedvnvalues for 0.3< pT <3.0 GeV/care also derived up ton= 7.
Factorization of the Fourier coefficients from dihadron correlations into a product of single-particle azimuthal anisotropies is investigated. This study of factorization is quantitatively compared to hydrodynamic predictions with different models of initial-state fluctuations and η/svalues for two centrality classes.
2 Experimental setup
The data used in this analysis correspond to an integrated luminosity of 120µb−1 and were recorded with the CMS detector during the 2011 PbPb LHC running period at √sN N = 2.76 TeV. A detailed description of the CMS detector can be found in ref. [28]. The CMS uses a right-handed coordinate system, with the origin at the nominal interaction point, thex axis pointing to the centre of the LHC, they axis pointing up (perpendicular to the LHC plane), and the z axis along the anticlockwise-beam direction. The polar angle θ is measured from the positivezaxis and the azimuthal angle (φ) is measured in thex-yplane. The central feature of the apparatus is a superconducting solenoid of 6 m internal diameter, providing a magnetic field of 3.8 T. Within the field volume are the silicon pixel and strip trackers, the crystal electromagnetic calorimeter, and the brass/scintillator hadron calorimeter. In PbPb collisions, trajectories of charged particles with pT >0.2 GeV/c are
reconstructed in the tracker covering the pseudorapidity region |η| < 2.5, with a track momentum resolution of about 1% at pT = 100 GeV/c. In addition, CMS has extensive
forward calorimetry, in particular two steel/quartz-fiber Cherenkov hadron forward (HF) calorimeters, which cover the pseudorapidity range 2.9<|η|<5.2. The HF calorimeters are segmented into towers, each of which is a two-dimensional cell with a granularity of 0.5 units in η and 0.349 rad in φ. The zero-degree calorimeters (ZDC) are tungsten/quartz Cherenkov calorimeters located at ±140 mm from the interaction point [29]. They are designed to measure the energy of photons and spectator neutrons emitted from heavy ion collisions. Each ZDC calorimeter has electromagnetic and hadronic sections with an active area of ±40 mm in x and ±50 mm in y. When the LHC beam crossing angle is 0 degree, this corresponds to an η acceptance that starts at η = 8.3 and is 100% by η = 8.9 for
√s
N N = 2.76 TeV. For one neutron, the ZDCs have an energy resolution of 20%. Since
each neutron interacts independently, the resolution improves as the square root of the number of neutrons.
3 Selections of events and tracks
JHEP02(2014)088
Pixel Cluster Multiplicity
0 20000 40000 60000 80000
Sum (GeV)T
HF E
0 2000 4000
1 10
2
10
3
10
4
10 = 2.76 TeV
NN
s
CMS PbPb 0-0.2%
centrality
Figure 1. HFETsum vs. pixel cluster multiplicity for minimum bias triggered PbPb collisions at √s
N N = 2.76 TeV. The region in the upper right corner encompassed by the dashed lines depicts
the 0–0.2% selected centrality range.
To maximize the event sample for very central PbPb collisions, a dedicated online trigger on the 0–0.2% ultra-central events was implemented by simultaneously requiring the HF transverse energy (ET) sum to be greater than 3260 GeV and the pixel cluster
multiplicity to be greater than 51400 (which approximately corresponds to 9500 charged particles over 5 units of pseudorapidity). The selected events correspond to the 0.2% most central collisions of the total PbPb inelastic cross section. The correlation between the HF ETsum and pixel cluster multiplicity for minimum bias PbPb collisions at√sN N = 2.76 TeV
is shown in figure1. The dashed lines indicate the selections used for the 0–0.2% centrality range. This fractional cross section is determined relative to the standard 0–2.5% centrality selection in PbPb collisions at CMS by selecting on the total energy deposited in the HF calorimeters [8]. The inefficiencies of the minimum bias trigger and event selection for very peripheral events are properly accounted. In a similar way, the 0–0.02% centrality range is also determined by requiring the HF ET sum greater than 3393 GeV and pixel cluster
multiplicity greater than 53450 (a subset of 0–0.2% ultra-central events). With this trigger, the ultra-central PbPb event sample is enhanced by a factor of about 40 compared to the minimum bias sample. For purposes of systematic comparisons, other PbPb centrality ranges, corresponding to 40–50%, 0–10%, 2.5–5.0%, 0–2.5% and 0–1%, are studied based on the HF ET sum selection using the minimum bias sample. As a cross-check, the 0–1%
centrality range is also studied using combined HFET sum and pixel cluster multiplicity,
similar to the centrality selection of 0–0.2% ultra-central events.
JHEP02(2014)088
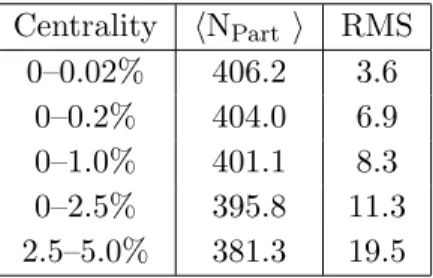
Centrality hNPart i RMS
0–0.02% 406.2 3.6 0–0.2% 404.0 6.9 0–1.0% 401.1 8.3 0–2.5% 395.8 11.3 2.5–5.0% 381.3 19.5
Table 1. The mean and RMS of NPart distributions for selected events in each centrality bin in
amptsimulations.
of the initial-state fluctuations of participating nucleons. The generated particles are prop-agated through the full geant4 [31] simulation of the CMS detector. The equivalent centrality requirements on the HF ET sum and pixel cluster multiplicity are applied in
order to evaluate the selected ranges of impact parameter and number of participating nucleons, NPart, for various centrality ranges. A summary of the mean and RMS values
of NPart distributions for selected events of each very central PbPb centrality range can
be found in table 1. As one can see, there is only a moderate increase of average NPart
value for events that are more central than 0–1% centrality, although the RMS value still decreases significantly for more central selections.
Standard offline event selections [8] are also applied by requiring energy deposits in at least three towers in each of the HF calorimeters, with at least 3 GeV of energy in each tower, and the presence of a reconstructed primary vertex containing at least two tracks. The reconstructed primary vertex is required to be located within ±15 cm of the average interaction region along the beam axis and within a radius of 0.02 cm in the transverse plane. These criteria further reduce the background from single-beam interactions (e.g., beam-gas and beam-halo), cosmic muons, and ultra peripheral collisions that lead to the electromagnetic breakup of one or both Pb nuclei [32]. These criteria are most relevant for selecting very peripheral PbPb events but have little effect (< 0.01%) on the events studied in this paper.
During the 2011 PbPb run, there was a probability of about 10−3to have two collisions recorded in a single beam crossing (pileup events). This probability is even higher for ultra-central triggered events, which sample the tails of the HF ET sum and pixel cluster
multiplicity distributions. If a large HFETsum or pixel cluster multiplicity event is due to
two mid-central collisions instead of a single ultra-central collision, more spectator neutrons will be released, resulting in a large signal in the ZDC. To select cleaner single-collision PbPb events, the correlation of energy sum signals between ZDC and HF detectors is studied. Events with large signals in both ZDC and HF are identified as pileup events (about 0.1% of all events), and thus rejected.
JHEP02(2014)088
drops to about 50% forpT ∼0.3 GeV/c. The fraction of misidentified tracks is kept at the
level of <5% over most of the pT (pT >0.5 GeV/c) andη (|η|<1.6) ranges. It increases
up to about 20% for very lowpT (pT<0.5 GeV/c) particles in the forward (|η| ≈2) region.
4 Analysis procedure
Following the same procedure of dihadron correlation analysis as in refs. [9, 34–37], the signal and background distributions of particle pairs are first constructed. Any charged particle associated with the primary vertex and in the range |η| < 2.4 can be used as a “trigger” particle. A variety of bins of trigger particle transverse momentum, denoted by ptrigT , are considered. In a single event, there can be more than one trigger particle and their total multiplicity is denoted byNtrig. Within each event, every trigger particle is then
paired with all of the remaining particles (again within|η|<2.4). Just as for the trigger particles, these associated particles are also binned in transverse momentum (passocT ).
The signal distribution, S(∆η,∆φ), is the per-trigger-particle yield of pairs found in the same event,
S(∆η,∆φ) = 1 Ntrig
d2Nsame
d∆ηd∆φ, (4.1)
where Nsame is the number of such pairs within a (∆η,∆φ) bin, and ∆φand ∆η are the
differences in azimuthal angleφand pseudorapidityηbetween the two particles. The back-ground distribution, B(∆η,∆φ), is found using a mixed-event technique, wherein trigger particles from one event are combined (mixed) with all of the associated particles from a different event. In the analysis, associated particles from 10 randomly chosen events with a smallzvtx range (±0.5 cm) near thezvtx of the event with trigger particles are used. The
result is given by
B(∆η,∆φ) = 1 Ntrig
d2Nmix
d∆ηd∆φ, (4.2)
whereNmixdenotes the number of mixed-event pairs. This background distribution repre-sents the expected correlation function assuming independent particle emission, but taking into account effects of the finite acceptance.
The two-dimensional (2D) differential yield of associated particles per trigger particle is given by
1 Ntrig
d2Npair
d∆ηd∆φ =B(0,0)×
S(∆η,∆φ)
B(∆η,∆φ), (4.3)
where Npair is the total number of hadron pairs. The value of the background distri-bution at ∆η = 0 and ∆φ = 0, B(0,0), represents the mixed-event associated yield for both particles of the pair going in approximately the same direction and thus having full pair acceptance (with a bin width of 0.3 in ∆η and π/16 in ∆φ). Therefore, the ratio B(0,0)/B(∆η,∆φ) accounts for the pair-acceptance effects. The correlation function de-scribed in eq. (4.3) is calculated in 0.5 cm wide bins of thezvtx along the beam direction
and then averaged over the range |zvtx|<15 cm.
To extract the azimuthal anisotropy harmonics, vn, the one-dimensional (1D)
JHEP02(2014)088
avoid the short-range correlations from jets and resonance decays), can be decomposed into a Fourier series given by
1 Ntrig
dNpair
d∆φ =
Nassoc
2π
(
1 +
∞ X
n=1
2Vn∆cos(n∆φ) )
. (4.4)
Here,Vn∆are the Fourier coefficients from dihadron correlations, andNassocrepresents the
total number of hadron pairs per trigger particle for a given|∆η|range and (ptrigT , passoc T ) bin.
In refs. [9, 35–37], a fit to the azimuthal correlation function by a Fourier series was used to extract theVn∆coefficients. In this paper, a slightly different approach is applied.
TheVn∆values are directly calculated as the average value of cos(n∆φ) of all particle pairs
for|∆η|>2 (to avoid the short-range correlations from jets and resonance decays):
Vn∆=hhcos(n∆φ)iiS− hhcos(n∆φ)iiB. (4.5)
Here, hh ii denotes averaging over all particles in each event and over all the events. The subscripts S and B correspond to the average over signal and background pairs. With an ideal detector, hhcos(n∆φ)iiS equals to Vn∆ by definition. The hhcos(n∆φ)iiB term is
subtracted in order to remove the effects of detector non-uniformity. The advantage of the present approach is that the extracted Fourier harmonics will not be affected by the finite bin widths of the histogram in ∆η and ∆φ. This is particularly important for very-high-order harmonics (Vn∆ is extracted up to n = 7 in this analysis) that are sensitive to the
finer variations of the correlation functions.
It was thought [9, 14, 16] that, for correlations purely driven by the hydrodynamic flow, Vn∆ can be factorized into a product of single-particle Fourier harmonics, vn(ptrigT ),
for trigger particles andvn(passocT ), for associated particles:
Vn∆=vn(ptrigT )×vn(passocT ). (4.6)
The single-particle azimuthal anisotropy harmonics can then be extracted as a function of pT as follows:
vn(pT) =
Vn∆(pT, prefT ) q
Vn∆(prefT , prefT )
, (4.7)
where a fixedpref
T range is chosen for the “reference particles”. However, as pointed out in
refs. [26, 27], due to fluctuating initial-state geometry, the factorization ofVn∆ could also
break down for flow-only correlations. Direct tests of the factorization relation for Vn∆
in eq. (4.6) are carried out in this paper, as will be discussed in section 5.3. These tests may provide new insights into the initial-state density fluctuations of the expanding hot medium.
When calculating hhcos(n∆φ)ii, each pair is weighted by the product of correction factors for the two particles. These factors are the inverse of an efficiency that is a function of each particle’s pseudorapidity and transverse momentum,
εtrk(η, pT) =
A(η, pT)E(η, pT)
1−F(η, pT)
JHEP02(2014)088
n f
2 1.3±0.1 3 1.0±0.4 4 0.8±0.6 5 0.8±0.6 >6 0.8±0.6
Table 2. The factor, f, for estimating the vn values of misidentified tracks, as well as its uncertainty, for various orders of Fourier harmonics.
whereA(η, pT) is the geometrical acceptance,E(η, pT) is the reconstruction efficiency, and
F(η, pT) is the fraction of misidentified tracks. The effect of this weighting factor only
changes the overall scale of dihadron correlation functions, and has almost no effect on
hhcos(n∆φ)ii. However, the misidentified tracks may have different vn values from those of
correctly reconstructed tracks. Therefore, the effects of misidentified tracks are investigated and corrected using the same procedure as done in ref. [8]. The vn values for the true
charged tracks (vtrue
n ) can be expressed as a combination ofvn for all the observed tracks
(vobs
n ) and for misidentified tracks (vnmis):
vntrue(pT) =
vobsn (pT)−F(pT)×vmisn (pT)
1−F(pT)
. (4.9)
An empirical correction for the misidentified track vn based on the simulation studies is
found to be independent of track selections or the fraction of misidentified tracks. The correction is given by vmis
n = f × hvni, where hvni is the yield-weighted average over the pT range from 0.3 to 3.0 GeV/c, folding in the efficiency-corrected spectra. The estimated
values of the correction factor, f, as well as its uncertainty, are summarized in table 2for different vn.
The systematic uncertainties due to misidentified tracks, which are most important at low pT where the misidentified track rate is high, are reflected in the uncertainty of the
f factor in table2. At lowpT, the systematic uncertainty from this source is 1.4% for v2
and 5–8% for v3 tov6. By varying the z-coordinate of vertex binning in the mixed-event
background, the results of the vn values vary by at most 2–8% for v2 to v6, respectively.
Systematic uncertainties due to the tracking efficiency correction are estimated to be about 0.5%. By varying the requirements on the ZDC sum energy used for pileup rejection, the results are stable within less than 1%. The various sources of systematic uncertainties are added in quadrature to obtain the final uncertainties shown as the shaded color bands for results in section 5.
5 Results
5.1 Single-particle azimuthal anisotropy, vn
Results of azimuthal anisotropy harmonics, from v2 to v6, as a function of pT in 0–0.2%
JHEP02(2014)088
(GeV/c) T p
0 2 4 6
| > 2}
η
∆
{2part, |n
v
0.00 0.05
n = 2 n = 3 n = 4 n = 5 n = 6
= 2.76 TeV
NN s CMS PbPb -1 b µ = 120 int L 0-0.2% centrality < 3 GeV/c
ref T
1 < p
(GeV/c) T p
0 2 4 6
1/2 2 /v n 1/n v 1 2 3 4
n = 3 n = 4 n = 5 n = 6
= 2.76 TeV
NN s CMS PbPb -1 b µ = 120 int L 0-0.2% centrality < 3 GeV/c
ref T
1 < p
Figure 2. Left: the v2 to v6 values as a function of pT in 0–0.2% central PbPb collisions at √s
N N = 2.76 TeV. Right: thev 1/n
n /v12/2ratios as a function ofpT. Error bars denote the statistical uncertainties, while the shaded color bands correspond to the systematic uncertainties.
are extracted from long-range (|∆η| > 2) dihadron correlations using eq. (4.5), and by assuming factorization in eq. (4.7). The pref
T range is chosen to be 1–3 GeV/c. The error
bars correspond to statistical uncertainties, while the shaded color bands indicate the systematic uncertainties. As the collisions are extremely central, the eccentricities, ǫn, are
mostly driven by event-by-event participant fluctuations and are of similar sizes within a few % for all orders. Consequently, the magnitudes of v2 and v3 are observed to be
comparable (within 2% averaged over pT as will be shown in figure 4), which is not the
case for non-central collisions. Differentvn harmonics have very different dependencies on pT. At low pT (pT <1 GeV/c), the v2 harmonic has the biggest magnitude compared to
other higher-order harmonics. It becomes smaller thanv3atpT ≈1 GeV/c, and even smaller
thanv5forpT>3 GeV/c. This intriguingpTdependence can be compared quantitatively to
hydrodynamics calculations with fluctuating initial conditions, and it provides important constraints on theoretical models. For a given value of pT, the magnitude of vn forn≥3
decreases monotonically withn, as will be shown later.
If a system created in an ultra-relativistic heavy-ion collision behaves according to ideal hydrodynamics, the Fourier harmonics, vn, are expected to follow a pT dependence that
has a power-law,pnT, functional form in the low-pTregion [38,39]. Hence, the scaling ratio,
vn1/n/v12/2, will be largely independent ofpT, as was seen by the ATLAS collaboration for not
very central events [16]. In figure2(right), the vn1/n/v21/2 ratios are shown as a function of
pT forn= 3–6 obtained in 0–0.2% ultra-central PbPb collisions at√sN N = 2.76 TeV. The
obtained ratio shows an increase as a function ofpT. This trend is consistent to what was
observed by the ATLAS collaboration for very central events (e.g., 0–1% centrality) [16].
Other choices of pref
T ranges are also studied in order to examine the assumption of
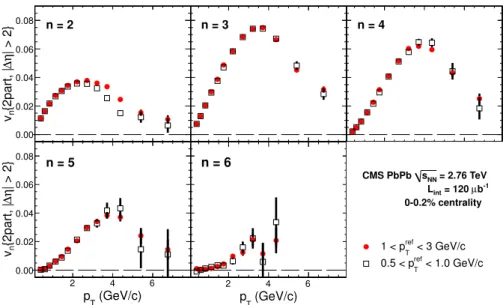
factorization made for extracting vn. As an example, figure 3 shows the comparison of vn as a function of pT for 1 < prefT < 3 GeV/c and 0.5 < prefT < 1.0 GeV/c. The vn values
extracted with two choices of pref
T ranges are consistent within statistical uncertainties for
JHEP02(2014)088
2 4 6
| > 2}
η
∆
{2part, |n
v
0.00 0.02 0.04 0.06 0.08 n = 2
(GeV/c) T p
2 4 6
| > 2}
η
∆
{2part, |n
v 0.00 0.02 0.04 0.06 0.08
n = 5
2 4 6
0.00 0.02 0.04 0.06 0.08 n = 3
(GeV/c) T p
2 4 6
0.00 0.02 0.04 0.06 0.08
n = 6
2 4 6
0.00 0.02 0.04 0.06 0.08 n = 4
< 3 GeV/c
ref T
1 < p
< 1.0 GeV/c
ref T
0.5 < p
= 2.76 TeV
NN s CMS PbPb -1 b µ = 120 int L 0-0.2% centrality
Figure 3. Comparison of vn(pT) values derived from two different prefT ranges: 0.5–1.0 GeV/c (open square markers) and 1–3 GeV/c(solid circles), in 0–0.2% central PbPb collisions at √sN N = 2.76 TeV. Error bars denote the statistical uncertainties.
n
2 3 4 5 6 7
| > 2}
η
∆
{2part, |n
v 0.00 0.01 0.02 0.03 0.04
= 2.76 TeV
NN s CMS PbPb -1 b µ = 120 int L
< 3.0 GeV/c
T
0.3 < p
2.5-5.0%, HF 0-2.5%, HF 0-1%, HF+NPixel 0-0.2%, HF+NPixel 0-0.02%, HF+NPixel
Figure 4. Comparison ofpT-averaged (0.3–3.0 GeV/c)vnas a function ofnin five centrality ranges (2.5–5.0%, 0–2.5%, 0–1%, 0–0.2% and 0–0.02%) for PbPb collisions at√sN N = 2.76 TeV. Thepref T of 1–3 GeV/c is used. Error bars denote the statistical uncertainties, while the shaded color boxes correspond to the systematic uncertainties.
higherpT, e.g., up to about 40% for pT ∼4 GeV/c, while the low pT region shows a good
agreement between the two pref
T ranges. A detailed study of factorization breakdown for
eq. (4.6) as well as its physical implication is presented in section5.3, which is in agreement with the discrepancy observed in figure3.
ThepT-averagedvnvalues (withprefT of 1–3 GeV/c) weighted by the efficiency-corrected
JHEP02(2014)088
η ∆ -4 -2 0 2 4 (radians) φ ∆ 0 2 4 φ ∆ d η ∆ d pair N 2 d trig N 1 51.0 51.5= 2.76 TeV
NN s CMS PbPb -1 b µ = 120 int L 0-0.2% centrality
< 3 GeV/c
trig T
1 < p
< 3 GeV/c
assoc T
1 < p ∆φ (radians)
0 2 4
φ ∆ d pair dN trig N 1 51.0 51.5 52.0 Sum ∆ 1 V ∆ 2 V ∆ 3 V ∆ 4 V ∆ 5 V ∆ 6 V
| > 2
η ∆
|
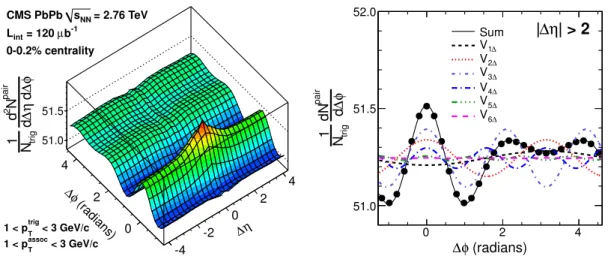
Figure 5. The 2D (left) and 1D ∆φ(right) dihadron correlation functions for 1< ptrigT <3 GeV/c and 1< passoc
T <3 GeV/c in 0–0.2% central PbPb collisions at√sN N = 2.76 TeV. The broken lines
on the right panel show various orders ofVn∆ components expected from the extractedvn values in section5.1, while the solid line is the sum of all Vn∆components.
function ofnup to n= 7 (thev7 value as a function of pT is not presented in figure2due
to limited statistical precision). The 0–0.2% ultra-central events are compared to several other very central PbPb centrality ranges including 2.5–5.0%, 0–2.5%, 0–1% and 0–0.02%. As mentioned earlier, results for 0–1% centrality are compared with both the HFET sum
selection (not shown) and HF ET sum plus pixel cluster multiplicity (NPixel) selection
as a systematic check. The two methods of centrality selection yield consistent vn results
within statistical uncertainties. Therefore, only results from HFET sum plus pixel cluster
multiplicity centrality selection are shown in figure 4. Beyond the 2.5–5.0% centrality range, the vn values are still decreasing toward more central collisions, especially for v2.
Going from 0–0.2% to 0–0.02% centrality, vn shows almost no change, indicating events
do not become significantly more central by requiring larger HF ET sum and pixel cluster
multiplicity, especially in terms of eccentricities. This is consistent with the studies using the amptmodel. The vn values remain finite up ton= 6 within the statistical precision of our data. Beyond n= 6, vnbecomes consistent with zero. The magnitude of v2 and v3
are very similar, while thevn become progressively smaller forn≥4. This is qualitatively
in agreement with expectations from hydrodynamic calculations [38].
5.2 Correlation functions
Dihadron correlation functions are also constructed using eq. (4.3) in order to check the consistency of extractingVn∆using eq. (4.5) with the fit method to the correlation function
by a Fourier series in eq. (4.4). Figure5(left) shows the dihadron correlation functions for 1< ptrigT <3 GeV/cand 1< passoc
T <3 GeV/cin 0–0.2% central PbPb collisions at√sN N =
2.76 TeV. As shown in figure2, thev3,v4, andv5values become comparable or even bigger
than v2 at 1 < pT < 3 GeV/c. In figure 5, this can be seen in the dihadron correlation
JHEP02(2014)088
structure extending over the entire ∆η region is present. The observed features of the correlation function are similar to what was seen previously at CMS in other centrality ranges of PbPb collisions [9, 35], although the dip on the away side is not seen in non-central PbPb collisions. This may indicate that the contribution of higher-order Fourier components (e.g.,v3) is more relevant for very central events.
Averaging over ∆η, the 1D ∆φ dihadron correlation function, for 1< ptrigT <3 GeV/c and 1< passoc
T <3 GeV/c in 0–0.2% central PbPb collisions at√sN N = 2.76 TeV, is shown
in figure5 (right). The range of |∆η|<2 is excluded from the average to avoid non-flow effects from other source of correlations, such as jet fragmentation. The dashed curves represent different Vn∆ components and are constructed from the vn values extracted in
section 5.1 by assuming factorization. The solid curve is the sum of all Vn∆ components,
which is in good agreement with the measured dihadron correlation function.
5.3 Factorization breakdown and pT dependence of event plane angle
The breakdown of factorization observed in figure 3 could be caused by non-flow effects that contribute to the dihadron correlation function at large ∆η, e.g., back-to-back jet correlations. However, in hydrodynamics, it has been recently suggested that one possible source of factorization breakdown is related to the initial-state eccentricity fluctuations [26, 27]. The event plane angle, Ψn, as determined by final-state particles, could be dependent
on the particlepTevent-by-event, instead of a unique angle for the entire event (which is the
case for a non-fluctuating smooth initial condition). Because of this effect, the factorization ofVn∆ extracted from dihadron correlations could be broken, even if hydrodynamic flow is
the only source of correlations. The breakdown effect can be explored more quantitatively in the following analysis.
A ratio for testing factorization defined as
rn≡
Vn∆(ptrigT , passocT )
q
Vn∆(ptrigT , ptrigT )Vn∆(passocT , passocT )
(5.1)
has been proposed as a direct measurement of pT-dependent event plane angle
fluctua-tions [27]. Here, the Vn∆coefficients are calculated by pairing particles within the samepT
interval (denominator) or from different pT intervals (numerator). If Vn∆ factorizes, this
ratio will be equal to unity. With the presence of apT-dependent event plane angle, it has
been shown that the ratio, rn, is equivalent to
rn= h
vn(ptrigT )vn(passocT ) cos
n Ψn(ptrigT )−Ψn(passocT )
i
q
hv2
n(ptrigT )ihvn2(passocT )i
, (5.2)
where Ψn(ptrigT ) and Ψn(passocT ) represent the event plane angles determined for trigger and
associated particles from twopT intervals [26,27]. One can see from eq. (5.2) thatrn is in
general less than unity if event plane angle Ψn depends onpT.
In this paper, the proposed factorization ratio, rn, is studied as a function of ptrigT and
passoc
JHEP02(2014)088
show thern values forn= 2–4, respectively, for four ptrigT bins (of increasing pT from left
to right panels) as a function of the difference betweenptrigT and passoc
T . The average values
of ptrigT and passoc
T in each bin are used for calculating the difference. The measurement is
performed in four different centrality classes, i.e., 40–50%, 0–10%, 0–5%, and ultra-central 0–0.2% centralities (from bottom to top panels). By construction, the rn value for the
highest analyzedpassoc
T range, where trigger and associated particles are selected from the
same pT interval, is equal to one. Only results for ptrigT ≥passocT are presented. The error
bars correspond to statistical uncertainties, while systematic uncertainties are negligible for thern ratios, and thus are not presented in the figures.
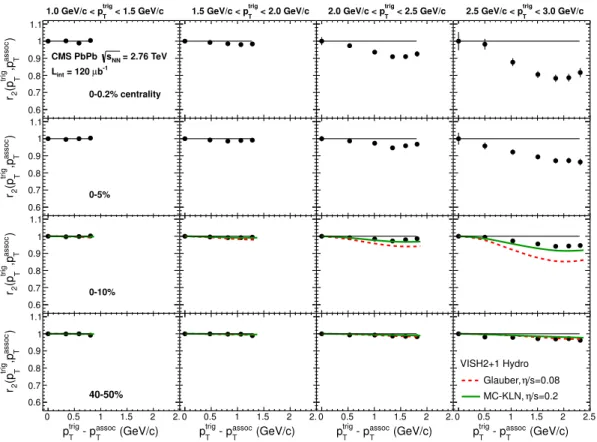
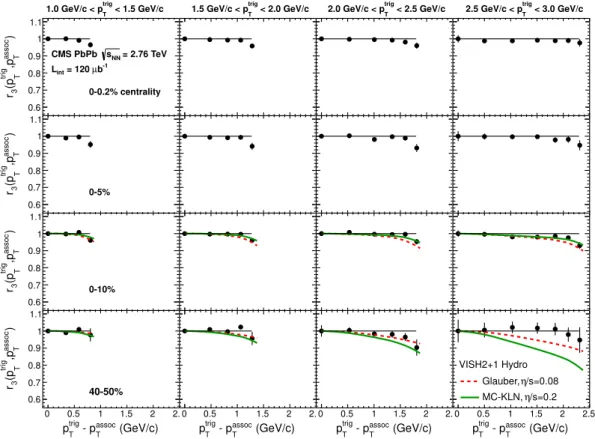
For the second Fourier harmonics (figure 6), the r2 ratio significantly deviates from
one as the collisions become more central. For any centrality, the effect gets larger with an increase of the difference between ptrigT and passocT values. To explicitly emphasize this observation,ptrigT −passoc
T , instead ofpassocT , is used as the horizontal axis of figures6–8. The
deviation reaches up to 20% for the lowest passoc
T bins in the ultra-central 0–0.2% events
for 2.5< ptrigT <3.0. This is expected as event-by-event initial-state geometry fluctuations play a more dominant role as the collisions become more central. Calculations from viscous hydrodynamics in ref. [27] are compared to data for 0–10% and 40–50% centralities with MC Glauber initial condition model [40, 41] and η/s = 0.08 (dashed lines), and MC-KLN initial condition model [42] and η/s = 0.2 (solid lines). The qualitative trend of hydrodynamic calculations is the same as what is observed in the data. The observed r2
values are found to be more consistent with the MC-KLN model and an η/svalue of 0.2. However, future theoretical studies, particularly with comparison to the precision ultra-central collisions data presented in this paper, are still needed to achieve better constraints on the initial-state models and theη/svalue of the system.
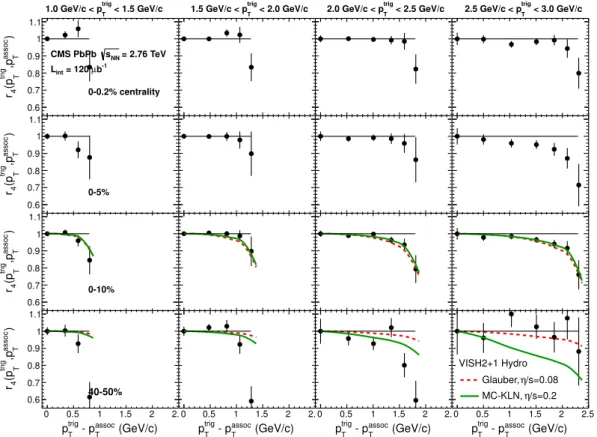
For higher-order harmonics (n = 3,4), shown in figure 7 and figure 8, the factoriza-tion is fulfilled over a wider range of ptrigT , passoc
T , and centrality ranges than for v2. The
factorization only breaks by about 5% at large values of ptrigT −passoc
T , i.e., greater than
1 GeV/c. Due to large statistical uncertainties, r5 is not included in this result. Again, the
qualitative trend of the data is described by hydrodynamics for 0–10% centrality, while no conclusion can be drawn for 40–50% centrality based on the present statistical precision of the data.
6 Conclusion
In summary, azimuthal dihadron correlations were studied for PbPb collisions at √sN N = 2.76 TeV using the CMS detector at the LHC. Assuming factorization, these two-particle correlations were used to extract the single-particle anisotropy harmonics,vn, as a function
ofpTfrom 0.3 to 8.0 GeV/c. The data set includes a sample of ultra-central (0–0.2%
JHEP02(2014)088
0 0.5 1 1.5 2 2.5
) T assoc ,p T trig (p2 r 0.6 0.7 0.8 0.9 1 1.1
< 1.5 GeV/c
T trig
1.0 GeV/c < p
= 2.76 TeV
NN s CMS PbPb -1 b µ = 120 int L 0-0.2% centrality
0 0.5 1 1.5 2 2.5
) T assoc ,p T trig (p2 r 0.6 0.7 0.8 0.9 1 1.1 0-5%
0 0.5 1 1.5 2 2.5
) T assoc ,p T trig (p2 r 0.6 0.7 0.8 0.9 1 1.1 0-10% (GeV/c) T assoc - p T trig p
0 0.5 1 1.5 2 2.5
) T assoc ,p T trig (p2 r 0.6 0.7 0.8 0.9 1 1.1 40-50%
0 0.5 1 1.5 2 2.5
0.6 0.7 0.8 0.9 1 1.1
< 2.0 GeV/c
T trig
1.5 GeV/c < p
0 0.5 1 1.5 2 2.5
0.6 0.7 0.8 0.9 1 1.1
0 0.5 1 1.5 2 2.5
0.6 0.7 0.8 0.9 1 1.1 (GeV/c) T assoc - p T trig p
0 0.5 1 1.5 2 2.5
0.6 0.7 0.8 0.9 1 1.1
0 0.5 1 1.5 2 2.5
0.6 0.7 0.8 0.9 1 1.1
< 2.5 GeV/c
T trig
2.0 GeV/c < p
0 0.5 1 1.5 2 2.5
0.6 0.7 0.8 0.9 1 1.1
0 0.5 1 1.5 2 2.5
0.6 0.7 0.8 0.9 1 1.1 (GeV/c) T assoc - p T trig p
0 0.5 1 1.5 2 2.5
0.6 0.7 0.8 0.9 1 1.1
0 0.5 1 1.5 2 2.5
0.6 0.7 0.8 0.9 1 1.1
< 3.0 GeV/c
T trig
2.5 GeV/c < p
0 0.5 1 1.5 2 2.5
0.6 0.7 0.8 0.9 1 1.1
0 0.5 1 1.5 2 2.5
0.6 0.7 0.8 0.9 1 1.1 (GeV/c) T assoc - p T trig p
0 0.5 1 1.5 2 2.5
0.6 0.7 0.8 0.9 1 1.1 VISH2+1 Hydro /s=0.08 η Glauber, /s=0.2 η MC-KLN,
Figure 6. Factorization ratio, r2, as a function of ptrigT -passocT in bins of p trig
T for four centrality ranges of PbPb collisions at √sN N = 2.76 TeV. The lines show the calculations from viscous hydrodynamics in ref. [27] for 0–10% and 40–50% centralities with MC Glauber initial condition model and η/s = 0.08 (dashed lines), and MC-KLN initial condition model and η/s = 0.2 (solid lines). Each row represents a different centrality range, while each column corresponds to a different ptrigT range. The error bars correspond to statistical uncertainties, while systematic uncertainties are negligible for thern ratios, and thus are not presented.
display a common maximum around pT = 3.5 GeV/c. Although the v2 harmonic exceeds
the others at low pT, it falls below v3 around pT = 1 GeV/c and reaches its maximum
around pT= 2.5 GeV/c.
ThepT-averagedvnfor 0.3< pT<3.0 GeV/cwere also derived up ton= 7, and results
for 0–0.2% collisions were compared to those for other slightly less central ranges. Between the 2.5–5.0% and 0–0.2% centrality ranges, all vn harmonics decrease. The decrease is
largest for v2, reaching up to 45%. Only small variations of vn are observed for events
that are even more central than 0–0.2% (e.g., 0–0.02%). For the most central collisions, the pT-averaged v2 and v3 are found to be comparable within 2%, while higher-order vn
decrease as nincreases.
Detailed studies indicate that factorization of dihadron correlations into single-particle azimuthal anisotropies does not hold precisely. The observed breakdown of factorization increases up to about 20% as thepT difference between the two particles becomes larger in
JHEP02(2014)088
0 0.5 1 1.5 2 2.5
) T assoc ,p T trig (p3 r 0.6 0.7 0.8 0.9 1 1.1
< 1.5 GeV/c
T trig
1.0 GeV/c < p
= 2.76 TeV
NN s CMS PbPb -1 b µ = 120 int L 0-0.2% centrality
0 0.5 1 1.5 2 2.5
) T assoc ,p T trig (p3 r 0.6 0.7 0.8 0.9 1 1.1 0-5%
0 0.5 1 1.5 2 2.5
) T assoc ,p T trig (p3 r 0.6 0.7 0.8 0.9 1 1.1 0-10% (GeV/c) T assoc - p T trig p
0 0.5 1 1.5 2 2.5
) T assoc ,p T trig (p3 r 0.6 0.7 0.8 0.9 1 1.1 40-50%
0 0.5 1 1.5 2 2.5
0.6 0.7 0.8 0.9 1 1.1
< 2.0 GeV/c
T trig
1.5 GeV/c < p
0 0.5 1 1.5 2 2.5
0.6 0.7 0.8 0.9 1 1.1
0 0.5 1 1.5 2 2.5
0.6 0.7 0.8 0.9 1 1.1 (GeV/c) T assoc - p T trig p
0 0.5 1 1.5 2 2.5
0.6 0.7 0.8 0.9 1 1.1
0 0.5 1 1.5 2 2.5
0.6 0.7 0.8 0.9 1 1.1
< 2.5 GeV/c
T trig
2.0 GeV/c < p
0 0.5 1 1.5 2 2.5
0.6 0.7 0.8 0.9 1 1.1
0 0.5 1 1.5 2 2.5
0.6 0.7 0.8 0.9 1 1.1 (GeV/c) T assoc - p T trig p
0 0.5 1 1.5 2 2.5
0.6 0.7 0.8 0.9 1 1.1
0 0.5 1 1.5 2 2.5
0.6 0.7 0.8 0.9 1 1.1
< 3.0 GeV/c
T trig
2.5 GeV/c < p
0 0.5 1 1.5 2 2.5
0.6 0.7 0.8 0.9 1 1.1
0 0.5 1 1.5 2 2.5
0.6 0.7 0.8 0.9 1 1.1 (GeV/c) T assoc - p T trig p
0 0.5 1 1.5 2 2.5
0.6 0.7 0.8 0.9 1 1.1 VISH2+1 Hydro /s=0.08 η Glauber, /s=0.2 η MC-KLN,
Figure 7. Factorization ratio, r3, as a function of ptrigT -passocT in bins of p trig
T for four centrality ranges of PbPb collisions at √sN N = 2.76 TeV. The lines show the calculations from viscous hydrodynamics in ref. [27] for 0–10% and 40–50% centralities with MC Glauber initial condition model and η/s = 0.08 (dashed lines), and MC-KLN initial condition model and η/s = 0.2 (solid lines). Each row represents a different centrality range, while each column corresponds to a different ptrigT range. The error bars correspond to statistical uncertainties, while systematic uncertainties are negligible for thern ratios, and thus are not presented.
data for the 0–10% and 40–50% centrality ranges were compared to viscous hydrodynamic calculations with different models of initial-state fluctuations and differentη/svalues. Fu-ture quantitative theoretical comparisons to the high-precision data of ultra-central PbPb collisions presented by the CMS collaboration in this paper can provide a new stringent test of hydrodynamic models, particularly for constraining the initial-state density fluctuations and theη/svalue.
Acknowledgments
JHEP02(2014)088
0 0.5 1 1.5 2 2.5
) T assoc ,p T trig (p4 r 0.6 0.7 0.8 0.9 1 1.1
< 1.5 GeV/c
T trig
1.0 GeV/c < p
= 2.76 TeV
NN s CMS PbPb -1 b µ = 120 int L 0-0.2% centrality
0 0.5 1 1.5 2 2.5
) T assoc ,p T trig (p4 r 0.6 0.7 0.8 0.9 1 1.1 0-5%
0 0.5 1 1.5 2 2.5
) T assoc ,p T trig (p4 r 0.6 0.7 0.8 0.9 1 1.1 0-10% (GeV/c) T assoc - p T trig p
0 0.5 1 1.5 2 2.5
) T assoc ,p T trig (p4 r 0.6 0.7 0.8 0.9 1 1.1 40-50%
0 0.5 1 1.5 2 2.5
0.6 0.7 0.8 0.9 1 1.1
< 2.0 GeV/c
T trig
1.5 GeV/c < p
0 0.5 1 1.5 2 2.5
0.6 0.7 0.8 0.9 1 1.1
0 0.5 1 1.5 2 2.5
0.6 0.7 0.8 0.9 1 1.1 (GeV/c) T assoc - p T trig p
0 0.5 1 1.5 2 2.5
0.6 0.7 0.8 0.9 1 1.1
0 0.5 1 1.5 2 2.5
0.6 0.7 0.8 0.9 1 1.1
< 2.5 GeV/c
T trig
2.0 GeV/c < p
0 0.5 1 1.5 2 2.5
0.6 0.7 0.8 0.9 1 1.1
0 0.5 1 1.5 2 2.5
0.6 0.7 0.8 0.9 1 1.1 (GeV/c) T assoc - p T trig p
0 0.5 1 1.5 2 2.5
0.6 0.7 0.8 0.9 1 1.1
0 0.5 1 1.5 2 2.5
0.6 0.7 0.8 0.9 1 1.1
< 3.0 GeV/c
T trig
2.5 GeV/c < p
0 0.5 1 1.5 2 2.5
0.6 0.7 0.8 0.9 1 1.1
0 0.5 1 1.5 2 2.5
0.6 0.7 0.8 0.9 1 1.1 (GeV/c) T assoc - p T trig p
0 0.5 1 1.5 2 2.5
0.6 0.7 0.8 0.9 1 1.1 VISH2+1 Hydro /s=0.08 η Glauber, /s=0.2 η MC-KLN,
Figure 8. Factorization ratio, r4, as a function of ptrigT -passocT in bins of p trig
T for four centrality ranges of PbPb collisions at √sN N = 2.76 TeV. The lines show the calculations from viscous hydrodynamics in ref. [27] for 0–10% and 40–50% centralities with MC Glauber initial condition model and η/s = 0.08 (dashed lines), and MC-KLN initial condition model and η/s = 0.2 (solid lines). Each row represents a different centrality range, while each column corresponds to a different ptrigT range. The error bars correspond to statistical uncertainties, while systematic uncertainties are negligible for thern ratios, and thus are not presented.
operation of the LHC and the CMS detector provided by the following funding agencies: BMWF and FWF (Austria); FNRS and FWO (Belgium); CNPq, CAPES, FAPERJ, and FAPESP (Brazil); MES (Bulgaria); CERN; CAS, MoST, and NSFC (China); COLCIEN-CIAS (Colombia); MSES (Croatia); RPF (Cyprus); MoER, SF0690030s09 and ERDF (Es-tonia); Academy of Finland, MEC, and HIP (Finland); CEA and CNRS/IN2P3 (France); BMBF, DFG, and HGF (Germany); GSRT (Greece); OTKA and NKTH (Hungary); DAE and DST (India); IPM (Iran); SFI (Ireland); INFN (Italy); NRF and WCU (Republic of Korea); LAS (Lithuania); CINVESTAV, CONACYT, SEP, and UASLP-FAI (Mexico); MBIE (New Zealand); PAEC (Pakistan); MSHE and NSC (Poland); FCT (Portugal); JINR (Dubna); MON, RosAtom, RAS and RFBR (Russia); MESTD (Serbia); SEIDI and CPAN (Spain); Swiss Funding Agencies (Switzerland); NSC (Taipei); ThEPCenter, IPST, STAR and NSTDA (Thailand); TUBITAK and TAEK (Turkey); NASU (Ukraine); STFC (United Kingdom); DOE and NSF (U.S.A.).
JHEP02(2014)088
A. P. Sloan Foundation; the Alexander von Humboldt Foundation; the Belgian Federal Science Policy Office; the Fonds pour la Formation `a la Recherche dans l’Industrie et dans l’Agriculture (FRIA-Belgium); the Agentschap voor Innovatie door Wetenschap en Tech-nologie (IWT-Belgium); the Ministry of Education, Youth and Sports (MEYS) of Czech Republic; the Council of Science and Industrial Research, India; the Compagnia di San Paolo (Torino); the HOMING PLUS programme of Foundation for Polish Science, co-financed by EU, Regional Development Fund; and the Thalis and Aristeia programmes cofinanced by EU-ESF and the Greek NSRF.
Open Access. This article is distributed under the terms of the Creative Commons Attribution License (CC-BY 4.0), which permits any use, distribution and reproduction in any medium, provided the original author(s) and source are credited.
References
[1] U. Heinz and R. Snellings,Collective flow and viscosity in relativistic heavy-ion collisions, Ann. Rev. Nucl. Part. Sci.63(2013) 123[arXiv:1301.2826] [INSPIRE].
[2] PHENIXcollaboration, K. Adcox et al., Formation of dense partonic matter in relativistic
nucleus-nucleus collisions at RHIC: experimental evaluation by the PHENIX collaboration, Nucl. Phys.A 757 (2005) 184[nucl-ex/0410003] [INSPIRE].
[3] STARcollaboration, J. Adams et al.,Experimental and theoretical challenges in the search
for the quark gluon plasma: the STAR collaboration’s critical assessment of the evidence from RHIC collisions,Nucl. Phys. A 757(2005) 102[nucl-ex/0501009] [INSPIRE].
[4] B. Back et al.,The PHOBOS perspective on discoveries at RHIC,Nucl. Phys. A 757(2005) 28[nucl-ex/0410022] [INSPIRE].
[5] BRAHMScollaboration, I. Arsene et al.,Quark gluon plasma and color glass condensate at
RHIC? The perspective from the BRAHMS experiment,Nucl. Phys. A 757(2005) 1
[nucl-ex/0410020] [INSPIRE].
[6] E.V. Shuryak,What RHIC experiments and theory tell us about properties of quark-gluon plasma?,Nucl. Phys. A 750(2005) 64 [hep-ph/0405066] [INSPIRE].
[7] M. Gyulassy and L. McLerran,New forms of QCD matter discovered at RHIC,Nucl. Phys.
A 750(2005) 30 [nucl-th/0405013] [INSPIRE].
[8] CMScollaboration, Measurement of the elliptic anisotropy of charged particles produced in
PbPb collisions at nucleon-nucleon center-of-mass energy= 2.76TeV,Phys. Rev.C 87
(2013) 014902[arXiv:1204.1409] [INSPIRE].
[9] CMScollaboration, Centrality dependence of dihadron correlations and azimuthal anisotropy
harmonics in PbPb collisions at√sN N = 2.76TeV,Eur. Phys. J.C 72(2012) 2012 [arXiv:1201.3158] [INSPIRE].
[10] CMScollaboration, Azimuthal anisotropy of charged particles at high transverse momenta in
PbPb collisions at√sN N = 2.76TeV,Phys. Rev. Lett.109(2012) 022301 [arXiv:1204.1850] [INSPIRE].
[11] CMScollaboration, Measurement of the azimuthal anisotropy of neutral pions in PbPb
JHEP02(2014)088
[12] ALICEcollaboration,Elliptic flow of charged particles in Pb-Pb collisions at 2.76TeV,Phys. Rev. Lett.105(2010) 252302 [arXiv:1011.3914] [INSPIRE].
[13] ALICEcollaboration,Higher harmonic anisotropic flow measurements of charged particles
in Pb-Pb collisions at√sN N = 2.76TeV,Phys. Rev. Lett.107(2011) 032301 [arXiv:1105.3865] [INSPIRE].
[14] ALICEcollaboration,Harmonic decomposition of two-particle angular correlations in Pb-Pb
collisions at√sN N = 2.76 TeV,Phys. Lett.B 708(2012) 249[arXiv:1109.2501] [INSPIRE].
[15] ATLAScollaboration,Measurement of the pseudorapidity and transverse momentum
dependence of the elliptic flow of charged particles in lead-lead collisions at√sN N = 2.76
TeV with the ATLAS detector,Phys. Lett.B 707(2012) 330[arXiv:1108.6018] [INSPIRE].
[16] ATLAScollaboration,Measurement of the azimuthal anisotropy for charged particle
production in√sN N = 2.76 TeV lead-lead collisions with the ATLAS detector,Phys. Rev.C
86(2012) 014907[arXiv:1203.3087] [INSPIRE].
[17] ATLAScollaboration,Measurement of the distributions of event-by-event flow harmonics in
lead-lead collisions at√sN N = 2.76TeV with the ATLAS detector at the LHC,JHEP 11
(2013) 183[arXiv:1305.2942] [INSPIRE].
[18] PHOBOScollaboration, B. Alver et al.,Event-by-event fluctuations of azimuthal particle
anisotropy in Au + Au collisions at√sN N = 200 GeV,Phys. Rev. Lett.104(2010) 142301 [nucl-ex/0702036] [INSPIRE].
[19] B. Alver et al.,Importance of correlations and fluctuations on the initial source eccentricity in high-energy nucleus-nucleus collisions,Phys. Rev. C 77(2008) 014906[arXiv:0711.3724] [INSPIRE].
[20] R.S. Bhalerao and J.-Y. Ollitrault,Eccentricity fluctuations and elliptic flow at RHIC,Phys. Lett.B 641(2006) 260[nucl-th/0607009] [INSPIRE].
[21] S.A. Voloshin, A.M. Poskanzer, A. Tang and G. Wang,Elliptic flow in the Gaussian model of eccentricity fluctuations,Phys. Lett.B 659(2008) 537[arXiv:0708.0800] [INSPIRE].
[22] J.-Y. Ollitrault, A.M. Poskanzer and S.A. Voloshin,Effect of flow fluctuations and nonflow on elliptic flow methods,Phys. Rev.C 80(2009) 014904 [arXiv:0904.2315] [INSPIRE].
[23] B. Alver and G. Roland,Collision geometry fluctuations and triangular flow in heavy-ion collisions,Phys. Rev.C 81(2010) 054905[Erratum ibid.C 82 (2010) 039903]
[arXiv:1003.0194] [INSPIRE].
[24] Z. Qiu and U.W. Heinz,Event-by-event shape and flow fluctuations of relativistic heavy-ion collision fireballs,Phys. Rev.C 84(2011) 024911 [arXiv:1104.0650] [INSPIRE].
[25] M. Luzum and J.-Y. Ollitrault,Extracting the shear viscosity of the quark-gluon plasma from flow in ultra-central heavy-ion collisions,Nucl. Phys. A904-905(2013) 377c–380c
[arXiv:1210.6010] [INSPIRE].
[26] F.G. Gardim, F. Grassi, M. Luzum and J.-Y. Ollitrault,Breaking of factorization of two-particle correlations in hydrodynamics,Phys. Rev.C 87 (2013) 031901
[arXiv:1211.0989] [INSPIRE].
JHEP02(2014)088
[28] CMScollaboration, The CMS experiment at the CERN LHC,2008JINST 3S08004[INSPIRE].
[29] CMScollaboration, Performance of the combined zero degree calorimeter for CMS,J. Phys. Conf. Ser.160(2009) 012059[arXiv:0807.0785] [INSPIRE].
[30] Z.-W. Lin, C.M. Ko, B.-A. Li, B. Zhang and S. Pal,A multi-phase transport model for relativistic heavy ion collisions,Phys. Rev.C 72 (2005) 064901[nucl-th/0411110] [INSPIRE].
[31] GEANT4collaboration, S. Agostinelli et al.,GEANT4 — a simulation toolkit, Nucl. Instrum. Meth.A 506(2003) 250[INSPIRE].
[32] O. Djuvsland and J. Nystrand,Single and double photonuclear excitations in Pb+Pb
collisions at√sN N = 2.76TeV at the CERN Large Hadron Collider,Phys. Rev.C 83(2011)
041901[arXiv:1011.4908] [INSPIRE].
[33] I. Lokhtin and A. Snigirev,A model of jet quenching in ultrarelativistic heavy ion collisions and high-pT hadron spectra at RHIC,Eur. Phys. J.C 45(2006) 211[hep-ph/0506189] [INSPIRE].
[34] CMScollaboration, Observation of long-range near-side angular correlations in
proton-proton collisions at the LHC,JHEP 09(2010) 091[arXiv:1009.4122] [INSPIRE].
[35] CMScollaboration, Long-range and short-range dihadron angular correlations in central
PbPb collisions at a nucleon-nucleon center of mass energy of2.76TeV,JHEP 07(2011) 076
[arXiv:1105.2438] [INSPIRE].
[36] CMScollaboration, Observation of long-range near-side angular correlations in proton-lead
collisions at the LHC,Phys. Lett.B 718(2013) 795[arXiv:1210.5482] [INSPIRE].
[37] CMScollaboration, Multiplicity and transverse momentum dependence of two- and
four-particle correlations in pPb and PbPb collisions,Phys. Lett.B 724(2013) 213
[arXiv:1305.0609] [INSPIRE].
[38] B.H. Alver, C. Gombeaud, M. Luzum and J.-Y. Ollitrault, Triangular flow in hydrodynamics and transport theory,Phys. Rev.C 82(2010) 034913 [arXiv:1007.5469] [INSPIRE].
[39] N. Borghini and J.-Y. Ollitrault,Momentum spectra, anisotropic flow and ideal fluids,Phys. Lett.B 642(2006) 227[nucl-th/0506045] [INSPIRE].
[40] M.L. Miller, K. Reygers, S.J. Sanders and P. Steinberg,Glauber modeling in high energy nuclear collisions,Ann. Rev. Nucl. Part. Sci.57(2007) 205[nucl-ex/0701025].
[41] B. Alver, M. Baker, C. Loizides and P. Steinberg,The PHOBOS Glauber Monte Carlo,
arXiv:0805.4411[INSPIRE].
[42] H.-J. Drescher, A. Dumitru, A. Hayashigaki and Y. Nara,The eccentricity in heavy-ion collisions from color glass condensate initial conditions,Phys. Rev.C 74 (2006) 044905
JHEP02(2014)088
The CMS collaborationYerevan Physics Institute, Yerevan, Armenia
S. Chatrchyan, V. Khachatryan, A.M. Sirunyan, A. Tumasyan
Institut f¨ur Hochenergiephysik der OeAW, Wien, Austria
W. Adam, T. Bergauer, M. Dragicevic, J. Er¨o, C. Fabjan1, M. Friedl, R. Fr¨uhwirth1,
V.M. Ghete, C. Hartl, N. H¨ormann, J. Hrubec, M. Jeitler1, W. Kiesenhofer, V. Kn¨unz,
M. Krammer1, I. Kr¨atschmer, D. Liko, I. Mikulec, D. Rabady2, B. Rahbaran, H. Rohringer,
R. Sch¨ofbeck, J. Strauss, A. Taurok, W. Treberer-Treberspurg, W. Waltenberger, C.-E. Wulz1
National Centre for Particle and High Energy Physics, Minsk, Belarus V. Mossolov, N. Shumeiko, J. Suarez Gonzalez
Universiteit Antwerpen, Antwerpen, Belgium
S. Alderweireldt, M. Bansal, S. Bansal, T. Cornelis, E.A. De Wolf, X. Janssen, A. Knutsson, S. Luyckx, L. Mucibello, S. Ochesanu, B. Roland, R. Rougny, H. Van Haevermaet, P. Van Mechelen, N. Van Remortel, A. Van Spilbeeck
Vrije Universiteit Brussel, Brussel, Belgium
F. Blekman, S. Blyweert, J. D’Hondt, N. Heracleous, A. Kalogeropoulos, J. Keaveney, T.J. Kim, S. Lowette, M. Maes, A. Olbrechts, D. Strom, S. Tavernier, W. Van Doninck, P. Van Mulders, G.P. Van Onsem, I. Villella
Universit´e Libre de Bruxelles, Bruxelles, Belgium
C. Caillol, B. Clerbaux, G. De Lentdecker, L. Favart, A.P.R. Gay, A. L´eonard, P.E. Marage, A. Mohammadi, L. Perni`e, T. Reis, T. Seva, L. Thomas, C. Vander Velde, P. Vanlaer, J. Wang
Ghent University, Ghent, Belgium
V. Adler, K. Beernaert, L. Benucci, A. Cimmino, S. Costantini, S. Dildick, G. Garcia, B. Klein, J. Lellouch, J. Mccartin, A.A. Ocampo Rios, D. Ryckbosch, S. Salva Diblen, M. Sigamani, N. Strobbe, F. Thyssen, M. Tytgat, S. Walsh, E. Yazgan, N. Zaganidis
Universit´e Catholique de Louvain, Louvain-la-Neuve, Belgium
S. Basegmez, C. Beluffi3, G. Bruno, R. Castello, A. Caudron, L. Ceard, G.G. Da Silveira, C. Delaere, T. du Pree, D. Favart, L. Forthomme, A. Giammanco4, J. Hollar,
P. Jez, M. Komm, V. Lemaitre, J. Liao, O. Militaru, C. Nuttens, D. Pagano, A. Pin, K. Piotrzkowski, A. Popov5, L. Quertenmont, M. Selvaggi, M. Vidal Marono, J.M. Vizan Garcia
Universit´e de Mons, Mons, Belgium
N. Beliy, T. Caebergs, E. Daubie, G.H. Hammad
JHEP02(2014)088
Universidade do Estado do Rio de Janeiro, Rio de Janeiro, Brazil
W.L. Ald´a J´unior, W. Carvalho, J. Chinellato6, A. Cust´odio, E.M. Da Costa, D. De Jesus
Damiao, C. De Oliveira Martins, S. Fonseca De Souza, H. Malbouisson, M. Malek, D. Matos Figueiredo, L. Mundim, H. Nogima, W.L. Prado Da Silva, J. Santaolalla, A. Santoro, A. Sznajder, E.J. Tonelli Manganote6, A. Vilela Pereira
Universidade Estadual Paulistaa, Universidade Federal do ABCb, S˜ao Paulo,
Brazil
C.A. Bernardesb, F.A. Diasa,7, T.R. Fernandez Perez Tomeia, E.M. Gregoresb, C. Laganaa,
P.G. Mercadanteb, S.F. Novaesa, Sandra S. Padulaa
Institute for Nuclear Research and Nuclear Energy, Sofia, Bulgaria
V. Genchev2, P. Iaydjiev2, A. Marinov, S. Piperov, M. Rodozov, G. Sultanov, M. Vutova
University of Sofia, Sofia, Bulgaria
A. Dimitrov, I. Glushkov, R. Hadjiiska, V. Kozhuharov, L. Litov, B. Pavlov, P. Petkov
Institute of High Energy Physics, Beijing, China
J.G. Bian, G.M. Chen, H.S. Chen, M. Chen, R. Du, C.H. Jiang, D. Liang, S. Liang, X. Meng, R. Plestina8, J. Tao, X. Wang, Z. Wang
State Key Laboratory of Nuclear Physics and Technology, Peking University, Beijing, China
C. Asawatangtrakuldee, Y. Ban, Y. Guo, Q. Li, S. Liu, Y. Mao, S.J. Qian, D. Wang, L. Zhang, W. Zou
Universidad de Los Andes, Bogota, Colombia
C. Avila, C.A. Carrillo Montoya, L.F. Chaparro Sierra, C. Florez, J.P. Gomez, B. Gomez Moreno, J.C. Sanabria
Technical University of Split, Split, Croatia N. Godinovic, D. Lelas, D. Polic, I. Puljak
University of Split, Split, Croatia Z. Antunovic, M. Kovac
Institute Rudjer Boskovic, Zagreb, Croatia
V. Brigljevic, K. Kadija, J. Luetic, D. Mekterovic, S. Morovic, L. Tikvica
University of Cyprus, Nicosia, Cyprus
A. Attikis, G. Mavromanolakis, J. Mousa, C. Nicolaou, F. Ptochos, P.A. Razis
Charles University, Prague, Czech Republic M. Finger, M. Finger Jr.
Academy of Scientific Research and Technology of the Arab Republic of Egypt, Egyptian Network of High Energy Physics, Cairo, Egypt
A.A. Abdelalim9, Y. Assran10, S. Elgammal9, A. Ellithi Kamel11, M.A. Mahmoud12,
JHEP02(2014)088
National Institute of Chemical Physics and Biophysics, Tallinn, Estonia M. Kadastik, M. M¨untel, M. Murumaa, M. Raidal, L. Rebane, A. Tiko
Department of Physics, University of Helsinki, Helsinki, Finland P. Eerola, G. Fedi, M. Voutilainen
Helsinki Institute of Physics, Helsinki, Finland
J. H¨ark¨onen, V. Karim¨aki, R. Kinnunen, M.J. Kortelainen, T. Lamp´en, K. Lassila-Perini, S. Lehti, T. Lind´en, P. Luukka, T. M¨aenp¨a¨a, T. Peltola, E. Tuominen, J. Tuominiemi, E. Tuovinen, L. Wendland
Lappeenranta University of Technology, Lappeenranta, Finland T. Tuuva
DSM/IRFU, CEA/Saclay, Gif-sur-Yvette, France
M. Besancon, F. Couderc, M. Dejardin, D. Denegri, B. Fabbro, J.L. Faure, F. Ferri, S. Ganjour, A. Givernaud, P. Gras, G. Hamel de Monchenault, P. Jarry, E. Locci, J. Malcles, A. Nayak, J. Rander, A. Rosowsky, M. Titov
Laboratoire Leprince-Ringuet, Ecole Polytechnique, IN2P3-CNRS, Palaiseau, France
S. Baffioni, F. Beaudette, P. Busson, C. Charlot, N. Daci, T. Dahms, M. Dalchenko, L. Dobrzynski, A. Florent, R. Granier de Cassagnac, P. Min´e, C. Mironov, I.N. Naranjo, M. Nguyen, C. Ochando, P. Paganini, D. Sabes, R. Salerno, Y. Sirois, C. Veelken, Y. Yilmaz, A. Zabi
Institut Pluridisciplinaire Hubert Curien, Universit´e de Strasbourg, Univer-sit´e de Haute Alsace Mulhouse, CNRS/IN2P3, Strasbourg, France
J.-L. Agram15, J. Andrea, D. Bloch, J.-M. Brom, E.C. Chabert, C. Collard, E. Conte15,
F. Drouhin15, J.-C. Fontaine15, D. Gel´e, U. Goerlach, C. Goetzmann, P. Juillot, A.-C. Le
Bihan, P. Van Hove
Centre de Calcul de l’Institut National de Physique Nucleaire et de Physique des Particules, CNRS/IN2P3, Villeurbanne, France
S. Gadrat
Universit´e de Lyon, Universit´e Claude Bernard Lyon 1, CNRS-IN2P3, Institut de Physique Nucl´eaire de Lyon, Villeurbanne, France
S. Beauceron, N. Beaupere, G. Boudoul, S. Brochet, J. Chasserat, R. Chierici, D. Contardo, P. Depasse, H. El Mamouni, J. Fan, J. Fay, S. Gascon, M. Gouzevitch, B. Ille, T. Kurca, M. Lethuillier, L. Mirabito, S. Perries, J.D. Ruiz Alvarez, L. Sgandurra, V. Sordini, M. Vander Donckt, P. Verdier, S. Viret, H. Xiao
Institute of High Energy Physics and Informatization, Tbilisi State University, Tbilisi, Georgia
JHEP02(2014)088
RWTH Aachen University, I. Physikalisches Institut, Aachen, Germany
C. Autermann, S. Beranek, M. Bontenackels, B. Calpas, M. Edelhoff, L. Feld, O. Hindrichs, K. Klein, A. Ostapchuk, A. Perieanu, F. Raupach, J. Sammet, S. Schael, D. Sprenger, H. Weber, B. Wittmer, V. Zhukov5
RWTH Aachen University, III. Physikalisches Institut A, Aachen, Germany
M. Ata, J. Caudron, E. Dietz-Laursonn, D. Duchardt, M. Erdmann, R. Fischer, A. G¨uth, T. Hebbeker, C. Heidemann, K. Hoepfner, D. Klingebiel, S. Knutzen, P. Kreuzer, M. Mer-schmeyer, A. Meyer, M. Olschewski, K. Padeken, P. Papacz, H. Reithler, S.A. Schmitz, L. Sonnenschein, D. Teyssier, S. Th¨uer, M. Weber
RWTH Aachen University, III. Physikalisches Institut B, Aachen, Germany
V. Cherepanov, Y. Erdogan, G. Fl¨ugge, H. Geenen, M. Geisler, W. Haj Ahmad, F. Hoehle, B. Kargoll, T. Kress, Y. Kuessel, J. Lingemann2, A. Nowack, I.M. Nugent, L. Perchalla,
O. Pooth, A. Stahl
Deutsches Elektronen-Synchrotron, Hamburg, Germany
I. Asin, N. Bartosik, J. Behr, W. Behrenhoff, U. Behrens, A.J. Bell, M. Bergholz17,
A. Bethani, K. Borras, A. Burgmeier, A. Cakir, L. Calligaris, A. Campbell, S. Choudhury, F. Costanza, C. Diez Pardos, S. Dooling, T. Dorland, G. Eckerlin, D. Eckstein, T. Eichhorn, G. Flucke, A. Geiser, A. Grebenyuk, P. Gunnellini, S. Habib, J. Hauk, G. Hellwig, M. Hempel, D. Horton, H. Jung, M. Kasemann, P. Katsas, J. Kieseler, C. Kleinwort, M. Kr¨amer, D. Kr¨ucker, W. Lange, J. Leonard, K. Lipka, W. Lohmann17, B. Lutz,
R. Mankel, I. Marfin, I.-A. Melzer-Pellmann, A.B. Meyer, J. Mnich, A. Mussgiller, S. Naumann-Emme, O. Novgorodova, F. Nowak, H. Perrey, A. Petrukhin, D. Pitzl, R. Pla-cakyte, A. Raspereza, P.M. Ribeiro Cipriano, C. Riedl, E. Ron, M. ¨O. Sahin, J. Salfeld-Nebgen, R. Schmidt17, T. Schoerner-Sadenius, M. Schr¨oder, M. Stein, A.D.R. Vargas
Trevino, R. Walsh, C. Wissing
University of Hamburg, Hamburg, Germany
M. Aldaya Martin, V. Blobel, H. Enderle, J. Erfle, E. Garutti, M. G¨orner, M. Gosselink, J. Haller, K. Heine, R.S. H¨oing, H. Kirschenmann, R. Klanner, R. Kogler, J. Lange, I. Marchesini, J. Ott, T. Peiffer, N. Pietsch, D. Rathjens, C. Sander, H. Schettler, P. Schleper, E. Schlieckau, A. Schmidt, M. Seidel, J. Sibille18, V. Sola, H. Stadie,
G. Steinbr¨uck, D. Troendle, E. Usai, L. Vanelderen
Institut f¨ur Experimentelle Kernphysik, Karlsruhe, Germany
C. Barth, C. Baus, J. Berger, C. B¨oser, E. Butz, T. Chwalek, W. De Boer, A. Descroix, A. Dierlamm, M. Feindt, M. Guthoff2, F. Hartmann2, T. Hauth2, H. Held, K.H. Hoffmann,
U. Husemann, I. Katkov5, A. Kornmayer2, E. Kuznetsova, P. Lobelle Pardo, D. Martschei,
JHEP02(2014)088
Institute of Nuclear and Particle Physics (INPP), NCSR Demokritos, Aghia Paraskevi, Greece
G. Anagnostou, G. Daskalakis, T. Geralis, S. Kesisoglou, A. Kyriakis, D. Loukas, A. Markou, C. Markou, E. Ntomari, I. Topsis-giotis
University of Athens, Athens, Greece
L. Gouskos, A. Panagiotou, N. Saoulidou, E. Stiliaris
University of Io´annina, Io´annina, Greece
X. Aslanoglou, I. Evangelou, G. Flouris, C. Foudas, P. Kokkas, N. Manthos, I. Papadopou-los, E. Paradas
Wigner Research Centre for Physics, Budapest, Hungary
G. Bencze, C. Hajdu, P. Hidas, D. Horvath19, F. Sikler, V. Veszpremi, G. Vesztergombi20,
A.J. Zsigmond
Institute of Nuclear Research ATOMKI, Debrecen, Hungary N. Beni, S. Czellar, J. Molnar, J. Palinkas, Z. Szillasi
University of Debrecen, Debrecen, Hungary J. Karancsi, P. Raics, Z.L. Trocsanyi, B. Ujvari
National Institute of Science Education and Research, Bhubaneswar, India S.K. Swain
Panjab University, Chandigarh, India
S.B. Beri, V. Bhatnagar, N. Dhingra, R. Gupta, M. Kaur, M.Z. Mehta, M. Mittal, N. Nishu, A. Sharma, J.B. Singh
University of Delhi, Delhi, India
Ashok Kumar, Arun Kumar, S. Ahuja, A. Bhardwaj, B.C. Choudhary, A. Kumar, S. Malhotra, M. Naimuddin, K. Ranjan, P. Saxena, V. Sharma, R.K. Shivpuri
Saha Institute of Nuclear Physics, Kolkata, India
S. Banerjee, S. Bhattacharya, K. Chatterjee, S. Dutta, B. Gomber, Sa. Jain, Sh. Jain, R. Khurana, A. Modak, S. Mukherjee, D. Roy, S. Sarkar, M. Sharan, A.P. Singh
Bhabha Atomic Research Centre, Mumbai, India
A. Abdulsalam, D. Dutta, S. Kailas, V. Kumar, A.K. Mohanty2, L.M. Pant, P. Shukla,
A. Topkar
Tata Institute of Fundamental Research - EHEP, Mumbai, India
T. Aziz, R.M. Chatterjee, S. Ganguly, S. Ghosh, M. Guchait21, A. Gurtu22, G. Kole, S.
Ku-mar, M. Maity23, G. Majumder, K. Mazumdar, G.B. Mohanty, B. Parida, K. Sudhakar, N. Wickramage24
JHEP02(2014)088
Institute for Research in Fundamental Sciences (IPM), Tehran, Iran
H. Arfaei, H. Bakhshiansohi, H. Behnamian, S.M. Etesami25, A. Fahim26, A.
Ja-fari, M. Khakzad, M. Mohammadi Najafabadi, M. Naseri, S. Paktinat Mehdiabadi, B. Safarzadeh27, M. Zeinali
University College Dublin, Dublin, Ireland
M. Grunewald
INFN Sezione di Bari a, Universit`a di Bari b, Politecnico di Bari c, Bari, Italy
M. Abbresciaa,b, L. Barbonea,b, C. Calabriaa,b, S.S. Chhibraa,b, A. Colaleoa, D. Creanzaa,c, N. De Filippisa,c, M. De Palmaa,b, L. Fiorea, G. Iasellia,c, G. Maggia,c, M. Maggia, B. Marangellia,b, S. Mya,c, S. Nuzzoa,b, N. Pacificoa, A. Pompilia,b, G. Pugliesea,c,
R. Radognaa,b, G. Selvaggia,b, L. Silvestrisa, G. Singha,b, R. Vendittia,b, P. Verwilligena, G. Zitoa
INFN Sezione di Bologna a, Universit`a di Bologna b, Bologna, Italy
G. Abbiendia, A.C. Benvenutia, D. Bonacorsia,b, S. Braibant-Giacomellia,b, L. Brigliadoria,b, R. Campaninia,b, P. Capiluppia,b, A. Castroa,b, F.R. Cavalloa,
G. Codispotia,b, M. Cuffiania,b, G.M. Dallavallea, F. Fabbria, A. Fanfania,b, D. Fasanellaa,b, P. Giacomellia, C. Grandia, L. Guiduccia,b, S. Marcellinia, G. Masettia, M. Meneghellia,b, A. Montanaria, F.L. Navarriaa,b, F. Odoricia, A. Perrottaa, F. Primaveraa,b, A.M. Rossia,b,
T. Rovellia,b, G.P. Sirolia,b, N. Tosia,b, R. Travaglinia,b
INFN Sezione di Cataniaa, Universit`a di Cataniab, CSFNSM c, Catania, Italy
S. Albergoa,b, G. Cappelloa, M. Chiorbolia,b, S. Costaa,b, F. Giordanoa,2, R. Potenzaa,b, A. Tricomia,b, C. Tuvea,b
INFN Sezione di Firenze a, Universit`a di Firenze b, Firenze, Italy
G. Barbaglia, V. Ciullia,b, C. Civininia, R. D’Alessandroa,b, E. Focardia,b, E. Galloa, S. Gonzia,b, V. Goria,b, P. Lenzia,b, M. Meschinia, S. Paolettia, G. Sguazzonia,
A. Tropianoa,b
INFN Laboratori Nazionali di Frascati, Frascati, Italy
L. Benussi, S. Bianco, F. Fabbri, D. Piccolo
INFN Sezione di Genova a, Universit`a di Genova b, Genova, Italy
P. Fabbricatorea, R. Ferrettia,b, F. Ferroa, M. Lo Veterea,b, R. Musenicha, E. Robuttia, S. Tosia,b
INFN Sezione di Milano-Bicocca a, Universit`a di Milano-Bicocca b, Milano, Italy
A. Benagliaa, M.E. Dinardoa,b, S. Fiorendia,b,2, S. Gennaia, A. Ghezzia,b, P. Govonia,b,
M.T. Lucchinia,b,2, S. Malvezzia, R.A. Manzonia,b,2, A. Martellia,b,2, D. Menascea,