DISCRIMINANT ANALYSIS IN MARKETING RESEARCH
Assistant Ph.D Erika KULCSÁR "Babeş Bolyai" University of Cluj Napoca
Abstract:
This paper classifies among marketing researches aiming to study the influence that the following independent variables (explanatory) have: "Estimating the expenses incurred in Centre Development Region, including country of residence" and the variable "How many days have you planned to stay in this region?" on the construction of separate groups which form the dependent variables - the type of tourist (foreign, Romanian). Thus I shall analyse the explication of the different characteristics of the groups in terms of different attributes that members of these groups have with respect to the independent variables (explanatory). Questionnaires have been distributed to hotels in Braşov, Predeal, Poiana-Braşov, Sfântu Gheorghe, Covasna, Miercurea-Ciuc, Gheorgheni, Tuşnad, Târgu-Mureş, Sighişoara, Sibiu, Alba – Iulia and other localities that have linked this route. More than 2,000 questionnaires have been distributed. The quantitative research was conducted between 15.05.2009-17.10.2009.
Keywords: marketing research, dependent variable, independent variable, discriminant coefficient.
Discriminant analysis
The subject of the discriminant analysis is the study of the relationships between a dependent variable, measured nominally, which implies the existence of two or more disjoint groups, and a set of independent variables, explanatory, measured intervallic or proportionate. (Lefter, 2004, p. 382)
Between the independent variables and the dependent ones there is a cause-effect relationship, which is why based on the models built, we can make predictions on the evolution of dependent variables according to certain values that the independent variables can have. (Constantin, 2006, p.237).
In order to base some marketing strategies, the relative importance of the expenditures made by tourists have be known as well as the expected length of staying to identify potential Romanian and foreign tourists. I also wanted to find out which of the two variables has a greater influence.
Next I shall make a discriminant analysis based on the data registered from the sample consisting of 410 tourists with respect to: whether they are Romanian or foreign tourists, estimation of the expenses incurred in the Centre Development Region, the number of days planned for this region.
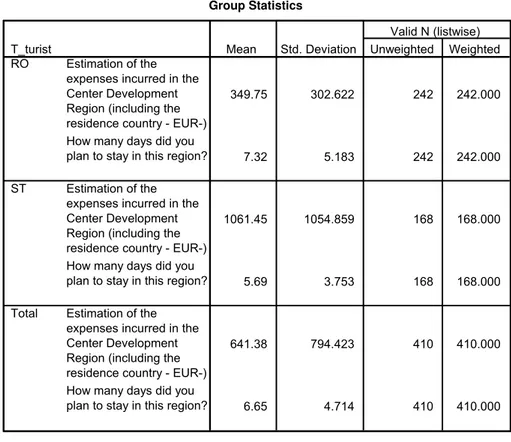
Table 1 The means of the independent variables at the level of groups
Group Statistics
349.75 302.622 242 242.000
7.32 5.183 242 242.000
1061.45 1054.859 168 168.000
5.69 3.753 168 168.000
641.38 794.423 410 410.000
6.65 4.714 410 410.000 Estimation of the
expenses incurred in the Center Development Region (including the residence country - EUR-) How many days did you plan to stay in this region?
Estimation of the expenses incurred in the Center Development Region (including the residence country - EUR-) How many days did you plan to stay in this region?
Estimation of the expenses incurred in the Center Development Region (including the residence country - EUR-) How many days did you plan to stay in this region? T_turist
RO
ST
Total
Mean Std. Deviation Unweighted Weighted Valid N (listwise)
In the above table (table no. 1) it is noted that the average value of the estimated expenses is EUR 349.75 for Romanian tourists, while for foreign
tourists it is EUR 1061.45 EUR. But the average of the planned days is higher for Romanian tourists (7.32) than for foreign tourists which is 5.69 days.
Table 2
Tests of Equality of Group Means
.805 98.571 1 408 .000
.971 12.208 1 408 .001
Estimation of the expenses incurred in the Center Development Region (including the residence country - EUR-) How many days did you plan to stay in this region?
Wilks'
Lambda F df1 df2 Sig.
The levels of minimum significance for which the alternative hypothesis can
have a significant discriminating power. "Estimation of the expenses incurred in the Centre Development Region” has a higher discriminating power as the
coefficient λ Wilks' Lambda is lower and the F value is greater than for the variable "How many days did you plan to stay in this region?"(table no. 2)
Table 3 Correlation between independent variables
Pooled Within-Groups Matrices
1.000 .104
.104 1.000
Estimation of the expenses incurred in the Center Development Region (including the residence country - EUR-) How many days did you plan to stay in this region? Correlation
Estimation of the expenses incurred in the
Center Development
Region (including the
residence country
-EUR-)
How many days did you plan to stay in
this region?
In the table “Pooled Within - Groups Matrices" (table no. 3) the correlation coefficient between the independent variables is calculated. The low value of the correlation coefficient
indicates a weak association between them, thus being respected the condition that the independent variables are not collinear.
Table 4 The own value of the discriminant function
Eigenvalues
.292a 100.0 100.0 .476
Function 1
Eigenvalue % of Variance Cumulative %
Canonical Correlation
First 1 canonical discriminant functions were used in the analysis.
a.
Since the dependent variable has only two categories a single discriminant function is obtained. In
“Eigenvalue" table (table no. 4) the own value of the discriminant function is shown (0.292).
Table 5 Testing of the significance of the discriminant function
Wilks' Lambda
.774 104.417 2 .000
Test of Function(s) 1
Wilks'
Lambda Chi-square df Sig.
The value
χ
calc2 = 104.417χ
0,05;2> = 5.99 so the alternative hypothesis is accepted according to which the function obtained has a significant discriminatory power is accepted. This can also be observed from the level of the minimum significance for which the alternative hypothesis can be accepted: 0.000 <0.05 (table no. 5).The value of λ calculated for the discrimination axis is 0.774 (table no. 5) with a significance level of 0.000, lower than 0.05, a situation which shows, as a whole, an acceptable discrimination.
The non-standard coefficients of the discriminant function are the following:
Table 6 Coefficients of discriminant function
Canonical Discriminant Function Coefficients
.001
-.090
-.256 Estimation of the
expenses incurred in the Center Development Region (including the residence country - EUR-) How many days did you plan to stay in this region?
(Constant)
1 Function
Unstandardized coefficients
Based on the above coefficients (table no. 6) I established the discrimination function:
2 1
0
,
090
001
,
0
256
,
0
x
x
y
=
−
+
⋅
−
⋅
where:
y = discriminant function (Function 1)
1
x
= independent variable 1 ("Estimation of the expenses incurred in the Centre Development Region”)= 2 independent variable ("How many days did you plan to stay in this region?")
These coefficients can be converted to standardized values, corresponding to the values of the normal distribution law. (table no. 7).
2
x
Table 7 The standardized discriminant function coefficients
Standardized Canonical Discriminant Function Coefficients
.953
-.419 Estimation of the
expenses incurred in the Center Development Region (including the residence country - EUR-) How many days did you plan to stay in this region?
1 Function
These results also show that the estimation of the expenses incurred in Centre Development Region has a greater discrimination power than the
other independent variable, because of the strongest association with the discriminant function (table no. 8).
Table 8 Correlations between independent variables and the discriminant function
Structure Matrix
.909
-.320 Estimation of the
expenses incurred in the Center Development Region (including the residence country - EUR-) How many days did you plan to stay in this region?
1 Function
Pooled within-groups correlations between discriminating variables and standardized canonical discriminant functions Variables ordered by absolute size of correlation within function.
The system also provides the average scores of the groups based on their squared distances to their centroids.
Table 9 Average scores for the two groups
Functions at Group Centroids
-.449 .647 T_turist RO ST 1 Function
Unstandardized canonical discriminant functions evaluated at group means
From table no. 9, -0.449 is the average of the discrimination scores of people in the first group and 0.647 is the average of the discrimination scores of people in the second group.
On the basis of these scores the cutting score is calculated which represents the mean of two scores in the table above weighted by the size of the groups.
Thus, the cutting score is determined by the relationship:
CS=
1
168
647
.
0
242
449
.
0
=
⋅
⋅
−
Based on the discrimination scores the groups should to which each respondent should belong to are established. Finally, a centralization of the percentage of the predicted group results.
Table 10 The summary of respondents classification according to the predicted
groups
Classification Results b,c
228 14 242
96 72 168
94.2 5.8 100.0 57.1 42.9 100.0
228 14 242
96 72 168
94.2 5.8 100.0 57.1 42.9 100.0 T_turist RO ST RO ST RO ST RO ST Count % Count % Original Cross-validated a RO ST Predicted Group Membership Total
Cross validation is done only for those cases in the analysis. In cross validation, each case is classified by the functions derived from all cases other than that case.
a.
73.2% of original grouped cases correctly classified. b.
73.2% of cross-validated grouped cases correctly classified. c.
In the table "Classification Results (table no. 10) it can be observed that in the case of Romanian tourists respondents, following the classification, 14 of these respondents should have
152
discriminating score. With the other group, 96 cases (57.1%) do not correspond to the discriminating classification based on the discriminating score. These tourists/respondents, according to the classification, should have been part of the group of Romanian tourists.
Conclusions
Following this analysis I can say that: the mean of the planned staying days of Romanian tourists is higher as compared to the mean of the planned staying days of foreign tourists in Centre Development Region; both the variable "Estimation of the expenses incurred in the Centre Development Region" and the variable " Number of predicted
staying days in the Centre Development Region" have a significant discrimination power but the variable "Estimation of the expenses incurred in the Centre Development Region" has a greater discrimination power than the other independent variable. Finally a percentage of 73.2% of cases correctly classified results. The results obtained from a cross validation of the model show the same structure of the classification.
I believe that the achievement of a multiple discriminant analysis would "provide" valuable information for companies that operate on tourist market in the Centre Development Region.
REFERENCES
Lefter, Constantin (2004), Marketing Research, Braşov: Infomarket Printing House Constantin, Cristinel (2006), Marketing computer systems. Analysis and processing