DOI: 10.13164/re.2015.0178 SIGNALS
Efficient Spectral Power Estimation
on an Arbitrary Frequency Scale
Filip ZAPLATA, Miroslav KASAL
Dept. of Radio Electronics, Brno University of Technology, Technická 12, 612 00 Brno, Czech Republic
[email protected], [email protected]
Abstract. The Fast Fourier Transform is a very efficient algorithm for the Fourier spectrum estimation, but has the limitation of a linear frequency scale spectrum, which may not be suitable for every system. For example, audio and speech analysis needs a logarithmic frequency scale due to the characteristic of a human’s ear. The Fast Fourier Transform algorithms are not able to efficiently give the desired results and modified techniques have to be used in this case. In the following text a simple technique using the Goertzel algorithm allowing the evaluation of the power spectra on an arbitrary frequency scale will be introduced. Due to its simplicity the algorithm suffers from imperfec-tions which will be discussed and partially solved in this paper. The implementation into real systems and the im-pact of quantization errors appeared to be critical and have to be dealt with in special cases. The simple method dealing with the quantization error will also be introduced. Finally, the proposed method will be compared to other methods based on its computational demands and its potential speed.
Keywords
Goertzel algorithm, Mel frequency cepstral coeffi-cients, MFCCs, Q-constant transform, spectral power estimation
1.
Introduction
Many techniques for spectral analysis are based on the short time Fourier spectra and since the Fast Fourier Transform (FFT) algorithms have been developed, the estimation of the spectra is even more suitable. Spectral resolution of the algorithms depends on the number of time domain samples that are processed, and the number of complex samples directly equals the resulted number of complex spectral lines (bins). The bins are equidistantly spread along the linear frequency scale in the range con-strained by the sampling theorem.
There are situations in which the linear frequency scale is not convenient, e.g. speech or music analysis. Such inconvenience originates from the natural character of a human’s ear the frequency characteristic of which is far
different from the linear spectral scale. The model of a human’s ear [1] says that the spectral resolution should be logarithmically distributed over the audible spectrum. Several techniques are used for the logarithmically distrib-uted frequency scale spectrum estimation; the Mel-Fre-quency Cepstrum Coefficients (MFCC) [2] and the con-stant Q-transform [3] are the main ones.
The MFFC algorithm uses the spectral estimation of a sufficient frequency resolution computed by the FFT. The spectrum is then successively processed by triangular win-dows in accordance to spectral requirements. Windowing may be provided by a predefined filter bank. Filter bank outputs are converted to a logarithmic amplitude scale and processed by the Discrete Cosine Transform (DCT). Each output of the DCT then corresponds to the spectral line of the desired frequency scale. Over the years many computa-tional forms have been developed which are more or less effective as e.g. in [4] or [5].
The constant Q-transform originates from the basic definition of the Discrete Fourier Transform (DFT), where the computation is not provided for all bins. J. Brown in [3] defined the algorithm for computing DFT parameters to fulfill predefined requirements. The original calculation can also be efficiently modified as in [6] or for audio sig-nals in [7].
M. Tröbs and G. Heinzel also published a different approach [8], where they applied an averaging over modi-fied periodogram. Their improved method computes the Fourier transform optimally for the logarithmic frequency scale, but is more convenient for a high resolution analysis and therefore is very complex.
logarithmic frequency scale distribution will be studied in the following text.
2.
Efficient Approach to Spectral
Power Estimation
In Fig. 1 the problem of using conventional Fourier transform algorithms for spectral estimation is depicted. Under the log-scale at low frequencies there is an obvious lack of information whereas at high frequencies there are many redundant bins that have to be averaged. Thus, even though the FFT is a very efficient algorithm for estimation of linearly distributed spectra, its computational demands grow rapidly if high resolution at low frequencies is required.
As obvious from the definition of the discrete Fourier transform
1
2 0
k N
j n N n
X k x n e S
¦
(1)individual bins can be calculated separately. The resolution of the spectrum depends on the number of processed samples N and k indexes the bins.
Obviously, this property helps to eliminate unneces-sary bins and additionally set the resolution for each bin computation separately. The Fourier transform can be viewed as a bank of band-pass filters with an impulse re-sponse
2 N
k j n
N
h n u n e S (2)
where uN(n) denotes the constraints of the sum (1), i.e. rectangular window. The power spectral density (PSD) characteristics of the filters can be derived by the method in [9] and an example is shown in Fig. 2.
From PSD it is clear that the length of the filter N di-rectly influences its bandwidth, further description of this relation is in [10]; notice also the zero transfer at
frequen-cies of adjacent bins. The filters can then be set to analyze the signal under the desired scale; a nice example is a log-scale of base 2. The k coefficient is constant over all bins and length N is halved with each bin going to the highest frequencies and it causes the desired widening of its band-width as depicted in Fig. 3.
The direct evaluation of (1) can be replaced by the faster Goertzel algorithm. The algorithm is a convolutional form of (1) and the derivation can be found in [9]. It is used for fast calculation of selected bins and hence very suitable for our purpose. Its transfer function is shown in the following equation
2 1
1 2
1
1 2z cos 2
k j
N
z e H z
k z N
S S
§ ·
¨ ¸
© ¹
(3)
where the output sample is valid for every Nth sample after which the filter has to be cleared. This condition provides the rectangular windowing of the impulse response.
The Goertzel algorithm is useful not only for discrete frequencies defined by N, i.e. k , but as declared in [11] it can be used for frequencies in between the bins, i.e.
k may be real. This statement is correct, but suffers from spectral leakage more than for integer k. The reason why the leakage is higher is that since the filter is complex, the main passing lobe of the PSD is present only on one side of the complex spectrum. Thus, shifting the frequency re-sponse of non-integer k causes the zero of the transfer function not to be at the position of the opposite frequency image, which then causes aliasing. The effect is clear from Fig. 4.
This effect is more apparent when the filter is tuned near the edges of a sampled region, where the images are very close, and when the spectral leakage is high, which is for a rectangular window. Another window with better
Fig. 1. The upper image shows the linear distribution of the Fourier transform and the bottom image shows the same distribution under the log-scale.
Fig. 2. PSD example for N = 10 and k = 2 (solid line) and
N = 20 and k = 8 (dashed line).
spectral leakage characteristics can be used by weighting the input signal because the impulse response is inaccessible within the effective realization of the Goertzel algorithm. The impact of weighting by Hanning window on the PSD has been presented in [10]. The additional win-dowing has to be applied before the filter and therefore it degrades useful power of the signal and significantly in-creases computational demands because each log-bin needs different N and consequently the window size is also different.
3.
A Novel Technique for Elimination
of Additional Spectral Leakage for
Arbitrary Frequencies
The spectral leakage is usually treated by windowing. Even in [11], dealing with arbitrary frequencies defined by real k, some weighting window is supposed to be used. Authors in [8] also met this issue and due to its mini-mization by windowing considered it as negligible. The following text presents a novel and more efficient approach to eliminating leakage of the mirror image of the desired frequency and therefore providing better characteristic for real k and rectangular weighting window.
First, we have to find an analytic response of the bin calculation to a harmonic signal of the same frequency. The solution of the limited convolution is
1 2 k 0 4 4 cos 2 1 . 2 1 k N
j n m
N m j k j j k j N k
Y n M m e
N M e Ne e e S S M M S S M § · ¨ ¸ © ¹ § · ¨ ¸ ¨ ¸ ¨ ¸ © ¹
¦
(4)The bin value is newly denoted as Y and is proposed to be dependent on time samples n instead of one time sample X in (1). The applied harmonic signal has magnitude M and phase φ. Note that for integer k the second term of the solution is zero and the result simplifies to a complex value expected for the Fourier bin power. Substituting the parasitic value
4 4 1 1 j k k j N e A e S S (5) and the desired value
j
B MeM (6)
the response (4) can be rewritten as
*k
1 2
Y n BNB A . (7)
Equation (7) can now be solved for unknown B as
*k k * 2
2
B AY NY
AA N (8)
where Yk is the output of the uncompensated Goertzel filter. The optimized way for signal power computation of the original Goertzel algorithm
2 2 2
k 1 1
Y n d n d n Cd n d n (9)
has been obtained by powering the complex Goertzel out-put Xk [12]. Variables d(n) and d(n-1) denote delayed sam-ples within the recursive part of the algorithm [12]. C de-notes the frequency coefficient (10), which can also be evaluated by corresponding absolute frequencies fc (tuned frequency) and fS (sampling frequency),
c S
2 cos 2 k 2 cos 2 f
C
N f
S § S ·
§ ·
¨ ¸
¨ ¸
© ¹ © ¹. (10)
The solution of (8) can be put into (9) in the form of additional coefficients resulting in
2 2 2
k M1 M2
M3
1
1 .
Y n d n Q d n Q
Cd n d n Q
(11)
The compensation coefficients are then
2 2 2 R R I
M1 2
2 2 2 R I
4 A A N 2A N Q
A A N
, (12)
2 2 2
R I
R I
M2 2
2 2 2 R I
4 A A N 2N A cos 4 k Asin 4 k
N N
Q
A A N
S S
§ § § · § ···
¨ ¨¨ ¨ ¸ ¨ ¸¸¸¸
¨ © © ¹ © ¹¹¸
© ¹
, (13)
2 2 2
R I R I
M3 2
2 2 2 R I sin 2 4 2 cos 2 k N
A A N N A A
k N Q
A A N
S
S
§ § § ···
¨ ¨ ¨ ¸¸¸
¨ ¨ © ¹¸¸
¨ ¨ § ·¸¸
¨ ¨¨ ¨ ¸¸¸¸
¨ © © ¹¹¸
© ¹
. (14)
For more convenient evaluation, the substituted com-plex constant A is split into real and imaginary parts AR and
AI respectively. Notice again the state where the frequency coefficient k is integer and A is then zero. All coefficients simplify to only weighting constant (2/N)2 that is common for the Fourier transform power computation.
The evolution of the coefficients is shown in Fig. 6.
Fig. 4. Aliasing of mirror images. Filter of N = 10 is tuned to
It is obvious that the most critical are the frequencies near the edges of the sampled region where the coefficients grow to infinity. Otherwise the coefficients slightly fluctu-ate around the weighting value (2/N)2, which equals 1/9 in this example. The compensation effect is clearly seen on the waterfall spectrogram in Fig. 5; the upper image is for the original uncompensated algorithm, where strong fluctuations at the tuned frequency (k = 2.3) are seen. No-tice also the magnitude range, which goes even over the unity value. The bottom image shows the output signal after compensation, the fluctuations are effectively sup-pressed at the tuned frequency.
4.
Quantization Error of the
Coefficients
When implementing whatever signal processing algorithm, the issues about limited accuracy computing has to be taken into account. The general problem of overflowing and rounding error has been discussed e.g. in
[12]. The solution of these issues mainly lies in properly set accuracy of the fixed point calculations and appropriate order of arithmetic operations. However, the quantization error of the coefficients is a more complicated issue which may cause total failure of the system and therefore it should be given attention.
In Fig. 7, there are two lines, the solid one shows the real quantization error of coefficient C when 4 bits of memory are allocated for its fractional part. The dashed curve shows the maximal error given by
1 qC
0.5 cos cos 2
2 k
N R
E
S
S
§ § · ·
¨ ¨ ¸ ¸
© ¹
© ¹
(15)
and is the envelope of the real error. The coefficient reso-lution is given by the quantum count R, which is R = 24 for 4-bit resolution. The equation was obtained by the reverse tuning coefficient computation, i.e. the absolute frequency error is the frequency calculated back from the ideal tuning coefficient distorted by a half quantum of fixed point
num-Fig. 5. Waterfall spectrogram of the original method and compensated method for N = 10 and k = 2.3.
Fig. 6. Evolution of the magnitude compensation coefficients: example for N = 6.
ber representation. It is now clear that the most critical are the edges of the frequency range, where the error grows rapidly. Note also, that equation (15) does not have a real solution for all frequencies, where the argument of the cos–1(x) function can run out of the range ¢–1; 1². Such an occurrence has to be prevented during the design.
The quantization error of coefficient C is particularly critical for log-scale frequency spectral estimation, where the need of accuracy in frequency grows at low frequen-cies. A possible solution for this issue is to raise the quanti-zation accuracy of the system, i.e. raise R, or to move the ratio k/N to a less critical region. The second way can be maintained by pre-filtering and decimation.
A simple low-pass filter is the moving average, which in fact is a limiting case of the Goertzel algorithm and therefore the equation
2 1 G sin 1 sin k
j f N
N
k N f
N
H f e
N k f N S S S § · ¨ ¸ © ¹ § § ··
¨ ¨© ¸¹¸
© ¹
§ § ·· ¨ ¨© ¸¹¸
© ¹
(16)
[9] can be used for calculating the frequency response of the moving average filter
MAMA G 0 MA
sin sin k
N f
H f H f
N f
S
S . (17)
The impulse response is then
MA NMA MA
1
h n u n
N (18)
which is a rectangular pulse in fact.
The moving average is realized as the summing of
NMA samples and weighting them by its number before letting them into the Goertzel filter. The design of the Goertzel coefficients then has to include NMA times decimation as a substitution
c MA MA S f N k k N
No N f , (19)
i.e. to give the desired frequency response, the k/N ratio of the Goertzel filter is NMA times raised.
The same approach can be used to design the high-pass filter resulting in the impulse response
HP
HP HP
1 1
1n
j n
h n e
N N
S (20)
and magnitude frequency response
HP HP G 2 MA 1 sin 2 1 sin 2 N k N f
H f H f
N f S S § § ·· ¨ ¨ ¸¸ © ¹ © ¹ § § ·· ¨ ¨© ¸¹¸
© ¹
. (21)
From the impulse response it can be derived that realization of the high-pass filter lies also in summing of NHP samples, but with alternating signs.
The design of the Goertzel filter coefficients then has to include substitution according to formula
S c HP HP
S
f f
k N k
N N
N N f
o . (22)
This proposed solution helps to eliminate the quanti-zation error of the coefficient C, however, very simple filters cause aliasing and distortion; therefore to reach the best performance, the system has to be optimized, or other better filters have to be used.
The compensation coefficients QM1, QM2, QM3 do not affect the recursive part of the filter and therefore, their impact on the results is weak and can be easily predicted from their values, as seen in Fig. 6.
5.
Efficiency Comparison
Finally, the proposed method is briefly compared to the FFT methods from an efficiency point of view. The efficiency or computation demands can be assessed from the theoretical number of multiplications and additions per frame or in our case per fixed number of samples.
The realization equations of the Goertzel algorithm are summarized as
1 2d n x n Cd n d n (23)
and
2 2
k M1 M2
M3
1
1 . Y n Q d n Q d n
CQ d n d n
(24)
From the equations the number of real multiplications per frame is N + 6 and the number of real additions is 2(N + 1). Assuming the log-scale distribution of base 2, as in Fig. 3, results in the number of multiplications
1G 2 2 6 6
K p
M K (25)
and additions
G 2 2 4 4
K p
A K (26)
for K log-scale bins. The frame size of each bin is different, so the number of samples, to which the results are com-pared, is the length of the longest frame. The longest frame also defines the length of the FFT algorithm used for the same frequency resolution within other spectral analysis algorithms. The value
2 K
log
p N (27)
defines the bandwidth of the bin tuned to the highest fre-quency, i.e. with the widest bandwidth NK.
FFT log2 2
M N N N (28)
and additions
FFT 2 log2
A N NN, (29)
when used for power spectrum computation.
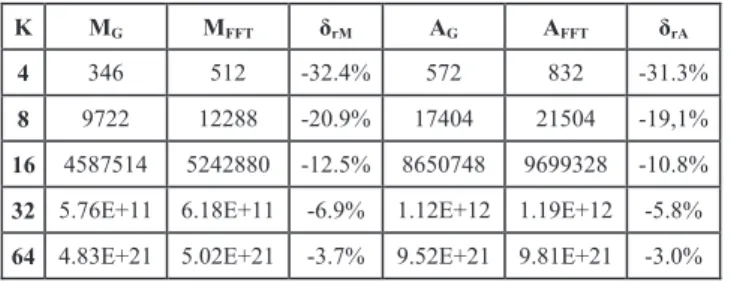
In Tab. 1, there are a few values of the Goertzel algo-rithm computational demands in comparison with its equivalent FFT algorithm for p = 3. For example for the row for eight log-scale bins at relative frequencies
3
2 2 2 2 2 2 2 2 , , , , , , , 8 16 32 64 128 256 512 1024 p
ª º
« »
¬ ¼ the relative deviation is
-20.9% and -19.1% for multiplications and additions re-spectively compared at 1024 samples of the input signal. The comparison was provided as a relative deviation of the computational demands against the reference FFT radix-2 power spectrum algorithm. In all cases, there appears the minus sign which means an improvement. Notice also that for very large number of bins K, equation (25) and (26) converge to the FFT demands (28) and (29), because in such a case K = log2N.
K MG MFFT δrM AG AFFT δrA
4 346 512 -32.4% 572 832 -31.3%
8 9722 12288 -20.9% 17404 21504 -19,1%
16 4587514 5242880 -12.5% 8650748 9699328 -10.8%
32 5.76E+11 6.18E+11 -6.9% 1.12E+12 1.19E+12 -5.8%
64 4.83E+21 5.02E+21 -3.7% 9.52E+21 9.81E+21 -3.0%
Tab. 1. An example of computational demands.
6.
Conclusion
The Goertzel algorithm has been introduced in a role of an efficient bank of filters for an arbitrary frequency scale spectral analysis. The algorithm implicitly uses a rectangular weighting window and this causes strong spectral leakage, which is a price paid for its simplicity. The Goertzel algorithm is able to be tuned to whatever real frequency within the sampled range, but has stronger leak-age caused by the mirrored central frequency. The novel method of effective mirror image elimination has been introduced. The elimination lies in compensation provided on the output power side with 3 additional, mostly non-critical, coefficients which are much more efficient com-pared to window weighting.
Implementation issues are a very important part of the system design and the Goertzel filter has a very critical issue in the quantization error of the tuning coefficient, which affects the recursive part. The proposed solution helps to significantly reduce the tuning error, but the price paid is the aliasing of leaking signals from the stop-band.
The efficiency of the algorithm was assessed by com-paring the FFT radix-2 algorithm of equivalent length. The number of multiplication and addition operations per a fixed number of samples was compared. The result
showed that the algorithm is slightly less demanding, but considering that the FFT spectral evaluation is only a part not giving the desired arbitrary frequency scale power spectrum, the proposed algorithm is even more efficient.
The algorithm has already been implemented within an audio amplifier to visualize an input signal spectrum in the logarithmic frequency scale. The display resolution is 16 bins of 4-bit depth. In such cases the spectral leakage of the rectangular window is not disturbing; moreover the speed of the algorithm is excellent.
Acknowledgments
The presented research was financed by the Czech Ministry of Education in frame of the National Sustainabil-ity Program, the grant LO1401 INWITE. For the research, infrastructure of the SIX Center was used.
References
[1] ZHENG, F., ZHANG, G., SONG, Z. Comparison of different implementations of MFCC. Journal of Computer Science and Technology, 2001, vol. 16, no. 6, p. 582–589. DOI: 10.1007/BF02943243
[2] DAVIS, S. B., MERMELSTEIN, P. Comparison of parametric representations for monosyllabic word recognition in continuously spoken sentences. IEEE Transactions on Acoustics, Speech and Signal Processing, 1980, vol. 28, no. 4, p. 357–366. DOI: 10.1109/TASSP.1980.1163420
[3] BROWN, J. C. Calculation of constant Q spectral transform.
Journal of the Acoustical Society of America, 1991, vol. 89, no. 1, p. 425–434. DOI: 10.1121/1.400476
[4] GANCHEV, T., FAKOTAKIS, N., KOKKINAKIS, G. Comparative evaluation of various MFCC implementations on the speaker verification task. In Proceedings of the 10th International Conference on Speech and Computer SPECOM 2005. Patras (Greece), October 2005, vol. 1, p. 191–194.
[5] MOLAU, S., PITZ, M., SCHLÜTER, R., NEY, H. Computing MEL-frequency cepstral coefficients on the power spectrum. In
IEEE International Conference on Acoustics, Speech and Signal Processing. Salt Lake City (USA), May 2001, vol. 1, p. 73–76. DOI: 10.1109/ICASSP.2001.940770
[6] BROWN, J. C., PUCKETTE, M. S. An efficient algorithm for the calculation of a constant Q transform. Journal of the Acoustical Society of America, Nov. 1992, vol. 92, no. 5, p. 2698–2701. DOI: 10.1121/1.404385
[7] DOS SANTOS, C. N., NETTO, S. L., BISCAINHO, L. W. P., GRAZIOSI, D. B. A modified constant Q-transform for audio signals. In IEEE International Conference on Acoustics, Speech, and Signal Processing ICASSP2004. Montreal (Canada), 2004, vol. 2, p. 469–472. DOI: 10.1109/ICASSP.2004.1326296 [8] TRÖBS, M., HEINZEL, G. Improved spectrum estimation from
digitized time series on a logarithmic frequency axis.
Measurement, 2006, vol. 39, no. 2, p. 120–129. DOI: 10.1016/j.measurement.2005.10.010
[9] ZAPLATA, F., KASAL, M. Using the Goertzel algorithm as a fil-ter. In Proceedings of the 24th International Conference
[10] ZAPLATA, F., KASAL, M. Software defined DCF77 receiver.
Radioengineering, 2013, vol. 22, no. 4, p. 1211–1217. ISSN: 1210-2512.
[11] DE JESUS, M. A., TEIXEIRA, M., VICENTE, L., RODRÍGUEZ,
Y. Nonuniform discrete short-time Fourier transform: A Goertzel filter bank versus a FIR filtering approach.In IEEE International Midwest Symposium on Circuits and Systems MWSCAS 2006. San Juan (Puerto Rico), 2006, vol. 2, p. 188–192. DOI: 10.1109/MWSCAS.2006.382241
[12] ZAPLATA, F., KASAL, M. SDR implementation for DCF77. In
Proceedings of the 23rd International Conference Radioelektronika
2013. Pardubice (Czech Republic), 2013, p. 340–345. DOI: 10.1109/RadioElek.2013.6530943
About the Authors ...
Filip ZAPLATA was born in Chrudim, Czech Republic in 1987. He received the M.Sc. degree in Electronics and Communications from the Brno University of Technology (BUT) in 2011. From 2011, he was a combined Ph.D.
stu-dent and simultaneously working as an R&D Engineer in Vesla s.r.o. company. Since 2012 he has been a full-time Ph.D. student at the Department of Radio Electronics, BUT. His research interests include digital signal pro-cessing algorithms for software defined radio and digital receiver technology.