Vibrational spectroscopy of the silicate mineral plumbotsumite
Pb
5
(OH)
10
Si
4
O
8
– An assessment of the molecular structure
Andrés López
a, Ray L. Frost
a,⇑, Ricardo Scholz
b, Zˇeljka Zˇigovecˇki Gobac
c, Yunfei Xi
a aSchool of Chemistry, Physics and Mechanical Engineering, Science and Engineering Faculty, Queensland University of Technology, GPO Box 2434, Brisbane, Queensland 4001, Australia
b
Geology Department, School of Mines, Federal University of Ouro Preto, Campus Morro do Cruzeiro, Ouro Preto, MG 35,400-00, Brazil
c
Institute of Mineralogy and Petrography, Department of Geology, Faculty of Science, University of Zagreb, Horvatovac 95, 10000 Zagreb, Croatia
h i g h l i g h t s
We have studied plumbotsumite, a rare lead silicate mineral of formula Pb5(OH)10Si4O8.
This study forms the first systematic study of plumbotsumite from the Bigadic deposits, Turkey.
Vibrational spectroscopy was used to assess the molecular structure of plumbotsumite as the structure is not known.
Evidence for the presence of water in the plumbotsumite structure was inferred from the infrared spectra.
a r t i c l e
i n f o
Article history:
Received 8 April 2013
Received in revised form 3 June 2013 Accepted 27 September 2013 Available online 7 October 2013
Keywords:
Plumbotsumite Molecular structure Raman spectroscopy Silicate
Infrared
a b s t r a c t
We have used scanning electron microscopy with energy dispersive X-ray analysis to determine the pre-cise formula of plumbotsumite, a rare lead silicate mineral of formula Pb5(OH)10Si4O8. This study forms the first systematic study of plumbotsumite from the Bigadic deposits, Turkey. Vibrational spectroscopy was used to assess the molecular structure of plumbotsumite as the structure is not known. The mineral is characterized by sharp Raman bands at 1047, 1055 and 1060 cm 1assigned to SiO stretching vibra-tional modes and sharp Raman bands at 673, 683 and 697 cm 1assigned to OSiO bending modes. The observation of multiple bands offers support for a layered structure with variable SiO3structural units. Little information may be obtained from the infrared spectra because of broad spectral profiles. Intense Raman bands at 3510, 3546 and 3620 cm 1are ascribed to OH stretching modes. Evidence for the pres-ence of water in the plumbotsumite structure was inferred from the infrared spectra.
Ó2013 Elsevier B.V. All rights reserved.
1. Introduction
Plumbotsumite is a rare lead silicate mineral of formula Pb5(OH)10Si4O8 [1]. The name is for the chemical composition (lead = PLUMBum) and the type locality (TSUMeb)[1].
Plumbotsumite is found as secondary mineral developed in the oxidation zone above complex sulfide ores, such as Cu–Pb–Zn min-eralization in Tsumeb mine, Namibia[1,2].
Despite the type locality in Tsumeb mine, other occurrences were reported in Mammoth-St. Anthony mine, Tiger, Pinal County, Arizona, USA[3], Blue Bell claims[4]and Otto Mountains[5]near Baker, San Bernardino County, California, USA. Plumbotsumite was also obtained as by-product during hydrothermal syntheses of Pb-zoisite and Pb-lawsonite[6].
Plumbotsumite shows importance in the mineral collectors market.
Plumbotsumite is an orthorhombic mineral [7,8] with a= 15.875(4), b= 9.261(3), c= 29.364(9) Å, space group C2221 andZ= 10[1]. Structure determination on the plumbotsumite is still unpublished[4]. A proposed new formula of plumbotsumite occurred Pb13[(CO3)6|Si10O27]3H2O [5], but without published
crystal structure determination. The mineral structure consists of undulating sheets of silicate tetrahedra between which are located Pb atoms and channels containing H2O (and Pb2+lone-pair elec-trons). The silicate sheets can be described as consisting of zigzag pyroxene-like (SiO3)nchains joined laterally into sheets with the unshared tetrahedral apices in successive chains pointed alter-nately up and down, a configuration also found in pentagonite[4]. Lead silicates in Mammoth-St. Anthony mine, Tiger, Pinal County, Arizona, USA are found in unusual oxidation zone assemblages of rare minerals[3]. In ‘‘normal’’ oxidation zone in Mammoth-St. Anthony mine primary sulfides were subjected to weathering, and, according to this process, secondary copper sulfides, oxides, carbonates, and silicates were developed [3]. Locally, above this ‘‘normal’’ oxidation zone, due to retention or
0022-2860/$ - see front matterÓ2013 Elsevier B.V. All rights reserved.
http://dx.doi.org/10.1016/j.molstruc.2013.09.055
⇑Corresponding author. Tel.: +61 7 3138 2407; fax: +61 7 3138 1804.
E-mail address:[email protected](R.L. Frost).
Contents lists available atScienceDirect
Journal of Molecular Structure
Off white plumbotsumite single crystals were obtained from the collection of the Geology Department of the Federal University of Ouro Preto, Minas Gerais, Brazil, with sample code SAB-090. The mineral originated from Pinal Co., Mammoth District, St. Anthony deposit, Arizona, USA[3]. The studied sample was gently crushed and the associated minerals were removed under a stereomicro-scope Leica MZ4.
2.2. Scanning electron microscopy (SEM)
Experiments and analyses involving electron microscopy were performed in the Center of Microscopy of the Universidade Federal de Minas Gerais, Belo Horizonte, Minas Gerais, Brazil (http:// www.microscopia.ufmg.br).
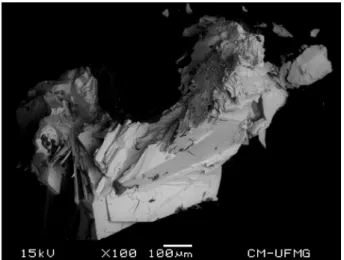
A fragment of a plumbotsumite crystal was placed in a carbon tape. The sample was analyses without coating to eliminate the presence of unwanted chemical elements. Secondary Electron and Backscattering Electron images were obtained using a JEOL JSM-6360LV equipment. Qualitative and semi-quantitative chemi-cal analyses in the EDS mode were performed with a ThermoNO-RAN spectrometer model Quest and was applied to support the mineral characterization. The EDS analysis was performed in a low vacuum condition.
2.3. Raman spectroscopy
Crystals of plumbotsumite were placed on a polished metal sur-face on the stage of an Olympus BHSM microscope, which is equipped with 10x, 20x, and 50x objectives. The microscope is part of a Renishaw 1000 Raman microscope system, which also includes a monochromator, a filter system and a CCD detector (1024 pixels). The Raman spectra were excited by a Spectra-Physics model 127 He–Ne laser producing highly polarized light at 633 nm and col-lected at a nominal resolution of 2 cm 1 and a precision of ±1 cm 1in the range between 200 and 4000 cm 1. Repeated acqui-sitions on the crystals using the highest magnification (50) were
accumulated to improve the signal to noise ratio of the spectra. Spectra were calibrated using the 520.5 cm 1line of a silicon wa-fer. The Raman spectrum of at least 10 crystals was collected to en-sure the consistency of the spectra.
2.4. Infrared spectroscopy
Infrared spectra were obtained using a Nicolet Nexus 870 FTIR spectrometer with a smart endurance single bounce diamond ATR cell. Spectra over the 4000–525 cm 1 range were obtained by the co-addition of 128 scans with a resolution of 4 cm 1and a mirror velocity of 0.6329 cm/s. Spectra were co-added to improve the signal to noise ratio.
3.1. Chemical characterization
The SEM/BSI image of the plumbotsumite crystal studied in this work is shown inFig. 1. The crystal shows a perfect cleavage. Qual-itative chemical analysis of plumbotsumite shows a Pb silicate and no other chemical elements are observed (Fig. 2). The crystal does not show chemical zonation and can be considered a single mineral phase and a type material.
3.2. Vibrational spectroscopy
The Raman spectrum of plumbotsumite over the 100– 4000 cm 1 spectral range is displayed in Fig. 3a. This spectrum shows the position and relative intensities of the Raman bands. It is obvious that there are large parts of the spectrum where no intensity is observed and therefore the spectrum is subdivided into sections based upon the type of vibration being examined. The infrared spectrum of plumbotsumite over the 500–4000 cm 1 spectral range is reported inFig. 3b. This figure shows the position and relative intensities of the infrared bands. Again, there are large parts of the spectrum where little or no intensity is observed. Hence, the spectrum is subdivided into subsections based upon the type of vibration being studied.
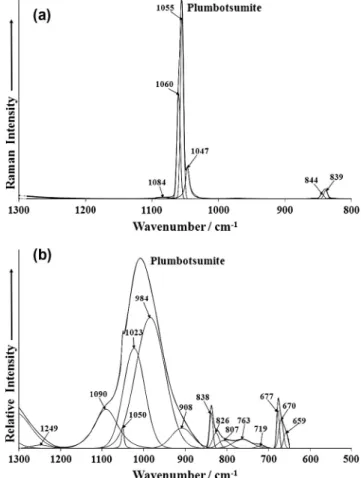
The Raman spectrum over the 800–1300 cm 1spectral range is illustrated inFig. 4a. Intense Raman bands are found at 1047, 1055 and 1060 cm 1. Raman bands of lower intensity are found at 839, 844 and 1084 cm 1. The three Raman bands at 1047, 1055 and 1060 cm 1 are assigned to the SiO stretching bands. The exact structure of plumbotsumite is unknown, however it is likely to be a layered type structure. The infrared spectrum of plumbotsumite
over the 500–1300 cm 1spectral range is reported inFig. 4b. Com-pared with the Raman spectrum, the infrared spectrum shows a broad spectral profile which may be resolved into component bands. Infrared bands are determined at 984, 1023, 1050 and 1090 cm 1. These bands are described as SiO stretching vibrations. According to Kampf et al.[4], plumbotsumite has a structure resem-bling pentagonite and its structurally related mineral cavansite Ca(V4+O)Si4O10
4H2O. The Raman spectrum of cavansite is
domi-nated by an intense band at 981 cm 1and pentagonite by a band at 971 cm 1attributed to the stretching vibrations of (SiO3)nunits. Cavansite is characterized by two intense bands at 574 and
672 cm 1whereas pentagonite by a single band at 651 cm 1, as-signed to OSiO bending vibrational modes.
If this is the case, then a comparison may be made with the apo-phyllite type silicate minerals. Dowty showed that the –SiO3units had a unique band position of 980 cm 1[11](seeFigs. 2 and 4of this reference). Dowty also showed that Si2O5units had a Raman peak at around 1100 cm 1. Apophyllite-(KF) consists of continuous sheets of Si2O6parallel to the 001 plane. The band at 1059 cm 1is assigned to the SiO stretching vibration of these Si2O6units. Adams et al.[12]reported the single crystal Raman spectrum of apophyl-lite. Adams and co-workers reported the factor group analysis of apophyllite. Based upon Adams[12]assignment this band is the A1gmode. It is predicted that there should be three A1g modes. However, only one is observed, perhaps because of accidental coin-cidence. Narayanan[13]collected the spectrum of an apophyllite mineral but did not assign any bands. Raman bands of significantly lower intensity are observed at 970, 1007, 1043, 1086 and 1114 cm 1. The Raman bands at 1043, 1086 and 1114 cm 1are as-signed to the A2umodes. Vierne and Brunel[14]published the sin-gle crystal infrared spectrum of apophyllite and found the two A2 modes, at 1048 and 1129 cm 1. The significance of this observation is that it shows that both the Si–O bridge and terminal bonds yield stretching wavenumbers at comparable positions.
The Raman spectra of plumbotsumite in the 300–800 cm 1and in the 100–300 cm 1are shown inFig. 5a and b. The first spectrum is dominated by an intense Raman band at 683 cm 1 with two shoulders at 673 and 697 cm 1. Dowty calculated the band posi-tion of these bending modes for different siloxane units[11]and demonstrated the band position of the bending modes for SiO3 units at around 650 cm 1. This calculated value is in harmony with Fig. 2.EDS analysis of plumbotsumite.
Fig. 3.(a) Raman spectrum of plumbotsumite (upper spectrum) over the 100– 4000 cm1 spectral range and (b) infrared spectrum of plumbotsumite (lower
spectrum) over the 500–4000 cm 1spectral range.
Fig. 4.(a) Raman spectrum of plumbotsumite (upper spectrum) in the 800– 1400 cm1 spectral range and (b) infrared spectrum of plumbotsumite (lower
the higher wavenumber band observed at 683 cm 1observed for plumbotsumite. A large number of low intensity bands are ob-served in Fig. 5a. These bands are found at 346, 396, 432, 458 and 481 cm 1. Other bands are observed at 581, 609, 636, 729 and 772 cm 1.
Strong Raman bands are discovered in the 100–300 cm 1 spec-tral range. Intense Raman bands are found at 143, 154 and 179 cm 1. Other medium intensity bands are found at 103 and 107 cm 1 and bands of lower intensity are found at 227, 246, 280 and 248 cm 1. Strong Raman bands were also reported by Adams et al.[12]in the single crystal Raman spectrum of apophyl-lite in this spectral region. Adams et al. showed the orientation dependence of the spectra. Bands in these positions are due to framework vibrations and probably also involve water. The intense band at 143 cm 1of plumbotsumite may involve hydrogen bond-ing of water. However, until the Raman spectrum of deuterated plumbotsumite is measured, then no firm conclusions can be made.
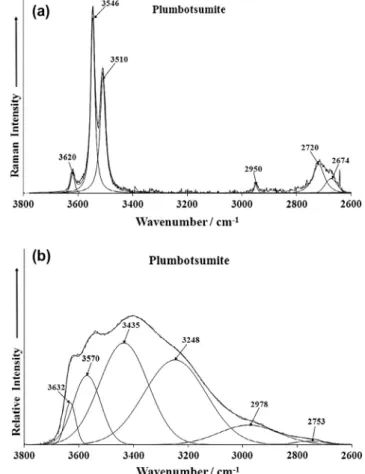
The Raman and infrared spectra of plumbotsumite in the 2600– 3800 cm 1 spectral range is shown inFig. 6a and b. The Raman spectrum shows three bands at 3510, 3546 and 3620 cm 1. These Raman bands are assigned to the stretching vibrations of the OH units in the plumbotsumite structure. The observations of multiple bands lead to the conclusion that the OH units in the structure of plumbotsumite are non-equivalent. No Raman bands that could be attributed to water stretching vibrations are observed in the Ra-man spectrum. In comparison, the infrared spectrum displays a broad spectral profile with a series of overlapping bands that may be curve resolved into component bands at 2978, 3248, 3435, 3570 and 3632 cm 1. The latter two bands are the infrared
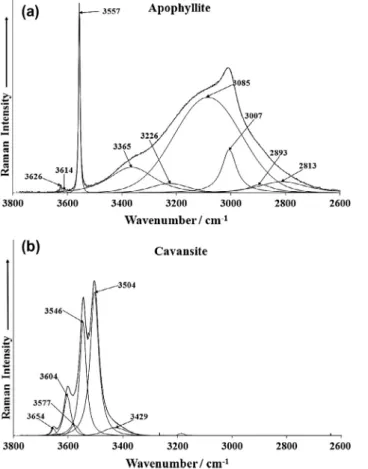
equivalent of the Raman bands at 3546 sand 3620 cm 1. The other infrared bands in this spectral region are assigned to water stretch-ing vibrations. The Raman spectrum of apophyllite and cavansite are reported inFig. 7. The Raman spectrum of cavansite in the hy-droxyl stretching region shows bands at 3504, 3546, 3577, 3604 and 3654 cm 1whereas pentagonite is a single band at 3532 cm 1. Overall two features are observed in the Raman spectrum of apophyllite, namely bands due to water stretching vibrations and hydroxyl stretching bands. It is noted that the hydroxyapophyllite Raman spectrum has two OH stretching bands. The Raman spec-trum of the apophyllite shows a complex set of bands which may be resolved into component bands at 2813, 2893, 3007, 3085 and 3365 cm 1. These bands are attributed to water stretching vibra-tions. Neutron diffraction studies have shown that water is hydro-gen bonded to the silicate framework structure[15]. In the model of Prince[15]approximately one-eighth of the water molecules are replaced by OH and the remaining protons bonded to fluoride to form HF molecules. Both OH and H20 are hydrogen bonded to the silicate framework. Bartl and Pfeifer[16]presented a model of apo-phyllite in which some hydroxyl units are replaced by fluoride ions. This model seems more appropriate as the sizes of F and OH ions are very close. There are many examples in nature where in minerals the OH units are either completely or partially re-placed by F ions.
The Raman and infrared spectrum in the 1300–1800 cm 1 spec-tral region are reported in Fig. 8a and b. The Raman spectrum shows low intensity bands at 1685, 1709, 1716, 1732 and 1744 cm 1 which are attributed to OH deformation modes. No water bending modes were observed in the Raman spectrum. In-tense Raman bands are observed at 1379, 1424 and 1479 cm 1. Fig. 5.(a) Raman spectrum of plumbotsumite (upper spectrum) in the 300–
800 cm1 spectral range and (b) Raman spectrum of plumbotsumite (lower
spectrum) in the 100–300 cm 1spectral range.
Fig. 6.(a) Raman spectrum of plumbotsumite (upper spectrum) in the 2600– 4000 cm 1spectral range and (b) infrared spectrum of plumbotsumite (lower
These bands are attributed to the SiO antisymmetric stretching vibrations. These bands are observed as broad bands in the infrared spectrum with resolved bands at 1312, 1389, 1435 and 1462 cm 1. Infrared bands are observed at 1626 and 1646 cm 1 and are as-signed to the water bending modes. The two infrared bands at 1728 and 1741 cm 1 are attributed to hydroxyl deformation modes.
4. Conclusions
We have undertaken a study of the silicate mineral plumbotsu-mite, of formula Pb5(OH)10Si4O8using a combination of SEM with EDX and a combination of Raman and infrared spectroscopy. EDX analysis shows the mineral to be pure with no extraneous ele-ments. The structure consists of undulating sheets of silicate tetra-hedra between which are located Pb atoms and channels containing H2O (and Pb2+ lone-pair electrons) [1]. The silicate sheets can be described as consisting of zigzag pyroxene-like (SiO3)nchains joined laterally into sheets with the unshared tetra-hedral apices in successive chains pointed alternately up and down [1], a configuration also found in pentagonite.
The structure of plumbotsumite was assessed using a combina-tion of Raman and infrared spectroscopy. The mineral is character-ized by sharp Raman bands at 1047, 1055 and 1060 cm 1assigned to SiO stretching vibrational modes and sharp Raman bands at 673, 683 and 697 cm 1assigned to OSiO bending modes. The observa-tion of multiple bands offers support for a layered structure with variable SiO3 structural units. Intense Raman bands at 3510, 3546 and 3620 cm 1 are ascribed to OH stretching modes.
Evidence for the presence of water in the plumbotsumite structure was inferred from the infrared spectra.
Acknowledgments
The financial and infra-structure support of the Queensland University of Technology, Chemistry discipline is gratefully acknowledged. The Australian Research Council (ARC) is thanked for funding the instrumentation. The authors would like to acknowledge the Center of Microscopy at the Universidade Federal de Minas Gerais (http://www.microscopia.ufmg.br) for providing the equipment and technical support for experiments involving electron microscopy. R. Scholz thanks to CNPq – Conselho Nacional de Desenvolvimento Científico e Tecnológico (Grant No. 306287/ 2012-9). Zˇ. Zˇigovecˇki Gobac thanks to Ministry of Science, Educa-tion and Sports of the Republic of Croatia, under Grant No. 119-0000000-1158.
References
[1]P. Keller, P.J. Dunn, Chemie der Erde 41 (1982) 1–6.
[2]M. Fleischer, I.J. Cabri, G.Y. Chao, J.A. Mandarino, A. Pabst, Am. Mineral. 67 (1982) 1075–1076.
[3]J.W. Anthony, S.A. Williams, R.A. Bideaux, R.W. Grant, Mineralogy of Arizona, third ed., University of Arizona Press, Tuscon, 1995.
[4]A.R. Kampf, G.R. Rossman, R.M. Housley, Am. Mineral. 94 (2009) 1198–1204. [5]J. Marty, A.R. Kampf, R.M. Housley, S.J. Mills, S. Weiß, Lapis 35 (2010) 42–51. [6]G. Dorsam, A. Liebscher, B. Wunder, G. Franz, M. Gottschalk, Neues Jahrbuch
fuer Mineralogie, Abhandlungen 188 (2011) 99–110.
[7]D.M.C. Huminicki, F.C. Hawthorne, Can. Mineral. 38 (2000) 1425–1432. [8]M. Mrose, D.E. Appleman, Zeitschrift fuer Kristallographie, Kristallgeometrie,
Kristallphysik, Kristallchemie 117 (1962) 16–36.
Fig. 7.(a) Raman spectrum of apophyllite (upper spectrum) in the 2600–4000 cm1
spectral range and (b) Raman spectrum of cavansite (upper spectrum) in the 2600– 4000 cm1spectral range.
Fig. 8.(a) Raman spectrum of plumbotsumite (upper spectrum) in the 1400– 2000 cm1 spectral range and (b) infrared spectrum of plumbotsumite (lower