MARCO AURÉLIO LIMA DE QUEIROZ
Agent Based Modeling Simulations of Firms in Search of Economic Performance.
SÃO PAULO
MARCO AURÉLIO LIMA DE QUEIROZ
Agent Based Modeling Simulations of Firms in Search of Economic Performance.
Tese apresentada à Fundação Getúlio Vargas – Escola de Administração de Empresas de São Paulo como requerimento para obtenção do título de doutor em administração de empresas
Campo de conhecimento: Estratégia Empresarial
Queiroz, Marco Aurélio Lima de.
Business Competition Dynamics: Agent Based Modeling Simulations of Firms in Search of Economic Performance / Marco Aurélio Lima de Queiroz. 2010. 302 f.
Orientador: Flávio Carvalho de Vasconcelos
Tese (doutorado) Escola de Administração de Empresas de São Paulo. 1. Concorrência. 2. Planejamento estratégico. 3. Desempenho Avaliação. 4. Administração de empresas – Simulação por computador. I. Vasconcelos, Flávio Carvalho. II. Tese (doutorado) Escola de Administração de Empresas de São Paulo. III. Título.
MARCO AURÉLIO LIMA DE QUEIROZ
Agent Based Modeling Simulations of Firms in Search of Economic Performance.
Tese apresentada à Fundação Getúlio Vargas – Escola de Administração de Empresas de São Paulo como requerimento para obtenção do título de doutor em administração de empresas
Campo de conhecimento: Estratégia Empresarial
!
____________________________________ Prof. Dr. Flávio C. de Vasconcelos (orientador) FGV EAESP
_____________________________________ Prof. Dr. Rogério Sobreira Bezerra
FGV EBAPE
_____________________________________ Prof. Dr. Alexandre Linhares
FGV EBAPE
_____________________________________ Prof. Dr. Júlio César Bastos de Figueiredo FGV EAESP
_____________________________________ Prof. Dr. Edmilson Alves de Moraes
" #$ %
Jacques Zetune helped me turn the model specification into reality. My gratitude goes much beyond recognizing the value of his outstanding system development skills.
His commitment and enthusiasm while performing this job contributed to make me more confident about the project and its potential outcomes. By doing so, he influenced me to enlarge the initial scope of work. Several features and functionalities would not have been created if he would not be involved.
In several aspects, this work is also yours, dear friend. Thank you!
Jorge Luis Borges
&
A intenção deste trabalho é explorar dinâmicas de competição por meio de “simulação baseada em agentes”. Apoiando se em um crescente número de estudos no campo da estratégia e teoria das organizações que utilizam métodos de simulação, desenvolveu se um modelo computacional para simular situações de competição entre empresas e observar a eficiência relativa dos métodos de busca de melhoria de desempenho teorizados. O estudo também explora possíveis explicações para a persistência de desempenho superior ou inferior das empresas, associados às condições de vantagem ou desvantagem competitiva.
Cada execução de simulação começa com a inicialização da “paisagem de adequação”, que define o nível de desempenho a ser atribuído para cada possível configuração (de recursos e capacidades) que as empresas venham a adotar. Há dois modelos diferentes de paisagem de adequação disponíveis para simulação, sendo um parecido com o proposto por Kauffman, frequentemente citado e adotado por outros autores, e outro desenhado no âmbito deste trabalho, que possibilita simular mudanças de mercado (na paisagem de adequação), de natureza exógena ou endógena (em função das estratégias adotadas pelas empresas), ambas além do entendimento ou controle das empresas.
A inicialização da simulação computacional inclui também a geração aleatória de um conjunto de empresas com diferentes atributos e estados iniciais (configurações de recursos e capacidades), dentro dos parâmetros de simulação solicitados. Durante a execução da simulação, cada firma busca alcançar níveis mais elevados de desempenho, utilizando métodos (ou rotinas organizacionais) que representam, até certo ponto, os mecanismos de diferenciação e isomorfismo descritos nos campos de conhecimento da estratégia empresarial e da teoria das organizações. O modelo simula a busca por desempenho que se realiza sob condições de racionalidade limitada, informação incompleta e incerteza.
O estudo explora o comportamento das diversas variáveis representadas pelo modelo em uma variedade de cenários; apresentam se os resultados destas simulações, discutidos à luz do que se esperaria baseado na teoria e evidências empíricas reportadas em outros trabalhos.
• Os métodos de busca fazem diferença, contudo, a eficiência do método depende
significativamente do contexto e, principalmente, deve se às características, métodos de busca e escolhas realizadas pelas outras empresas com as quais uma dada empresa se relaciona;
• A persistência do desempenho superior não pode ser explicada pelos atributos
individuais das firmas, neste modelo representados por sua amplitude de visão e sua capacidade de ajuste. Ao invés disto, ela é explicada pela estratégia de busca adotada, conjugada com o desdobramento das interações com outras empresas e as escolhas por estas realizadas, em situações idiossincráticas e de dependência de trajeto.
Embora os resultados deste estudo ainda requeiram validação empírica, as implicações para a prática gerencial parecem relevantes: a vantagem competitiva não é uma questão somente de posicionamento ou recursos internos da firma. Em um ambiente de constantes mudanças, com informação incompleta e incerteza, ela depende de sorte, e para além dela, do modo como as interações com outras firmas se desdobram, possibilitando que a empresa consiga sustentar um nível elevado de desempenho. Empresas que empregam estratégias de mimetismo devem buscar constantemente novas conexões para obtenção de informação sobre práticas a serem adotadas.
$ '& ( ) '
&
The intent of this work is to explore dynamics of business competition through agent based modeling simulations of firms searching for performance in markets configured as fitness landscapes. Building upon a growing number of studies in management science that utilizes simulation methods and analogies to Kauffman´s model of biological evolution, we developed a computer model to emulate competition and observe whether different search methods matter, under varied conditions. This study also explores potential explanations for the persistence of above and below average performances of firms under competition.
Each simulation run starts with the initialization of a fitness landscape, which defines the fitness level for each possible firm configuration. There are two different landscape models available for simulation, one that resembles the NK model proposed by Kauffman and the other, custom developed under the scope of this project, in which we built additional functionality in order to explore potential consequences of market changes over time, due to exogenous or endogenous factors, both beyond the control of the competing firms
Next, our computer application generates a set of firms with heterogeneous attributes and initial states (or configurations for their business models), randomly assigned according to the chosen simulation parameters.
During a simulation run, each firm searches for higher levels of fitness utilizing the search methods (or organizational routines) that were designed to represent, at some extent, the isomorphic and differentiation mechanisms described by the business strategy and organizational theory literatures. The model simulates the search for performance that operates under bounded rationality, dealing with incomplete information and uncertainty.
The study examined several hypotheses through a series of simulation runs; we present the simulation outcomes obtained and discuss them in relation to what we would have expected based on theory and reported evidences from other studies in the field.
attributes such as vision and capacity to adjust; instead, it is due to both the search strategy adopted and the unfolding of interactions with other firms and the choices they made, in idiosyncratic and path dependence situations.
Although the outcomes of this study require empirical validation, the implications to management practice seem relevant: competitive advantage is not solely a matter of positioning neither of firm resources; it depends on the way unfolding interactions with other firms allow a company to continuously match environmental demands. Companies that rely on mimetism strategies must constantly renew and expand their information sources of recommended practices (resource configurations) in order to avoid informational traps that may lead to poor performance.
" # &
) & * + % & +&
Chart 1 Boxplot of fitness mean by search method. Simulations 57, 58 and 59 ... 63
Chart 2 Boxplot of fitness mean by search method. Simulations 60, 61 and 62 ... 64
Chart 3 Boxplot of fitness mean by search method. Simulations 58, 61 and 63 ... 65
Chart 4 Graphical summary of statistics: fitness mean. Simulation 57, all runs ... 66
Chart 5 Graphical summary of statistics: fitness mean. Simulation 60, all runs ... 66
Chart 6 Graphical summary of statistics: fitness mean. Simulation 62, all runs ... 67
Chart 7 Evolution of fitness by search method. Simulation 60, run 3 ... 68
Chart 8 Evolution of fitness by search method. Simulation 60, run 4 ... 68
Chart 9 Evolution of fitness by search method. Simulation 60, run 6 ... 69
Chart 10 Evolution of fitness by search method. Simulation 61, run 3 ... 69
Chart 11 Evolution of fitness by search method. Simulation 61, run 7 ... 70
Chart 12 Boxplot of fitness mean by search method. Simulations 63 and 74 ... 71
Chart 13 Boxplot of fitness mean by search method. Simulation 61 and 88 ... 72
Chart 14 Graphical summary of statistics: fitness mean. Simulation 88, all runs ... 73
Chart 15 Graphical summary of statistics: fitness mean. Simulation 88, all runs – Majority mimetism ... 73
Chart 16 Graphical summary of statistics: fitness mean. Simulation 88, all runs – Minority mimetism ... 74
Chart 17 Graphical summary of statistics: fitness mean. Simulation 88, all runs – Random searching ... 74
Chart 18 Graphical summary of statistics: fitness mean. Simulation 88, all runs – Market reading ... 75
Chart 19 Evolution of fitness by search method. Simulation 88, run 6 ... 75
Chart 20 Evolution of fitness by search method. Simulation 88, run 9 ... 76
Chart 21 Evolution of fitness by search method. Simulation 88, run 10 ... 76
Chart 22 Evolution of fitness by search method. Simulation 66, run 1 ... 78
Chart 23 Evolution of fitness by search method. Simulation 66, run 6 ... 79
Chart 25 Boxplot of fitness mean. Simulations 74 and 75 ... 80
Chart 26 Boxplot of fitness mean. Simulations 81 and 82 ... 81
Chart 27 Evolution of fitness by search method. Simulation 81,run 3 ... 82
Chart 28 Evolution of fitness by search method. Simulation 81,run 4 ... 82
Chart 29 Evolution of fitness by search method. Simulation 82,run 3 ... 83
Chart 30 Evolution of fitness by search method. Simulation 82,run 5 ... 83
Chart 31 Graphical summary of statistics: fitness mean. Simulation 81, all runs ... 84
Chart 32 Graphical summary of statistics: fitness mean. Simulation 82, all runs ... 84
Chart 33 Boxplot of fitness mean by search method. Simulations 63 and 67 ... 85
Chart 34 Boxplot of fitness mean by search method. Simulations 61, 68 and 71 ... 86
Chart 35 Evolution of fitness by search method. Simulation 68, run 3 ... 87
Chart 36 Evolution of fitness by search method. Simulation 68, run 5 ... 88
Chart 37 Evolution of fitness by search method. Simulation 68, run 9 ... 88
Chart 38 Boxplot of fitness mean by search method. Simulations 61 and 73 ... 89
Chart 39 Graphical summary of statistics: fitness mean. Simulation 73, all runs – Minority mimetism ... 90
Chart 40 Graphical summary of statistics: fitness mean. Simulation 73, all runs – Market reading ... 90
Chart 41 Boxplot of fitness mean by search method. Simulations 63 and 74 ... 91
Chart 42 Boxplot of fitness mean by search method. Simulations 65 and 75 ... 91
Chart 43 Boxplot of fitness mean by search method. Simulations 79, 80 and 81 ... 92
Chart 44 Evolution of fitness by search method. Simulation 79, run 2 ... 93
Chart 45 Evolution of fitness by search method. Simulation 79, run 10 ... 93
Chart 46 Evolution of fitness by search method. Simulation 80, run 1 ... 94
Chart 47 Evolution of fitness by search method. Simulation 80, run 4 ... 94
Chart 48 Evolution of fitness by search method. Simulation 81, run 9 ... 95
Chart 49 Evolution of fitness by search method. Simulation 81, run 10 ... 95
Chart 50 Boxplot of fitness mean by search method. Simulations 69, 70 and 91 ... 96
Chart 51 Graphical summary of statistics: fitness mean. Simulation 70, all runs ... 97
Chart 53 Graphical summary of statistics: fitness mean. Simulation 70, all runs – Minority
mimetism ... 98
Chart 54 Graphical summary of statistics: fitness mean. Simulation 70, all runs – Random search ... 98
Chart 55 Graphical summary of statistics: fitness mean. Simulation 70, all runs – Market reading ... 99
Chart 56 Evolution of fitness by search method. Simulation 70, run 7 ... 100
Chart 57 Evolution of fitness by search method. Simulation 70, run 9 ... 100
Chart 58 Graphical summary of statistics: fitness mean. Simulation 91, all runs ... 101
Chart 59 Graphical summary of statistics: fitness mean. Simulation 91, all runs – Majority mimetism ... 102
Chart 60 Graphical summary of statistics: fitness mean. Simulation 91, all runs – Minority mimetism ... 102
Chart 61 Graphical summary of statistics: fitness mean. Simulation 91, all runs – Random search ... 103
Chart 62 Evolution of fitness by search method. Simulation 91, run 1 ... 103
Chart 63 Evolution of fitness by search method. Simulation 91, run 6 ... 104
Chart 64 Evolution of fitness by search method. Simulation 91, run 8 ... 104
Chart 65 Boxplot of fitness mean by search method. Simulations 63 and 90 ... 105
Chart 66 Boxplot of fitness mean by search method. Simulations 88 and 89 ... 106
Chart 67 Histogram of firm´s wins by search method. Simulation 57, all runs ... 110
Chart 68 Histogram of firm´s wins by search method. Simulation 60, all runs ... 110
Chart 69 Histogram of firm´s wins by search method. Simulation 62, all runs ... 111
Chart 70 Dotplot of firm´s wins by search method. Simulations 57, 58 and 59 ... 112
Chart 71 Dotplot of firm´s wins by search method. Simulations 60, 61 and 62 ... 113
Chart 72 Classification of firms according to fitness performance, by search method. Simulation 61, all runs ... 116
Chart 73 Classification of firms according to fitness performance, by search method. Simulation 88, all runs ... 116
Chart 74 Boxplot of fitness mean by search method. Simulations 61 and 76 ... 117
Chart 76 Histogram of Vision, by run. Simulation 76 ... 118 Chart 77 Classification of firms according to fitness performance, by search method. Simulation 76, all runs, 1 STD DEV ... 119 Chart 78 Classification of firms according to fitness performance, by search method. Simulation 76, all runs, 1.96 STD DEV ... 119 Chart 79 Histogram of above average firms by Vision attribute value. Simulation 76, all runs . 120 Chart 80 Boxplot of fitness mean by Vision attribute value. Simulation 76, all runs – Majority mimetism ... 121 Chart 81 Boxplot of fitness mean by Vision attribute value. Simulation 76, all runs – Minority mimetism ... 121 Chart 82 Histogram of Vision, by run. Simulation 77 ... 123 Chart 83 Histogram of AdjustCap. Simulation 77, all runs consolidated ... 123 Chart 84 Boxplot of fitness mean by Vision value. Simulation 77, all runs – Majority mimetism ... 124 Chart 85 Boxplot of fitness mean by Vision value. Simulation 77, all runs – Minority mimetism ... 124 Chart 86 Boxplot of fitness mean by AdjustCap value. Simulation 77, all runs – Majority
mimetism ... 125 Chart 87 Boxplot of fitness mean by AdjustCap value. Simulation 77, all runs – Minority
Chart 94 Classification of firms according to fitness performance, by search method. Simulation
84, all runs, 1.96 STD DEV ... 130
Chart 95 Boxplot of fitness mean by AdjustCap value. Simulation 84, all runs ... 131
Chart 96 Boxplot of fitness mean by Vision value. Simulation 84, all runs – Majority mimetism ... 131
Chart 97 Boxplot of fitness mean by Vision value. Simulation 84, all runs – Minority mimetism ... 132
Chart 98 Capacity to adjust of above and below averagers. Simulation 78, all runs, 1 STD DEV ... 136
Chart 99 Vision of above and below average performers. Simulation 78, all runs, 1 STD DEV 137 Chart 100 Vision of above and below average performers. Simulation 78, all runs, 1,96 STD DEV ... 137
Figure 1 Intellectual structure of strategic management research: 1994 2000 ... 8
Figure 2 Mapping of Strategy Research ... 9
Figure 3 Original fitness landscape representation ... 13
Figure 4 Methodology for the development of this work ... 20
Figure 5 Variables and relationships built into the model. ... 21
Figure 6 Variables and relationships adjusted for the NK model ... 30
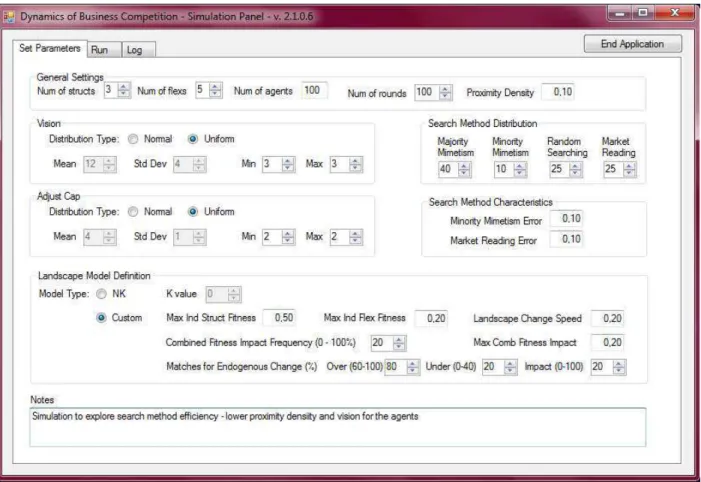
Figure 7 Simulation panel – Set parameters screen ... 38
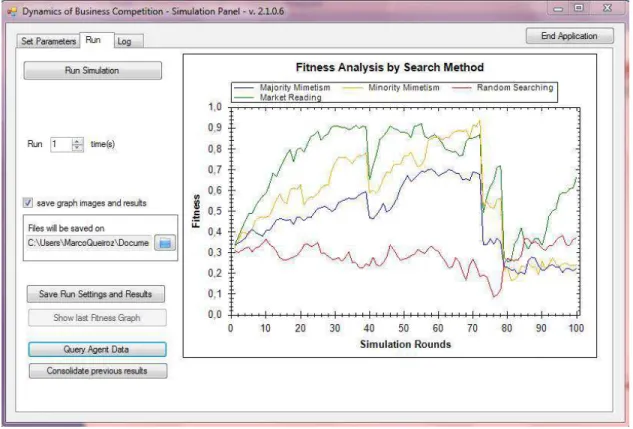
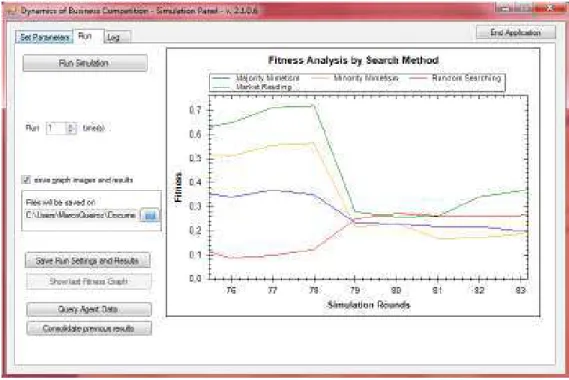
Figure 8 Simulation panel – Run screen ... 40
Figure 9 Simulation panel – Run screen (after the execution of a simulation run) ... 42
Figure 10 Simulation panel – Run screen (zoom applied to a simulation run)... 43
Figure 11 Query Agent Data Form – Information on specific agent and round ... 44
Figure 12 Query Agent Data Form – Information on specific agent and round (after scrolling) .. 45
Figure 13 Consolidate previous results – data import function ... 46
$
Table 1 Final test plan – Settings for simulations 57 to 62 ... 54
Table 2 Final test plan – Settings for simulations 63 to 68 ... 55
Table 3 Final test plan – Settings for simulations 69 to 72 ... 56
Table 4 Final test plan – Settings for simulations 73 to 78 ... 57
Table 5 Final test plan – Settings for simulations 79 to 84 ... 58
Table 6 Final test plan – Settings for simulations 85, 88 to 91 ... 59
Table 7 Classification of firms according to fitness performance , by search method ... 114
Table 8 Classification of firms according to fitness performance , by search method ... 133
1. INTRODUCTION ... 1
1.1.Context, foundations and settings of this work ... 1
1.2.Research objectives and potential contributions ... 3
2. THEORETICAL FRAMEWORK ... 5
2.1.Business strategy and competitive advantage ... 5
2.2.Competition as a dynamic process of search for economic performance ... 7
2.3.Markets and organizations as evolving, complex systems of adaptive agents ... 10
2.4.Adaptive agents in a fitness landscape: the NK model ... 13
2.5.The analogy of fitness landscapes within management science ... 14
2.6.Theories about the search mechanisms employed by firms ... 16
2.7.Persistence of above average and below average performance ... 17
3. METHODOLOGY ... 19
3.1.Methodology for the use of simulation methods ... 19
3.2.Specifying the variables and relationships to be modeled ... 21
3.3.On the research design and its limitations ... 32
4. DESIGN AND CONSTRUCTION OF THE MODEL ... 37
4.1.Platform for the development of the model ... 37
4.2.Model overview and high level application flow ... 38
5. PLAN AND EXECUTION OF EXPERIMENTS ... 51
5.1.Initial hypotheses and the planning of experiments ... 51
5.2.About the efficiency of the search methods ... 61
5.2.1. The effects of ProximityDensity and Vision ... 63
5.2.2. The effect of AdjustCap ... 71
5.2.3. The effect of search method population distribution ... 77
5.2.4. The effects of procedural accuracy in the execution of the search methods ... 85
5.2.5. Landscape complexity and its impact in search method performance ... 89
5.2.6. Effects of landscape exogenous changes ... 96
5.2.7. Effects of landscape endogenous changes ... 105
5.3.About the persistence of above and below average performances ... 107
5.3.1. The effects of ProximityDensity and Vision at the population level ... 109
5.3.2. The effect of changes to AdjustCap at the population level ... 115
5.3.3. The effect of distinct values for the Vision attribute ... 117
5.3.4. The effect of distinct values for the Vision and AdjustCap attributes ... 122
5.3.5. The effect of search method population distribution ... 133
5.3.6. Landscape complexity and its impact on individual fitness performance ... 134
6. CONCLUSION AND FUTURE DIRECTIONS ... 141
6.1.Closing our initial research agenda: the hypotheses ... 141
6.2.Competitive advantage and idiosyncrasy of unfolding interactions ... 143
APPENDIX ... 146
I) DOCUMENTATION OF THE AGENT BASED MODELING SYSTEM ... 146
Overall application flow ... 148
Model specification ... 148
Overview of Tables and their relationships ... 153
The agents (or firms) ... 153
Search Methods ... 155
The landscape and parameters for the simulation ... 156
Results and settings of recorded simulation executions ... 159
Detailed definitions of the Tables ... 161
II) SIMULATION RESULTS ... 194
Evolution of fitness (by search method), all simulation executions ... 195
Descriptive statistics of all simulation executions ... 196
,- &
,-,- * . / ! 0 0 ! 10 . 2!0 3 4
The dynamics of business competition is central to the field of business strategy. Economics and organizational theories provide various competing explanations for the search mechanisms employed by firms in their struggle to survive, to solve their perceived problems and/or to pursue superior performance against others. For the strategy field, special interest relies in the understanding of why some firms consistently outperform others (Barney & Hesterly, 2006; Besanko, Dranove, Shanley, & Schaefer, 2004; Rumelt, Schendel, & Teece, 1991).
It is not a consensus that firms intentionally seek to outperform others, neither that firms have an orchestrated and sound search strategy employed by their management teams. In spite of the organizational goal and deliberateness nature of the strategy process, however, research in organizational theory describes to a high extent the search mechanisms that would account for the perceived, emerging patterns of action resulting from organizational micro dynamics as management attempt to solve problems and improve performance (Cyert & March, 1992; Simon, 1964). Although the mechanisms (or organizational routines) most frequently reflect complex social and historical conditions, such as previous experience, path dependencies, group beliefs and learning processes, they are persistent as to provide plausible explanations for the differences in firms´ performance (Cyert & March, 1992; Nelson & Winter, 1982). The interest of the present study relies on further exploring this argument.
micro dynamics in continuous interaction with the environment. There is a growing number of scholars that consider markets and organizations as complex adaptive systems (Holland & Miller, 1991; Macy & Willer, 2002; Markose, 2005; Mitleton Kelly, 2003; Morel & Ramanujam, 1999); on the same trend, the portrait of the strategy process turns to be one of a complex, adaptive, emergent pattern, resulting from organizational dynamics (Brown & Eisenhardt, 1998; Mintzberg, Lampel, Quinn, & Ghoshal, 2003; Teece, Pisano, & Shuen, 1997; Whittington, 2001). The attractiveness of the analogy and the use of such a model are thus justifiable.
The central argument here remains the same one stated by evolutionary economics long ago (Alchian, 1950; Nelson & Winter, 1982; Nelson, Winter, & Schuette, 1976): firms evolve over time (variation), adopting characteristics that provide or are supposed to provide better response to market demands (selection and retention). It is worth recognizing that such an “evolutionary account” is also widespread in the fields of organization theory (Aldrich, 1999; Carroll, 1997; Carroll & Harrison, 1994; Hannan & Freeman, 1977, 1984) and strategic management (Augier & Teece, 2009; Barnett & Burgelman, 1996; Lovas & Ghoshal, 2000; Schendel, 1996). The difference resides both in the way of exploring how variation, selection and retention processes work out and in the creation of higher level order out of these micro dynamics (Holland, 1998; Levinthal & Warglien, 1999; McKelvey, 1999b).
The current work relies on the evolutionary account, making use of the complex adaptive systems theory previously developed in the field of business strategy and adopting the theorized search mechanisms as the evolutionary engine that could provide possible explanations for why firms differ in their performance over a period in time. In order to develop such an endeavor, we have designed and built a customized platform, namely, an agent based modeling system. This research method enables exploration and theoretical developments, while having relevant limitations that must be constantly assessed (Davis, Eisenhardt, & Bingham, 2007; Epstein & Axtell, 1996; Gilbert, 2008; Holland, 1998; Miller & Page, 2007; Prietula, Carley, & Gasser, 1998). The advice of more experienced researchers is considered as a guide:
,-5- & 0 2 67 ! 0 ! 8 !6/ ! 0
As previously mentioned, this study has the intent of exploring issues related to the dynamics of business competition through the design and run of an agent based modeling (ABM) system. While agent based modeling allows open ended explorations, we resisted the temptation
to become what Macy and Willer call (2002, p.
162), and tried to “ride” into a more restricted and somewhat disciplined experimental design. The model design and development considered the computer simulations implemented in several other studies in the fields of business strategy, management science and organizational theory. We validated the model outcomes according to existing theory in the field, but few empirical evidences where available. Some of the findings presented later provide interesting theoretical contributions to the field of business strategy, fostering additional empirical studies.
The subject of interest of this study involves the efficiency of search methods employed by firms in their struggle for better performance, under a variety of conditions such as industry stability, complexity of the business operations, availability of information about other firms´ choices etc.
Through the simulation method we investigated possible explanations for the persistence of above average and below average performance in hypothetical populations of firms.
Our research agenda had the following research questions1:
I. About the search methods employed by the firms as modeled in the application: a. Is there a search method that explains why some firms outperform the others? b. What is the impact of high changing market conditions on the relative efficiency
of the search methods (observed in a.)?
1
II. About the persistence of above and below average performers, and the existence of outliers:
5- ) & $ +& # &"
Initially we established the foundations for our project by reviewing the strategic management field, bringing selected discussions about competitive advantage. We characterize competition as the search for economic performance, supported by a large literature on both evolutionary economics and organizational theory.
Then we explored the argument that markets and organizations are complex systems, whose behaviors, as observed through macro level lens, result from micro dynamics operating at a lower level. The organizational routines, in this case, search processes, would represent such aggregated behavior at the firm level and provide an arguable account for firm performance. The performance of the simulated sets of firms would support the discussion of the efficiency of different search strategies under varied conditions, and provide potential explanations for the persistence of above average and below average performance among competing firms.
Next, we explained why and under which boundaries and limitations we modeled the search processes of firms in analogy to Kauffman´s model of biological search, as did many other researchers in various recent works that address adaptation processes and strategic decisions.
Finally, a brief review of the current debate about the search mechanisms employed by firms and about the persistence of abnormal returns furnished the necessary context for situating our research questions within the strategic management field.
5-,- /0! 00 0 19 ! ! 1
strategy provide a robust orientation for the conduct of firms (Besanko, et al., 2004; Rumelt, et al., 1991).
The construct competitive advantage, however, is arguably problematic if defined simply as superior economic performance (Arend, 2003; Durand, 2002; Powell, 2001, 2003a; Powell & Lloyd, 2005); the present study´s perspective relies on the proposition that competitive advantage can be seen as both component of and resultant of superior performance, as suggested by Vasconcelos and Brito (2004). Thus, the proposed dynamics of business competition consider the following logic: firms adopt strategies and implement changes in their configurations (set of characteristics); the performance for each firm reflects such configurations; as we look for firms with superior performance, namely the “resultant competitive advantage”, we will find those firms with “component competitive advantages”. It is worth mentioning that the conception of our model makes hard to trace how component advantages affect resultant competitive advantage (see the section design and construction of the model for more details on it).
Some authors discuss whether one should consider above average performance as simple heuristics and persistent competitive advantage associated only with outliers (Alchian, 1950; Powell, 2003b; Wiggins & Ruefli, 2002), with market mechanisms that would make firms with abnormal returns to converge towards the mean in the long term (Jacobsen, 1988). We expect to shed new light on these issues as we run our model and analyze hypothetical populations of firms.
The present study addresses another relevant theoretical issue, which is the discussion on the sources of competitive advantage. Extensive literature about superior economic performance of a firm associates it with the exploitation of market failures, whether through:
• derived from privileged positioning (imperfect products market)
as posed by Industrial Organization theory “IO” (Bain, 1956; Richard E. Caves, 1980; R. E. Caves & Porter, 1977; Porter, 1985);
• ! derived from individual firms' resources and competences
• " , in a world of innovation based competition (temporary only
imperfect markets), which builds upon the work of Schumpeter (1934). The so called Dynamic Capabilities (“DC”) and other related theoretical approaches to firms´ capabilities such as “Knowledge based view of the firm or absorptive capacity (Amit & Schoemaker, 1993; W. M. Cohen & Levinthal, 1990; Dierickx & Cool, 1989a, 1989b; Eisenhardt & Martin, 2000; Grant, 1996; Knott, 2003; Kogut & Zander, 1992; E. T. Penrose, 1959; Teece, et al., 1997).
The design of our model took these competing theories into account. The final model simulates business dynamics that better reflect the Dynamic Capabilities account (Eisenhardt & Martin, 2000; Nelson, 1991; Winter, 2003), as we based much of our definitions in several works following the traditions set by A behaviorial of the firm (Cyert & March, 1992) and the theory of evolutionary economics (Nelson & Winter, 1982).
5-5- ! ! 0 9 ! 00 . 0 2 . ! .
The pursuit of competitive advantage is recognized by its dynamic character, although the authors provide many different arguments to explain how firms achieve superior performance: through continuous work to yield differentiated fit (Porter, 1996); because of luck or foresight to accumulate resources (Dierickx & Cool, 1989a, 1989b); due to the dynamic capabilities (Teece, et al., 1997); due to an absorptive capacity (W. M. Cohen & Levinthal, 1990); because of second order learning associated with capability monitoring (Schreyögg & Kliesch Eberl, 2007), or other explanations (Mintzberg, Ahlstrand, & Lampel, 1998).
The perspective of strategy as essentially static, which was historically based upon the notion of economic equilibrium (Vasconcelos & Cirino, 2000) have been de emphasized as locus of attention, and dynamics of competition prevail in strategy textbooks (Besanko, et al., 2004; Ghemawat, 2002; Hitt, et al., 2005; Mintzberg, et al., 2003).
Porter suggested that the agenda of the strategy field comprises two major issues:
# $
$ (1991, p. 95). The longitudinal problem in fact has become an important stream of work in the field of business strategy many years ago (Barnett & Burgelman, 1996; Lovas & Ghoshal, 2000; Schendel, 1996).
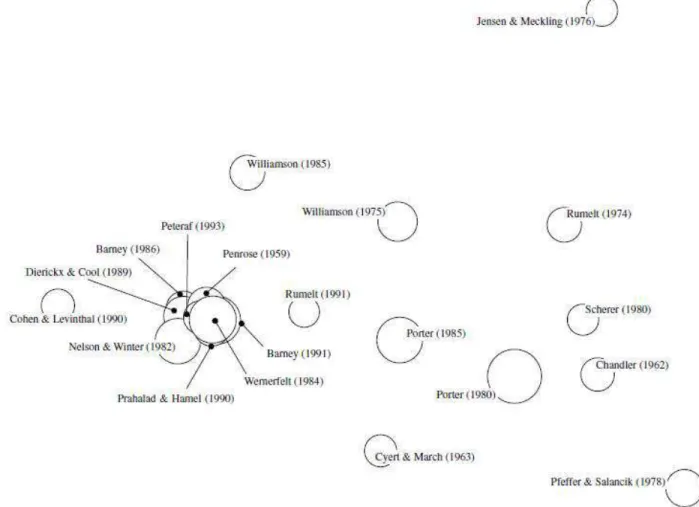
Changes in the intellectual structure of the strategic management research field as described by Ramos Rodriguez and Ruiz Navarro (2004) had already identified the increasing role played by evolutionary economics during the late 1990´s, usually associated with RBV and DC theorists:
Figure 1 Intellectual structure of strategic management research: 1994 2000
Source: Ramos rodriguez; Ruiz Navarro, 2004 p.1000
determined (Levinthal, 1991). T of the field of business strateg
Fig
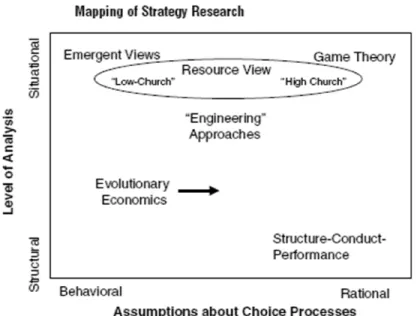
The present study consi the behaviorial notions introdu 1997). This is still considered a define business competition as improve their performances as simply, the competition is the s approach of several other auth Gavetti, Levinthal, & Rivkin, 20 & Siggelkow, 2008; Repenning
. That view is reinforced by Gavetti and Levintha strategy, who stated: ( )
% &
(2004, p. 1309):
Figure 2 Mapping of Strategy Research
Source: Gavetti; Levinthal, 2004 p.1310
considers these evolutionary perspectives on strateg troduced by Cyert, March and Simon (Cyert & Ma ered a very promising branch of research (Dosi & Ma ion as the evolutionary process through which firms
ces as they perceive problems or strive for better s the search for economic performance. In doing so, w er authors utilizing simulation methods (Gavetti &
kin, 2005; Ghemawat & Levinthal, 2008; Mezias & G nning, 2002; Rivkin, 2000; Strang & Macy, 2001; Zo
evinthal in their analysis
' *
5-:- 4 0 1 !; ! 0 0 8 ! 1* 8 090 0 . ! 1 0
According to Miller and Page (2007), complexity theory in the social sciences started hundreds of years ago, with the concept of the “invisible hand” that was defined by Adam Smith: market structures would be created out of the individual action of self interested agents, without being part of any single agent´s intention. The recognition that an observed macro level pattern may emerge out of the dynamics at a lower level is at the heart of their definition for complex systems:
What it takes to move from an adaptive system to a complex adaptive system is an open question and one can engender endless debate. At the most basic level, the field of complex systems challenges the notion that by perfectly understanding the behavior of each component part of the system we will understand the system as a whole. (Miller & Page, 2007, p.3)
In his landmark work, “The sciences of the artificial”, updated in its 3rd edition, Simon depicted three different waves of interest related to complexity. He characterizes a first wave after the 1st world war, associated with an anti reductionist perspective (holism, gestalt). A second wave after the 2nd world war, focused on feedback mechanisms and homeostasis in complex systems (systems thinking). Finally, the current wave, centered in the investigation of the mechanisms that create and sustain complexity, the analytical tools to describe it, and in the study of chaos theory and catastrophe theory (Simon, 1996).
nonreductive individualism. As Macy & Wiler suggests, agent based modeling may help to develop a methodology “ " & #+,-,$
. % & ”(2002, p. 148).
Mitleton Kelly points that there is not an unified theory of complexity, but only some common elements to be considered (Mitleton Kelly, 2003). Burnes reviewed recent works making use of complexity theories to understand organizations and identified a variety of realms under the same umbrella, with the following common ground that we want to emphasize:
Its proponents claim that organizations are dynamic, non linear systems and, as such, the outcome of their actions are unpredictable but, like turbulence in gases and liquids, they are governed by a set of simple order generating rules. (Burnes, 2005, p. 85)
The managerial expectation here is to understand the order generating rules to possible maneuver the emergent properties of the system, such as reducing the volatility of a supply chain to improve performance, or at least tracing repetitive patterns that will provide useful information (Levy, 1994). That would be what MacLean and MacIntosh characterized as “conditioned emergence” (Macintosh & Maclean, 1999; 2003). Several authors already proposed new management techniques and approaches for dealing with enterprise dynamics and change based on the premises suggested by such theoretical perspective (Beinhocker, 1997; Brown & Eisenhardt, 1998; Lewin & Regine, 2003; McMillan, 2006; Mitleton Kelly, 2003; Pascale, 1999).
Although attractive, it has to be considered the warning given by Burnes, McKelvey and others (references therein): to avoid the premature conversion of new ideas into normative prescriptions, and to be aware that some social scientists misuse chaos and complexity theories, applying them to organizations without adequate conceptual justification (Burnes, 2005; McKelvey, 1999b; Stacey, Griffin, & Shaw, 2000). It is also worth recognizing the limits of theorizing complex systems, by their very nature or definition (Cilliers, 2002).
With all these discussions in mind, we will turn now to explore potential applications in the fields of organizational theory and business management. To do so, a starting point is the Organization Science Journal issue specially dedicated to applications of complexity theory, “
Complexity theory (as presented here) is quite suitable to those researchers that build upon evolutionary economics to develop their works (Arthur, 1994; Auyang, 1998; Holland & Miller, 1991; Levinthal, 1997; Markose, 2005; Rivkin & Siggelkow, 2003). That is precisely the theoretical frame of reference upon which we built our simulation model to explore business dynamics and competitive advantage.
Agent based modeling is one of the tools researchers employ to explore potential explanations for observed properties at a macro level (the market or the organization) that are supposedly the outcome of dynamics at the micro level (Arthur, 1994; Auyang, 1998; Axelrod, 1997; Holland & Miller, 1991; Macy & Willer, 2002; Sawyer, 2005). The agents, being single persons, groups or organizations, operate in a manner and in an environment under the premises postulated by complexity theory (Anderson, 1999; Arthur, 1994; Gilbert, 2008; Holland & Miller, 1991; Kimura, Pereira, & Lima, 2007; Levinthal & Warglien, 1999; Markose, 2005; Miller & Page, 2007) . Instead of having the fictional “representative agent” criticized since long in economics (Alchian, 1950), the agents in such computational representations differ from each other; they have internal states and interact with others through a web of connections; they receive and process feedback and by doing so their aggregate behavior becomes non linear, with emergent properties under certain conditions:
Under organized complexity, the relationships among agents are such that through various feedbacks and structural contingencies, agent variations no longer cancel one another but, rather, become reinforcing. – systems can exhibit aggregate properties that are not directly tied to agent details (Miller & Page, 2007, p.53).
5-<- ! 1 0 ! .! 00 8 0 2 " 8
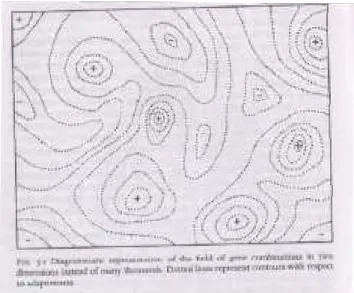
One way to model the evolution of adaptive agents is to make use of the concept known as fitness landscape. Introduced by Wright (1932), it suggests that, for an interbreeding population, there is a multidimensional space in which each attribute (gene) of an organism is represented by a dimension of the space. A final dimension indicates the fitness level of the organism. Warning upfront that the representation is inadequate, Wright presents the following figure, a two dimensional fitness landscape, for the sake of clarifying his proposition:
Figure 3 Original fitness landscape representation
Source:Wright, 1932, pg.358
Kauffman developed an extensive work claiming to address uncovered themes in developmental and evolutionary biology, notably the idea that simple and complex systems can exhibit powerful self organization (Kauffman, 1993, 1995).
The model is a rich representation for the study of evolutionary processes of various natures, with many useful implications derived from its central proposition, such as:
The fitness landscape as a representation would become “rugged”, that is, with multiple peaks and valleys as K increases. It is not clear whether a specific configuration implies being in the highest peak or just stuck in a valley; small changes in an attribute (N) might cause significant impact on the organism fitness; very similar organisms may have quite different fitness levels. It becomes unclear (even impossible to grasp) how all these interdependencies work;
In single peaked landscapes, when K=0, successful, incremental “adaptive walks” lead to the top (“hill climbing”), whereas in rugged landscapes, with K>2, becomes too difficult to oversee the best configuration even if the adaptive agent has the ability to look over many possible alternatives.
Many other implications derive from the model, as Kauffman´s demonstrates in his works and we explore some of those when discussing the simulation outcomes later on in this work. By now, it is worth reproducing Kauffman´s words about the potential application of his ideas in fields such as organization and management science:
Organisms, artifacts, and organizations all evolve and coevolve on rugged, deforming, fitness landscapes. Organisms, artifacts and organizations, when complex, all face conflicting constraints. So it can be no surprise if attempts to evolve toward good compromise solutions and designs must seek peaks on rugged landscapes. (1995 , p.246)
5-=- 2 8 19 . .! 00 8 0 0 3! 2! 1 0 !
% ” (Mitleton Kelly, 2003, p. 26). She also suggests thinking more about complex behavior than complex systems.
In spite of the controversy, there is an attempt to identify unifying principles in complex adaptive systems, whether biological, physical or socio economic (Markose, 2005; Mitchell & Taylor, 1999). In the fields of management science or business strategy, there is a growing number of works making use of fitness landscape like models to develop theoretical propositions (Ethiraj & Levinthal, 2004a, 2004b; Gavetti & Levinthal, 2000; Gavetti, et al., 2005; Ghemawat & Levinthal, 2008; Kimura, et al., 2007; Levinthal, 1997; Levinthal & Posen, 2007; Levinthal & Warglien, 1999; Porter & Siggelkow, 2008; Rivkin, 2000, 2001; Rivkin & Siggelkow, 2007; Siggelkow & Rivkin, 2008). We will refer extensively to these works later when describing our model design and the experiments we conducted.
The idea of unifying principles for complex systems is far from new, and can be traced back to von Bertalanffy (1950), as a general systems theory, or Forrester (1958, 1960), applied for management purposes. Since then, systems thinking evolved through various streams, contributing as an epistemological approach claiming to deal more properly with complex, systemic phenomena than other prevailing reductionist approaches (Georgiou, 2007).
There is still some debate around the potential distinctions complexity theory might have in relation to systems thinking, in special when considered the various schools of thought within each of these branches. Stacey, Griffin and Shaw developed a comprehensive analysis of the differences among those, but their arguments go much beyond the scope of the present work. In short, these authors defend that complexity theory, from which the model created by Kauffman would be a representation, is of a different teleology, namely Transformative, not a Formative one, as it would be the case of general systems thinking. We reproduce some of their words in this regard:
In systems thinking, causality is primarily of the formative type taking the linear form in which the feedback process of the system causes its patterns of behavior, usually in a predictable way, but those patterns do not cause the system dynamics. The future forms to which such systems move are already given in their structure, including the boundary separating them from others. We call this Formative Teleology.(Stacey, et al., 2000 pg. 120)
system operates at the edge of chaos. The intrinsic properties of connection, interaction and relationship cause emergent coherence in the particular conditions prevailing at the edge of chaos and that emergent coherence is radically unpredictable. Efficient causality is retained as the cause of an agent’s particular local response to other agents, but it is the interaction itself that operates as the transformative cause of the emergent pattern of the whole system. Furthermore, that transformative causality is circular, indeed self referential, because self organization causes emergent patterns in itself. (Stacey, et al., 2000 pg. 122)
The results of our simulations, as presented later in this work, illustrate the role randomness plays in creating some different or even unexpected patterns of performance (by search strategy) for the firms operating under the same settings. We can easily devise idiosyncratic and path dependent situations where past behavior and choices influence subsequent firm decisions. However, we didn´t intend to emulate in this work the learning of new organizational routines as the firms interact with the environment. In this sense, what we see is really the unfolding of what is already there – it is a formative rather than a transformative teleology according to the previous arguments. It is worth clarifying that we also made use of Kauffman´s landscape model as an analogy of the competitive landscape, but the logic of learning was not included either.
Our understanding is that what distinguishes the transformative teleology is the notion (that is not built into the model) that the emergent property of the system influences agency (firm behavior) in subsequent periods. That is what Sawyer discusses as social emergentism (2001, 2005), Giddens as structuration theory (1984) or Macy and Willer suggest in their call for the micro macro link resolution (2002).
5->- 2 ! 0 6 / 2 0 2 2 !0 0 8 9 69 .! 0
The search mechanisms to be modeled in this study follows a large stream of work that builds upon A behavioral theory of the firm (Cyert & March, 1992), with firms having routines (or search mechanisms) to solve perceived problems or needs (Nelson & Winter, 1982), including
but not being limited to achieving superior economic performance.
Many authors explain the way firms try to differentiate themselves in order to achieve superior economic performance. Firms search for imperfections in the products or factors markets (Barney 1986; Besanko, Dranove, Shanley, and Schaefer 2004; Porter 1985). On the other hand, there is also a large literature in organizational theory that explores why firms come to be similar one to another; the causation relies on isomorphic mechanisms that operate, with or without intentionality (DiMaggio & Powell, 1983; Oliver, 1991; Scott, 2001).
In this study both accounts were taken into consideration. In our simulations firms compete with different search methods and we analyze their relative efficiency under a variety of conditions. We counted on several previous works that applied simulation methods and created computational representations of search mechanisms such as those of Abrahamson and Fairchild (1999), Abrahamson and Rosenkopf (1997), Strang and Macy (2001), Levinthal and others (Ethiraj and Levinthal 2004a; Gavetti and Levinthal 2000; Levinthal and Warglien 1999; Rivkin 2000). As we explain later, the search methods in our model resemble those of various studies, in special that of Lant & Mezias (1992).
5-?- 0!0 . 6 1 6 8 3 1 .
As we mentioned before, the persistence of above average and below average performance is a central, controversial theme in the strategy field (Arend, 2003; Barney, 1991; Durand, 2002; Jacobsen, 1988; Knott, 2003; Porter, 1985; Powell, 2001, 2003a; Powell & Lloyd, 2005; Vasconcelos & Brito, 2004; Wiggins & Ruefli, 2002).
:- ) $ %
In this section we explain how the research work was organized, and we describe the approach for designing and developing the software model tied to a theoretical framework of reference that would support its internal definitions and operating routines.
We formalize the variables and relationships that drive our research program, as they constitute the foundation for the development of the computer application that we built to run our model.
Finally, we provide a preliminary clarification of the limits and limitations of our work.
:-,- 2 8 19 . 2 /0 . 0! /8 ! 2 0
The motivation to develop this project with simulation methods comes from works such as those of March (M. D. Cohen, March, & Olsen, 1972; March, 1991), Abrahamson (Abrahamson & Rosenkopf, 1997) and Strang and Macy (2001), in which relevant theoretical propositions came out of simulation models that exhibit both parsimony and robustness.
In fields such as economics, academic journal editors already suggest shortening papers by removing discussions since the computational approach is considered “business as usual” (Miller & Page, 2007). Specialized journals in this subject already exist, such as: “Emergence: Complexity & Organization” and “Computational and Organizational Theory”. Suggested principles and “good practices” have been developed for the use of simulation methods, (Davis, et al., 2007; Gilbert, 2008; Miller & Page, 2007; Pidd, 1998; Prietula, et al., 1998). Even though, some authors consider that its value for theory development remains clouded and even controversial, requiring that researchers be quite selective about what to investigate.
Simulation is particularly useful when the theoretical focus is longitudinal, nonlinear, or processual, or when empirical data are challenging to obtain.” (Davis, et al., 2007, p. 481).
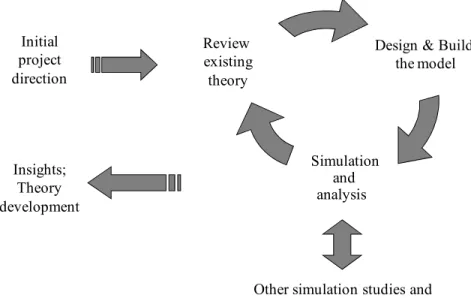
We followed the basic steps found in literature of modeling and simulation methods of research (Davis, et al., 2007; Gilbert, 2008; Law, 2007; Miller & Page, 2007; Pidd, 1998; Prietula, et al., 1998), except for the empirical validation, which we addressed only indirectly within the scope of the present work:
Figure 4 Methodology for the development of this work
Source: Developed by the author, based on available literature about modeling.
We defined at the very beginning of our work a research agenda around the dynamics of competition, the so called ‘longitudinal problem” of strategy (Porter, 1991). The model was initially built after extensive literature review, mainly from the journals Strategic Management Journal, Organization Science and Management Science, looking for studies making use of simulation methods to develop theoretical propositions. Several works were seminal to the initial directions taken in our study, among them: the works developed by the Santa Fe Institute, notably the “Sugarscape Model” (Epstein & Axtell, 1996) and the dynamics of cooperation represented through agent based modeling (Axelrod, 1997).
Our initial insights directed us to the issues developed later in this work; we focused our
Design & Build the model Simulation and analysis Review existing theory Insights; Theory development
Other simulation studies and reports on empirical evidences Initial
experiments in the most promising areas, with some complimentary theory review to support the discussions. We avoided increasing the complexity of the model (for the sake of parsimony), although we made some minor adjustments (and corrections), as documented in the “Log of changes.htm” document (reproduced in the subsection: model verification and validation, and also electronically available within the system programming code).
In the following topics of this section we present our simulation model in its last version, and we comment the implications and limitations of our design choices, as far as we could realize.
:-5- !.9! 1 2 ! 68 0 8 ! 02! 0 6 8
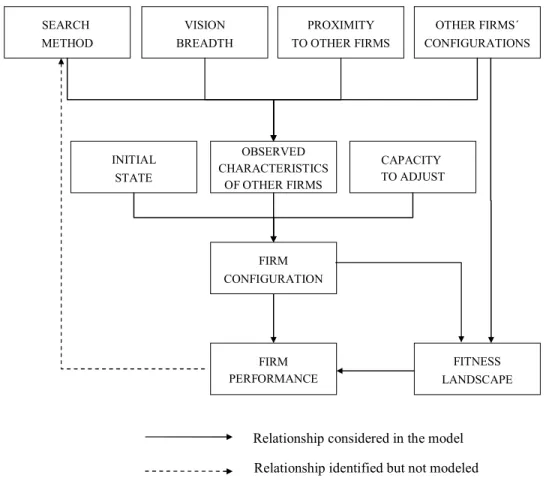
The following diagram presents the variables and relationships of our simulation model:
Figure 5 Variables and relationships built into the model.
FIRM PERFORMANCE CAPACITY TO ADJUST SEARCH METHOD FITNESS LANDSCAPE FIRM CONFIGURATION
Relationship considered in the model Relationship identified but not modeled VISION
BREADTH
PROXIMITY TO OTHER FIRMS
OBSERVED CHARACTERISTICS
OF OTHER FIRMS
OTHER FIRMS´ CONFIGURATIONS
We defined the variables based on both the existing theory and on developed works making use of simulation methods. By doing so, we expected to achieve some internal and external validity, following recommended practices (Davis, et al., 2007; Gilbert, 2008; Law, 2007; Prietula, et al., 1998) . We defined and operationalized all the variables as described below:
i) Search method
Definition: the logic or strategy an agent (firm) utilizes to look for improvements in its operations (Gavetti and Levinthal 2000; Rivkin 2000; Rivkin and Siggelkow 2003).
Implementation: four different search methods preliminarily configured:
i. Majority mimetism – the firm tries to improve its performance by adopting the configuration most utilized by other firms among those firms it can visualize at each specific period (round);
ii. Minority mimetism – the firm tries to improve its performance by adopting the same configuration of the leader, defined as the firm with the best fitness value among those firms it can visualize at each specific period (round); it does so with an error that can be parameterized at each different simulation;
iii. Random searching – the firm tries to improve its performance by trying new configurations at random;
iv. Market reading – the firm tries to identify what fits better to the market (by innovating), instead of looking to what and how well other firms are doing; it does so with an error that can also be parameterized for a given simulation.
short periods of the organizational life (Cyert & March, 1992; Nelson & Winter, 1982). The search methods resemble those of various studies, in special that of Lant & Mezias (1992).
ii) Vision breadth
Definition: the number of firms that one agent can simultaneously observe in the short term in order to gather some information about the way they configure their resources (characteristics).
Implementation: the number of firms that one firm can observe at a single round during the simulation; one firm may have proximity to many firms (connections with or access to information about), but the actual number of firm observations at each round will be limited to this variable. The amount of information gathering one agent will perform depend on its “capacity to adjust” attribute.
The “vision breadth” variable is one of a genetic endowment as well as the search method (and the “capacity to adjust”). It is randomly assigned within the parameters set for the simulation (input distribution form to be utilized for random number generation and respective parameter values for the input distribution form selected). This variable is utilized in several other agent based modeling applications, though implemented in different ways (Epstein & Axtell, 1996).
Through this variable we operationalize the notion of bounded rationality (Simon, 1997) the firm cannot process all information that might be available through its social network – and it is aligned with other works with fitness landscapes that pose limits to information processing (Ethiraj & Levinthal, 2004a; Gavetti & Levinthal, 2000)
iii) Proximity to other firms
Definition: the list of all firms that one agent might consider to observe when searching for performance. Such set of firms would represent a variety of business conditions that explain why some firms are influential to others, such as: physical proximity (neighborhood), perception as relevant competitor, relationships at board level, business partnerships, reputation etc. Such definition allows for the accounts of isomorphic mechanisms as described in the literature of institutional theory (DiMaggio & Powell, 1983; Scott, 2001). The relevance of network connections in the search processes is at the heart of the fitness landscape model as highlighted by Gavetti and Levinthal (2000).
Implementation: pairs of firms are selected randomly at the beginning of the simulation, creating a set of firms each agent will possibly observe during the simulation run (the number of pairs depends on a simulation parameter). This approach is similar to one of the “influence matrix” operationalizations depicted by Rivkin and Siggelkow in their work (2003).
iv) Other firms´ configurations
Definition: the available information that a firm may be able to access during a simulation run of how the other firms are organizing themselves.
Implementation: see item viii – “firm configuration” variable for the details of what a specific firm configuration means.
v) Initial state
Implementation: the set up process of a simulation run assigns a random configuration to each firm, as do all other simulation studies of this kind. For more comments on the implementation: see item viii – “firm configuration”.
vi) Observed characteristics of other firms
Definition: the specific information an agent can gather at a certain moment regarding the configuration of other firms. It depends on the type of information required by the “search method” of the agent, its “vision breadth”, and its “capacity to adjust”. An agent collects information only from the group of firms defined by “proximity of other firms”.
Implementation: in each round of a simulation run, the agents have the opportunity to access information regarding other firms (if required by their respective search method). The information is limited to a pool of firms that is renewed every round, made out of the group of firms with whom the agent is connected (as defined by “proximity to other firms”). The size of the pool is limited for each agent by its “vision breadth”. The amount of information about the configuration of other firms to be gathered, that is, the number of characteristics to be observed, is limited by the “capacity to adjust” of the respective agent. The definition of which characteristics to collect information about is also randomly determined for each agent, at each round.
vii) Capacity to adjust
Definition: the maximum number of characteristics in the configuration of a firm that is subject to a simultaneous change at any given moment during the simulation.
Implementation: each round a firm may search for improvements for only part of its configuration, due to the limit expressed by its “capacity to adjust”. The characteristics that are subject to observation and that might be potentially changed are randomly determined at each round .
The “capacity to adjust” variable is a genetic endowment, randomly assigned within the parameters set for the simulation (input distribution form and respective parameters for this variable). The embedded notion is that firms have limits to their adaptive change process and these may vary from one to another (Cyert & March, 1992; Simon, 1997).
viii) Firm configuration
Definition: consists on a set of resources and/or capacities acquired or adopted by the firm in order to run its operations (its business model). Such a definition is broad enough as to cope with the strategy and organizational theories chosen for the present study (Barney, 1991; Cyert & March, 1992; Porter, 1996), and it is common use in management studies with simulation methods (Levinthal, 1997 and others previously mentioned).
Implementation: each firm begins a simulation run with a specific configuration, randomly assigned2. The configuration of a firm consists on a set of structural and flexible characteristics (or attributes), as defined by the simulation parameters. Each of the structural or flexible characteristics can assume either value “0” or “1”, being the difference between these types the resilience or resistance to change. Differentiating characteristic types is one way of addressing the issue
2
raised by Porter & Siggelkow (2008): in fitness landscape simulation models the configuration of a firm should be treated as an activity system in which some activities may be more structurally related to others.
In our model a firm performs its search method every round, and as a result may perceive the need to change the value of a characteristic. If the observed characteristic is flexible, the firm implements the change. However, if it is structural, the firm only accumulates an observation of that value. Only after the third consecutive observation of the same value for a given characteristic a firm shall implement the change.
The characteristics may influence one another, but these interdependencies can’t be directly observed or accessed by the firms during their searches (this kind of operationalization is the same one virtually all authors working with fitness landscape models utilize).
ix) Fitness landscape
We modeled two distinct landscapes in which our simulations might run.
1st model: The customized landscape
Definition: the set of all possible configurations that a firm might have, with the respective fitness values to be considered in each case.
and their respective impacts are generated by the system according to simulation parameters (percentage of combinations; maximum limit for the impact).
Such design is similar to other landscape models, as in the work of Gavetti, Levinthal and Rivkin (2005). Our design of interdependency effects answers the critique of Porter and Siggelkow to the typical NK landscape model operationalization (2008), that is, the need of reflecting the distinctive role of key activities in a given activity system (or business model).
During the simulation, the landscape may change due to exogenous and/or endogenous causes. An exogenous change consists of changes in the value of the characteristics, with new randomly assigned fitness contributions and interdependence impacts for the combinations that involve the changed characteristic. An endogenous change consists of an increase (or reduction) in the fitness contribution associated with a specific characteristic due to the fact that too little or too many firms adopted that same attribute value. The parameters for both types of landscape change can be set at the beginning of each simulation.
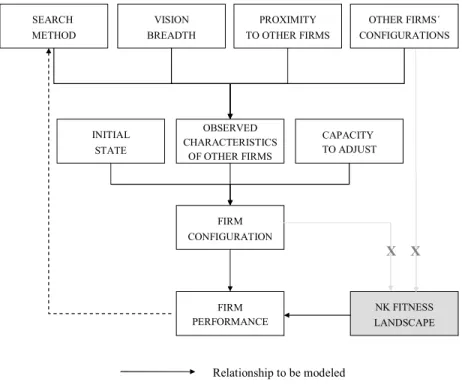
2nd model: The NK model landscape
In the attempt to increase the internal validity of our model, we developed a second type of landscape in which the simulation might run, making use of the same definition and implementation of the NK model as other management studies. Our intent is to proceed with what Prietula, Carley and Gasser (1998) called “model docking”, that is, an attempt to obtain convergent results utilizing two different models, in our case, two different conceptions of competitive landscape.
Definition: the multidimensional space in which every characteristic or attribute is represented by one dimension. A final dimension indicates the fitness level of the organization (Gavetti & Levinthal, 2000; Levinthal, 1997).