•
•
•
..
•
'-0
,
•
SEMINARIOS DE ALMOÇO
•
•
F U N D A ç Ã ODA EPGE
GETUUO VARGAS
•
•
•
•
Optimal water use: Is anyone getting the
•
•
right incentives in California?
•
•
•
•
•
•
•
•
SAMANTHA DART
•
•
•
•
•
(University of Chicago)
•
•
•
•
•
Data: 26/08/2005 (Sexta-feira)
•
•
Horário: 12 h 15 min
•
•
•
•
,~
Local:•
Praia de Botafogo, 190 - 110 andar•
FGV
Auditório nO 1•
•
EPGE Coordenação:•
Prof. Luis Henrique B. Braidoe-mail: [email protected]
•
•
•
•
c,
'"
,
•
•
•
•
•
•
•
•
•
•
•
•
•
•
•
•
•
•
•
•
•
•
•
•
•
•
•
•
•
•
•
•
•
•
•
•
•
•
•
•
•
•
•
•
•
•
•
c,
&,
Optimal Water Use: Is Anyone
Getting the Right Incentives in
C alifornia?
Samantha
Dare
August 2005
Abstract
This paper discusses ~he widespread inefficiency in water pricing today and uses the State of California as an example. After
solving the Planner' s Problem I conclude that water for
irrigation should cos::. more than for domestic use. The optimal
price leveI can be calculated from a correct measure of ~he true marginal cost of supply.
1. Introduction
In many parts of the world water usage has become an important issue. The United States
is no exception. At the same time that necessity brings about technological innovation,
such as desalinization techniques used in the Middle East or low-flow toilets in the U.S.,
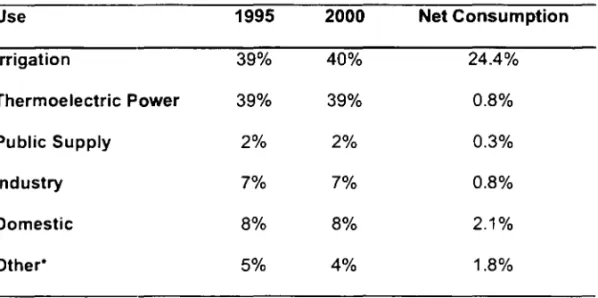
it also calls for efficient use of the scarce resource. Below is the most recent picture
available of freshwater use in the United States:
Use 1995 2000 Net Consumption Irrigation 39% 40% 24.4%
Thermoelectric Power 39% 39% 0.8%
Public Supply 2% 2% 0.3%
Industry 7% 7% 0.8%
Domestic 8% 8% 2.1%
OtherO 5% 4% 1.8%
Table I P~'rccntage of total freshwater (surface and groundwater) used in the U.S. (Hutson, 8arber et a!.
200~1
* Mmm::. cl)mmercial use, aquaculture and Iivestock.
The first t\\'o columns show freshwater allocation among user categories in the United
States In 1995 and 2000. The third column, however, takes into account what was water
actually consumed, i.e., freshwater demanded net of the amount returned "immediately"
to the source poof. The amount returned divided by the amount initially demanded is
2 The Lnited States Geological Survey (USGS) defines "immediate return" as the water being available for
consumption short(v after the moment when it was first used, as opposed to the larger amount of time involved when the return process goes through evaporation and condensation. One example would be when
2
•
•
•
..
•
•
•
•
•
•
•
•
•
•
•
•
•
•
•
•
•
•
•
•
•
•
•
•
•
•
•
•
•
•
•
•
•
•
•
•
•
•
•
•
•
•
•
•
•
•
•
•
•
•
•
•
•
•
•
•
•
•
•
•
•
•
•
•
•
•
•
•
•
•
•
•
•
•
•
•
•
•
•
•
•
•
•
•
•
•
•
•
•
•
•
"
~defined as reutilization rate. Irrigation and Thermoelectric Power plants seem to be by far
the most significant (gross) users. But Thermoelectric plants, much like domestic
consumers, offer a high water reutilization rate (98% and 75%, respectively), whereas in
agriculture it is as low as 40%3. And yet, when browsing the worldwide web through
Water Districts websites and alike, most of the recommendations one would find
regarding water conservation refers to domestic water use.
People behave according to the incentives they are given. This paper attempts to show
that the current irrigation water price relative to the price for domestic users is
optimal, leading to alIocative inefficiencies favoring farmers. Price leveIs are also
non-optimal, since they do no account for an appropriate measure of the marginal cost.
Concems with marginal cost pricing have been raised by most of the previous literature
on this subject but, to the best of my knowledge, none of it has properly addressed the
issue of optimal relative prices and alIocative inefficiency.
The focus here will be on the State of Califomia. It has consistent1y been the leading
State in consumption (in the year 2000 it alone accounted for 11 % of alI freshwater used
in the United States and 22% of ali irrigation water used in the country) and many of its
farmers take advantage of subsidies when buying their water, especialIy from the Federal
Govemment (Central Valley Project - CVP)4.
a residential user washes his hands. Most ofthe water is immediately redirected to either a treatment facility or another deposit in the source pool, such as a stream, and can be reutilized.
3 Source: USGS.
4 See appendix for evidence on irrigation water subsidies.
There are three main kinds of irrigation currently used in the V.S.: flooding (water is poured on the land and flows through the fields), spraying (water is sprayed from spray
guns onto the fiel.ds) and dripping (water drips from smalI wholes in pipes put along the
cultivated land). Flooding is the cheapest for the farmer, since it does not require special
machinery, and it is applied in almost half of alI the irrigated acreage in the Vnited States.
In the year 2000 it irrigated 47% of the cultivated acres across the country. In Califomia
54% ofthe cultivated acres were flooded.
Dripping and spra.ying, on the other hand, are more efficient in terms of the percentage of
each gallon of water used that is actually absorbed by the crops, since there is less
evaporation or other 10sses5.
There are several projects being planned anel/or executed in Califomia at this moment
that aim at recovering aquifers or building more storage facilities. But a lot could be
accomplished should policy makers not ignore the demand side of this equation.
The paper is organized as follows: Section 2 brings the Planner Problem and the choice
of how to distribute water between irrigation and domestic use. The following section
presents the private decision problem, where a price taker chooses how much water to
consume. Section 4 analyses what would be optimal relative prices and optimal price
leveIs. The last section concludes. Appendix A was added in order to show some
evidence of agricultural subsidies in the State. Appendix B describes the marginal cost of
5 With flooding, a large quantity ofwater runs off the edges and back of the fields and never even touches
the crops. Besides, a lot of the water just evaporates or becomes transpiration from plants.
4
•
•
•
•
•
•
•
•
•
•
•
•
•
•
•
•
•
•
•
•
•
•
•
•
•
•
•
•
•
•
•
•
•
•
•
•
•
•
•
•
•
•
•
•
•
•
•
•
•
•
•
•
•
•
•
•
•
•
•
•
•
•
•
•
•
•
•
•
•
•
•
•
•
•
•
•
•
•
•
•
•
•
•
•
•
•
•
•
•
•
•
•
•
•
..
•
extraction calculation and Appendix C discusses the measurement of the allocative
inefficiency in more detail.
2. The Planner Problem
For simplicity, let us leave the water pricing for thermoelectric power aside for now and
think of the problem of allocating water between irrigation and domestic use. The planner
would then choose a sequence of numbers of gallons of water to irrigate a single crop and
for domestic consumption to maximize a value function:
subject to
G G (1
)g
s (1)gl.
Ji.L'/; FI: RI F;\'1+1 = 1 - - as 1 - - aI. 1 + url _1 - 1 + 1 + 1 , 'til
The first restriction to the problem says that, at any moment in time, the sum of
extractions for irrigation and domestic use has to be no greater than the leveI of water
available, Gr, and the second restriction describes the law of movement of the water
stock, Gr•
gS is the number of gallons of water allocated to irrigation and it is characterized by its low reutilization rate or small return, as 6
.i
on the other hand is the number of gallons of water used domestically, characterized by a large return, aL7. P(g) represents the value ofagricultural production that can be obtained with g gallons of water used to irrigate the crop. U(g) is a measure ofthe utility provided by having access to water at home for drinking, showering, doing dishes etc8. C(.,.,.) is a cost function. The lower the leveI of
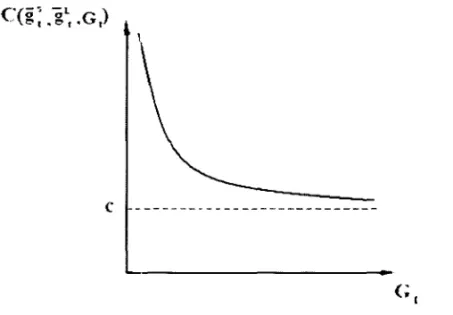
the water table, 6e more costly it is to extract a gallon ofwater from it9. The idea is that,
for any given value of
g;~
andg;,
C(g15, glL ,GI ) looks like this:c
---..
Figure 1: The cost of extraction as a function ofthe leveI ofthe water table.
I assume the (usual) partial derivatives P -' > 0, P s s < 0, U I. > O. U I. J <
°
andg g I( 1 ( " g g"
Cc < 0, Ccc > 0, C .\ = C i = C" > 0, C -'c' = C I.C' = C"c <
°
Vt hold, so that we have a, , J g ~ ~l R J K I ('o I
well defined problem.
6 Following USGS reports on reutilization rates. 7 Both as and al are between O and I, as< alo
8 U(gl) should be comparable to P(gs) and C(I), so I will consider it to be a dollar measure ofutility. 9 This cost represents not only the cost of pumping water out of its reservo ir, but also the potential cost of
losing an aquifer to saline water contamination once its leveI becomes toa low, a serious risk for regions close to the oceano like California.
6
•
•
•
•
•
•
•
•
•
•
•
•
•
•
•
•
•
•
•
•
•
•
•
•
•
•
•
•
•
•
•
•
•
•
•
•
•
•
•
•
•
•
•
•
•
•
•
•
•
•
•
•
•
•
•
•
•
•
•
•
..
•
•
•
•
•
•
•
•
•
•
•
•
•
•
•
•
•
•
•
•
•
•
•
•
•
•
•
•
•
•
•
•
•
5
•
The remaining variables, FE
, FN and RI are there for a more precise representation of the hydrologic cyc1e and allow for a steady state in the leveI ofwater, Gr• Specifically,
F/
is the local freshwater evaporation in period t. It lowers the water leveI in period t+ 1, but a percentage of it, Ô, is assumed to come back in the form of rain in period t+ 2.F;
N isthe freshwater that flows into the region minus local freshwater that flows out of the region in period t.
R/
is rain, originated from outside evaporation, that falls into thereglOn.
Assuming the first restriction is not binding (so the Planner has what to distribute among
users), the first order conditions (FOC) are as follows:
Where the latter term can be rewritten as
Recursive substitutions lead us to
The derivative with respect to
g:'
generates a similar equation:x
Ug~.
-C~;{-.
+(I-aJ~
f3'CG,., =0f:f
Therefore we have
x x
Pg~.
= Cgs. -(I -
aJ}:
f3'CG,., = Cg,. -(I -
as)}:
f3iCG,., and,.1 ,.1
One can interpret that as saying that the marginal product of water in agriculture should
be equal to the marginal cost of extraction ( Cg, ) plus its impact on future availability or, as it is called by r.he literature, scarcity rent ((1-
as)}:
f3'Cc;,., ). The same is true for the,
dollar value of the marginal utility of water for domestic users.
Moreover, the op1:imal allocation implies
av(~{)
=av(~{):
ag;
agi"
This can be simplified to
8
•
•
•
•
•
•
•
•
•
•
•
•
•
•
•
•
•
•
•
•
•
•
•
•
•
•
•
•
•
•
•
•
•
•
•
•
•
•
•
•
•
•
•
•
•
•
•
•
•
•
••
•
•
•
•
•
•
•
•
•
•
•
•
•
•
•
•
•
•
•
•
•
•
•
•
•
•
•
•
•
•
•
•
•
•
•
•
•
•
•
•
•
•
•
~•
Because we know that the water retum from irrigation, as, is smaller than the return from
domestic use, aL, and that CG ,.1 is a negative number, we can say that the right hand side
of the equation above is positive. Therefore, the optimal allocation of water at a given
period t implies P . > U .. N ow let us tum to the private decision making in order to
g; g{
see how this result relates to prices.
3. The Private Choice Model
Suppose a typical non-farmer residential consumer takes the price of a gallon of water as
given and has to decide how much to consume. Assume, for simplicity, that he only
cares about water, g, measured in gallons, and other goods, c. In this case an individual i
maximizes the following objective function
Max
u~'
,g')
,.-' ,g'
subject to
, ' L I '
Pé C + PLg S IVl
g' sG
where pc and PL are respectively the price of goods and of the gallon of water,
!vi
isindividual i's income and G represents the total amount of fresh water available for
eonsumption10. Assuming, as it is reasonable, that the seeond eonstraint won't be binding
for any single individual, let us ignore it for now and foeus on the simple problem of
maximizing utility subjeet to a budget eonstraint11•
The firs order eonditions are given by
where L represents the Lagrangean funetion and Ài is the Lagrangean multiplier, the marginal utility of ineome for individual i. Manipulating these two eonditions provides us
with the eommon result that, when behaving optimally, eonsumers will ehoose quantity
of water and other goods so that the marginal rate of substitution between the two equates
their relative priees:
But, foeusing solely on the first order eondition for the demand ofwater, notiee that it ean
be written in a different way
10 I call the price of the gallon of water Pl in order to relate it to the large reutilization rate that is associated
with domes ti c consumption of water. Conversely, the price faced by fanners will be denoted Ps.
II I'm assuming, first. the function U( c,g) to have the usual desired properties of concavity, with the first
derivatives with respect to both arguments positive and the second derivatives, negative and, second, inada conditions.
10
•
•
•
•
•
•
•
•
•
•
•
•
•
..
•
•
•
•
•
•
•
•
•
•
•
•
•
•
•
•
•
•
•
•
•
•
•
•
•
•
•
•
•
•
•
•
•
•
•
•
•
•
•
•
•
•
•
•
•
•
•
•
•
•
•
•
•
•
•
•
•
•
•
•
•
•
•
•
•
•
•
•
•
•
•
•
•
•
•
•
•
•
•
•
~
~
The interpretation is that the marginal utility of water, measured in terms of dollars,
equals its price, PL, i.e., an individual will choose to consume more and more water as
long as the marginal gallon doesn't cost more than what it is worth to him.
The farmer's problem is not much different. His objective function is
subject to gs.G
where k stands for alI other inputs in production, whose relative prices I'm assuming
constant. so that they can be treated as a composite good.
P(k,g),
total production as afunctlOn of the inputs k and g, is increasing in both arguments but at a decreasing rate12.
Again. the restriction g s. G is assumed non binding. Ignoring, for simplicity, possible
comer ~lllutIons, the first order conditions are:
P fv
{.'.)=
p. K ~ '", "':P):~·.g·)=
Ps12 The price of output is nonnalized to 1.
So the farrner buys quantities of k and g, so that the marginal rate of substitution between
the two Pk (k,
g)
is equal to their relative price, Pk ., Px (k,
g)'
PsThe first order condition with respect to g is what is of interest for us right now.
P"
~o
,go) can be a proxy for P s that appears in the optimality condition for the'" x,
u
{,o
,g'O )Planner's problem. Analogously, x }.' ' from the non-farrner consumer's FOC, is a proxy for the dollar value of utility in the Planner's problem, U x:" Therefore, the Planner's result that P, > U /. implies that
P~
=
P 1,0 ,go» UX{,o
,g;O)=
p, . Hence,x, x, ., x \t' }.' .
efficiency implies that the price for the gallon of water ought to be greater for the farmer
than for the ordinary (residential) consumer. It should be noted that this result applies
only for commodity charges and is driven by the different reutilization rates faced by the
two parties. Differences in administrative and distribution costs are usually included in
the service charges, as recommended by the rate-setting manual published periodically by
the American Water Works Association (AWWA).
4. Efficient Pricing
4.1 Optimal Relative Prices
12
•
•
•
•
•
•
•
•
•
•
•
•
•
•
•
•
•
•
•
•
•
•
•
•
•
•
•
•
•
•
•
•
•
•
•
•
•
•
•
•
•
•
•
•
•
•
•
•
•
•
•
•
•
•
•
•
•
•
•
•
•
•
•
•
•
•
•
•
•
•
•
•
•
•
•
•
•
•
•
•
•
•
•
•
•
•
•
•
•
•
•
•
•
•
•
..,
.,
The optimality conditions from the Planner problem can be written as
Ps = MCx + SRs and
Where MCx is the marginal cost of extraction and SRs and SRL are the scarcity rents
x x
associated with each user. Since SRs =
-(1 -
as)~ f3'Cc,+, and SRL =-(1-
aL)~ f3'Cc,+, ' subtracting MCx from both sides ofboth equations and dividing one by the other gives usPs -MCx l-as
PI. -MCx
=
-l-a I.
P -MC P -MC
Rearranging that we have s x = L x which means
l-as l-aL '
that what users pay in excess of the marginal cost of extraction per gallon effectively
used should be the same. Since ps < PL and l-as> l-aL, there is an allocative inefficiency brought about by the differences in "nominal" prices, ps and PL, and enhanced by the
differences in reutilization rates. We can better visualize that some welfare loss is
generated in figure 2 below. The Edgeworth Box depicts farmers' and residential
consumers' indifference curves when they choose their consumption of water (W) and
other goods (X) facing distinct "real" prices (nominal prices discounted of marginal costs
of extraction, weighted by reutilization rates).
R
F
\y
Figure 2 The shaded area represents the area in which both farmers and residential users would be better offthan they are when the current non-optimal relative prices are in place.
Estimates for as and aL range from .40 to .50 and .75 to .90, respectively, so relative prices net of the marginal costs of extraction should lie somewhere in between 2 and 6.
With estlmates for the marginal cost of extraction as well as for elasticity of demand for
water I urban and rural), we can measure the allocative inefficiency associated with the non-optlmal relative prices currently in place. The simplest way to do it would be to
assume there is no scarcity rent. Then, from the Planner Problem's optimality conditions
we would have P.:·
=
P;.=
MCx. Suppose the marginal cost of extraction is greater thanthe pricc currently charged. Then the social gain from the change in price in each market
(irrigation or domestically used water) is the shaded are a depicted in figure 3 below:
14
•
•
•
•
•
•
•
•
•
•
•
•
•
•
•
•
•
•
•
•
•
•
•
•
•
•
•
•
•
•
•
•
•
•
•
•
•
•
•
•
•
•
•
•
•
•
•
•
•
•
•
.
•
•
•
•
•
•
•
•
•
•
•
•
•
•
•
•
•
•
•
•
•
•
•
•
•
•
•
•
•
•
•
•
•
•
•
•
•
•
•
•
•
•
&
'"
C,
p
:\ICx - - - - + - - - ,
,
Social Gain
Po ---~---:
D
, I
I I
:
'Q*
Q
Figure 3: Welfare gains from optimal pricing in a given market ifthere are no scarcity rents.
Another interesting exercise that can be done is to calculate the allocative inefficiency
holding constant the amount of water being extracted. Optimal relative prices would
induce a redistribution of the water from farmers to residential users.
In order to properly measure marginal cost of extraction, both short and long run costs are
to be taken into account. Short-run marginal costs are the costs related to energy (for
pumping) and treatment of the water. These can be more easily calculated, since all it
takes is summing the total spending with electricity in the water systems and the chemical
costs and divide it by total pumped supplies. What is more complicated is the long-run
marginal cost. According to F eldman, Breese et aI. (1981), it can be broken down into
four components: source capacity, treatment facility capacity, transmission system and
distribution system, i.e., all expected capital expenses necessary to provide a little extra
water, beyond current maximum capacity.
The EI Dorado Irrigation District (EID) is one of the few water districts in California that
supply freshwate:r to both agricultural and domestic users and this paper uses data from
their 2003 Comprehensive FinanciaI Report. Pumping and treatment expenses are
included in Operating Expenses. The report also includes a Capital Improvement Plan
(CIP), which deseribes planned expenses such as the ones cited above, that correspond to
the long run marginal costs of extraction (see table Bl).
The investments depicted in table B 1 are an example of the kind of capital improvements
that are being madeI3. Those numbers correspond to a percentage of the total physical
assets accumulated and, by dividing its rental value by the appropriate number of gallons
of water (using that same percentage on the total delivered annually), we get an estimate
of long run margmal costs14. That number plus the short run marginal cost is my initial
estimate of the (total) marginal cost of extraction: $2.85/1 000g15. More details on this
calculation are shown in Appendix B.
The final missing component before the allocative inefficiency can be calculated is the
elasticity of demand for water. For the rural elasticity of demand I am working with the
-.91 estimate in Shoengold (2005), which uses data from San Joaquin Valley, in
California, and takes into account changes in water demand related not only to water
management, but also to crop and irrigation method choice and fallowing of land. For
residential demand elasticity ofwater Iam using the -.77 figure from Hewitt (1998). This
13 There is a total of 39 capital improvement projects currently in their water division.
14 I used a rental rate (r + Ô), where r = 5% (Mulligan 2002) and ô = 2.5%, according to the estimated life of
facilities and equipment given by EI Dorado Irrigation District.
15 I am currently in contact with the ElO to clarify exactly how much extra capacity will be created due to their CIP and improve this estimate.
16
•
•
•
~
•
•
•
•
•
•
•
•
•
•
•
•
•
•
•
•
•
•
•
•
•
•
•
•
•
•
•
•
•
•
•
•
•
•
•
•
•
•
•
•
•
•
•
•
•
•
•
•
••
•
•
•
•
•
•
•
•
•
•
•
•
•
•
•
•
•
•
•
•
•
•
•
•
•
•
•
•
•
•
•
•
•
•
•
•
•
•
•
•
•
•
,
,
elasticity refers to how users facing an increasing block pricing, as do the EI Dorado
Irrigation District's customers, respond to a change in price in the first block.
Now, using the estimates above, it is possible to do the exercise previously mentioned (Ps
=
PL=
MCx) to measure the variation in the social surplus. The new prices will satisfythe optimal rei ative price condition obtained in the beginning of this section and
consumption will be reallocated accordingly.
~,85
t - - - " . , ' .
-\Yl'lf3l"(, GaiD I
D~
~ = 0.09
~~---~~
hTI~;llJOII Watel' :\larkel
Pu ... 0.80 ...: ..
Q~
1.
Figure 4: The Social Welfare gain of charging the marginal cost of extraction for the case of the EI Dorado lrrigation District.
Initial prices and quantities for both farmers and residential users come from EID (see
table A2). The quantity demanded in the irrigation water market falls from almost 2
million gallons a year to a little over 85 thousand gallons a year. For residential users,
quantity demanded decreases to about 2.5 million gallons a year, down from 6.5 million a
year. The associated welfare gain is of the order of ten million dollars, or 29 percent of
total revenues of the EI Dorado Irrigation District in 2003, a non-trivial share16 17.
4.2 Optimal Price LeveIs
We have seen lhat current water pncmg schemes practiced by some of the water
providers in Califomia are not optimal when the impact of usage on availability of the
resource is taken into account. In tenns of price leveIs, even when there are no subsidies
offered, which is the case of the water provided by the State Govemment, the average
cost of supplying water is commonly used to detennine price, instead of the marginal
cost, creating inefficiency18.
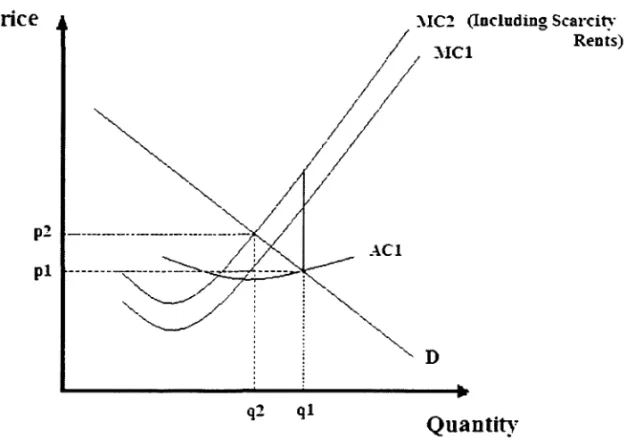
The social gain of charging the marginal cost as opposed to the average cost of supplying
water can be seen in figure 4 below. The lighter marked area shows the consumers' 10ss.
But the provider's gain amounts to that plus no longer having to bear the difference
between the price previously charged and the marginal cost of provision of the good. The
net gain is represented by the dark grey area.
16 More details on this caIculation in Appendix C.
171\iote that this measure of alIo cative inefficiency does not account for non-optimal price leveIs yet.
I~ Feldman, Breese et aI. 1981.
18
•
•
•
~
•
•
•
•
•
•
•
•
•
•
•
•
•
•
•
•
•
•
•
•
•
•
•
•
•
•
•
•
•
•
•
•
•
•
•
•
•
•
•
•
•
•
•
•
•
•
~
•
•
•
•
•
•
•
•
•
•
•
•
•
•
•
•
•
•
•
•
•
•
•
•
•
•
•
•
•
•
•
•
•
•
•
•
•
•
•
•
•
•
5
C,
•
Ptice
p2 pl
~IC
D
Quantit~'
Figure 4: The socialloss of charging average cost rather than marginal cost
One of the reasons behind this under pricing is that ca1culating average cost based on
money already spent is much easier than coming up with a measure of marginal cost,
which would be based on the cost of expanding supply beyond the capacity of existing
utilities. A second reason would be the heavy lobby of farmers. Even though only
approximately one per cent ofthe D.S. population works in agriculture, historical gains in
productivity in this sector have allowed for this number to be not toa small in terms of the
money they make and not toa big, so that they can be organized enough to put polítical
pressure on polícy (and tariff) makers. It may as well be possible that farmers pay below
average cost per gallon ofwater19.
Dnfortunately, there are several difficulties in implementing marginal cost pncmg.
Marginal cost is hard to be determined at a certain consumption leveI and it is even
19 In 19982,813 farmers in the U .S., including almost 400 in California, received their water at no cost
harder to be determined over a range of quantities. But even though the exact shape of the
marginal cost curve is not known, estimates such as the one presented in this paper can
shed light into what optimal price leveIs look like.
After estimating me marginal cost of extraction of water, the missing component to get to
the optimal price leveI for farrners and domestic users, as shown in the Planner's
problem, is the CG terrn that appears in the Planner's first order conditions. The large
'.1
and inefficient use of water by farrners affects the future availability of water and it might
even increase the probability of future shortages in their communities and surroundings20.
When farrners make the decision of whether to irrigate their crops or not and, if it is the
case, which kind of irrigation to use, they consider how much that will cost them, without
taking into account the increase in the probability of a future shortage. This extra cost, the
scarcity rent, should be added to the marginal cost of supplying water for an efficient pricing scheme, increasing the social gain that would come from it (figure 5).
20 According to USGS, aquifers' water leveIs are going down and these decreases might not be reversible.
20
FUNDAÇAO GETULIO VARCAS BIBLIOTECA MARIO HENRIQUE SIMONSr:N
•
•
•
•
•
•
•
•
•
•
•
•
•
•
•
•
•
•
•
•
•
•
•
•
•
•
•
•
•
•
•
•
•
•
•
•
•
•
•
•
•
•
•
•
•
•
•
•
•
•
•
•
•
,•
•
•
•
•
•
•
•
•
•
•
•
•
•
•
•
•
•
•
•
•
•
•
•
•
•
•
•
•
•
•
•
•
•
•
•
•
•
•
•
•
•
&
"
Ir
Price
~IC2 (locluding Scarcin· / ReDts)~
/f/'lCl
""
~
'/ /
p2
---»
pl
---~
ACl
~D
q2 ql
Quantity
Figure 5: The social gain of efficient (true marginal cost) pricing when taking the scarcity rent into
account.
In order to detennine the optimal price leveI of water one would then need a measure of
the scarcity rent. One way to do it would be to estimate the value attributed by users to
decreasing probabilities of future shortages of water. Griffin and Mjelde (2000) does an
interesting study based on a sample from seven Texas cities. The questionnaires sent
asked willingness-to-pay and willingness-to-accept kinds of questions. The study is for
urban areas. It could be use fuI to have those numbers for the state of California. Barakat
& Chamberlin (1994) is another reference on the subject.
Another way to think about (marginal) scarcity rents is to look at how much utility
(measured in tenns of dolIars) people would be losing by not having access to the last of
their desired galIons ofwater. This is exactly measured by u!( (" ,gi* ) , which in tum is
}..'
equal to the price consumers pay for water, PL, from the solution to the private decision
U
~'
,g') U~J
,gJ )model developed in section 3. Moreover, g = g 'V i, j E S , where S is
}..' )./
the set of people who face Pg; so the scarcity rent is the same for alI consumers that pay
the same price for the galIon of water.
If, during a shortage, there are price adjustments instead of rationing quantities, the total
marginal scarcity rent is given by
12
Pr P)[Xl
+ r)+-r)
r>r
where 1 is the total number of people in S, Pr is the probability of a shortage in period 't,
P w{'t) is the price of a galIon of water in period L and r is the interest rate21 .
The scarcity rent should be added to the marginal cost curve in figure 2 to generate what
would be an efficient pricing scheme. This true marginal cost curve (depicted in figure 3)
is not unique, though. As was argued in section 3, irrigation users can be associated with
21 Ifthere are rationings, though, the price ofwater no longer reflects the marginal benefit ofwater and the
scarci(v COSI would have to be estimated differently.
22
•
•
•
~
•
•
•
•
•
•
•
•
•
•
•
•
•
•
•
•
•
•
•
•
•
•
•
•
•
•
•
•
•
•
•
•
•
•
•
•
•
•
•
•
•
•
•
•
•
•
•
•
•
•
•
•
•
•
•
•
•
•
•
•
•
•
•
•
•
•
•
•
•
•
•
•
•
•
•
•
•
•
•
•
•
•
•
•
•
•
•
•
•
c
"
..
a higher cost curve than that of domestic water users. If we also take into consideration
that they may be paying below average cost of provision, the social gain from efficient
pricing can be even bigger (figure 6).
Price
:\ICi/~
:\ICd//
/ /
/
p3 _ .. _ .. _ .. _. ______________ .. ___ .. _.
p1 ACd
pl
q3q1 ql
Quantity
Figure 6: The social gain from efficient pricing taking into account extreme subsidies for farmers as welI as their (higher) true marginal cost.
We can see in the dark grey shaded are a the increase in welfare that could come from
charging the appropriate marginal cost (of extraction plus scarcity rent) for irrigation
water (MCi), as opposed to a water rate similar to that charged from domestic users.
It should be noted, though, that technological improvements could greatly alter this
picture by modifying the cost function that appears in the Planner Problem, C(gs, gL, Gr).
Innovation can play a role in both the supply and demand sides. If desalinization becomes
relatively cheap, depleted aquifers might not be as big a problem as they are today. If, on
the other hand, irrigation techniques become more efficient or crops are moditied in the
appropriate way, the amount of water demand might decrease enormously, giving water
reservoirs the time they need for recharging.
5. Conclusion
The future for water availability is uncertain. According to sev:eral studies, inc1uding
those done by USGS, periodic shortages tend to become more likely and longe r lasting.
Farmers use large quantities of water, so they toe would be hurt in the event of a serious
shortage. However, because of a free rider problem, this knowledge alone is not enough
to change their behavior.
In 1998, among the almost 20.000 farms in Califomia that used flooding irrigation, only
about 7,700 used some kind of conservation technique22. Among all farms in the state,
less than 11,000 implemented any kind of improvements (in terms of conservation of
energy or water) ln the previous tive years. At the same time, when looking at farms with
diminished crop yield resulting from irrigation interruption, they amount only to 1,242 in
Califomia in 1998. The possible causes for the interruption were: shortage of surface
water, shortage of ground water, irrigation equipment failure, energy cost, poor water
quality, cost of purchased water and "other". The category with the least number of farms
22 USDA, 1998.
24
•
•
•
•
•
•
•
•
•
•
•
•
•
•
•
•
•
•
•
•
•
•
•
•
•
•
•
•
•
•
•
•
•
•
•
•
•
•
•
•
•
•
•
•
•
•
•
•
•
•
•
•
•
•
•
•
•
•
•
•
•
•
•
•
•
•
•
•
•
•
•
•
•
•
•
•
•
•
•
•
•
•
•
•
•
•
•
•
•
•
•
•
•
s
~
•
included (only 56) was cost of purchased water, which suggests there is an incentive
problem going on with water use. There is room for social welfare improvements by
exploring the true marginal cost of supply.
Current welfare losses are associated not only with inefficient price leveIs, calculated
using average cost measures over marginal cost ones that would include scarcity rents,
but also with allocative problems among users. The estimated allocative inefficiency of
non-optimal relative prices is of about US$l O million per year for the EI Dorado Water
District alone, or the equivalent to 28 percent of their total revenues. Without further
technological innovation on either the supply or the demand side, it is clear that what is
charged for irrigation water should be higher than what is charged from residential
consumers. Even though precise numbers for marginal costs of extraction and scarcity
rents are not available, the use of estimates, like the ones presented in this paper, is possibk.
Note that I fone were to estimate how much farmers' profits would decline if the price for
their \\ ater supply were properly adjusted, the govemment could compensate them for
that h,~ and inefficiency would be eliminated, with a net gain to society.
The ne:\t steps for this research are: i) expand the data set in order to get more precise
estimates for the marginal cost of extraction; and ii) estimate scarcity rents, so as to get to
the oprimal price leveIs. Then it will be possible to quantify all losses associated with the
pricing schemes currently in place.
Appendix A - Documenting agricultural subsidies
There is not only one provi der of water in the State of Califomia. The Federal
Govemment's Bureau of Rec1amation plays a big role in supplying residents with water
from the Central VaUey Project (see CVP map). The State Govemment also has its own
project (State Water Project). But these sources don't usuaUy do business with consumers
directly. Most of the time they seU water to local Districts who, in tum, reseU it to final
users.
Even though I have read in numerous studies c1aims indicating that irrigation water is
heavily subsidized, I had not yet seen the numbers to prove it. So, for the past few months
I have been contacting several Water Districts in Califomia (inc1uding only those who
buy from the CVP, since most c1aims refer specificaUy to federal subsidies) gathering
information on how much they charge their users. For the year 2004, here is what I have
found so far:
Table A1: Uniform Rates (dollars per 1000 gallon5)
Range Average
Residential 0.62 - 2.89 1.76
Irrigation 0.05 - 0.23 0.17
Among the districts charging uniform rates, averages seem to indicate significant
subsidies toward farmers. This sort of calculation is not ideal, however, since many
Water Districts supply exclusively either to residential users (and commercial and
26
•
•
•
-
•
•
•
•
•
•
•
•
•
•
•
•
•
•
•
•
•
•
•
•
•
•
•
•
•
•
•
•
•
•
•
•
•
•
•
•
•
•
•
•
•
•
•
•
•
•
•
•
•
•
•
•
•
•
•
•
•
•
•
•
•
•
•
•
•
•
•
•
•
•
•
•
•
•
•
•
•
•
•
•
•
•
•
•
•
•
•
•
•
•
"
~
industrial) or to agricultural ones, and we cannot assume equal cost structures for all of
them23. It may be more inforrnative to look at Water Districts that provi de water to both
farrners and residential users. This is the case for the EI Dorado Irrigation District:
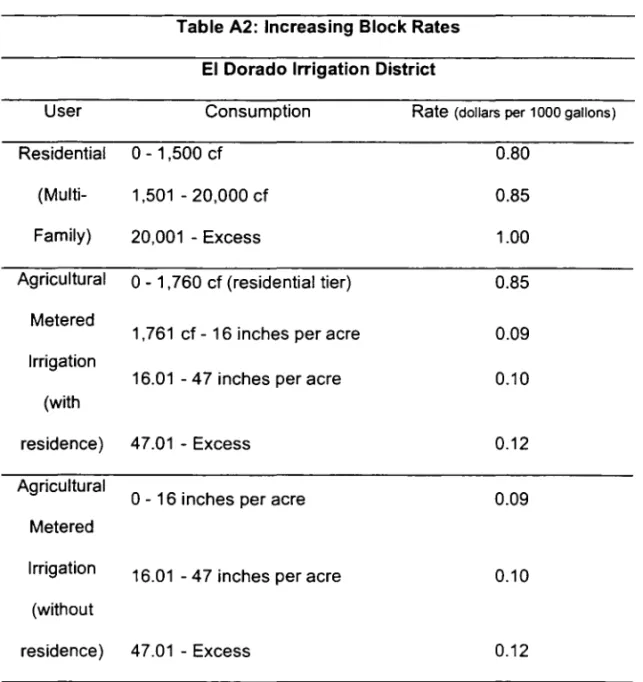
Table A2: Increasing Block Rates ElDorado Irrigation District
User Consumption Rate (dollars per 1000 gallons)
Residential
(Multi-Family)
Agricultural
Metered
Irrigation
(with
residence)
Agricultural
Metered
Irrigation
(without
0- 1,500 cf
1,501 - 20,000 cf
20,001 - Excess
0- 1,760 cf (residential tier)
1,761 cf - 16 inches per acre
16.01 - 47 inches per acre
47.01 - Excess
o -
16 inches per acre16.01 - 47 inches per acre
residence) 47.01 - Excess
0.80
0.85
1.00
0.85
0.09
0.10
0.12
0.09
0.10
0.12
In this case the subsidies appear beyond doubt. The rates charged from residential
consumers for their first 1500 gallons are about 800% higher than what is charged from
irrigation water.
23 That might not be a big problem though, because the rates shown here are charged just for water
consumption. There are sometimes several other service rates charged separately to cover costs associated with transport and delivery.
Just to give a final example of how much higher residential rates can be, here are some
numbers from the East Bay Municipal District. Notice how expensive the water is,
compared to what we have already seen above, even when non-potable:
Table A3: East Bay Municipal District
Rate for Potable Rate for Non-Potable
User Consumption Water ($ per 1000ga) Water ($ per 1000ga)
Single Family 1 - 172 gpd 2.05
173 - 393 gpd 2.55 2.05
394 - Excess 3.11
Multi-Family Ali water 2.66 2.13
Of course indivIduai districts alone are not necessarily representative of the whole
sample, so I am stiII working to put together more data from other districts in the State
that buy from CVP, and hopefulIy we wiII soon be able to look at a cIearer picture.
Appendix B - Estimating the Marginal Cost of Extraction
My initial estimate of marginal cost of extraction comes from the EI Dorado Irrigation
District, whose water rates are depicted in Table A2. It supplies both agricultural and
residential users and its 2003 Comprehensive Annual FinanciaI Report provides
information on pumping expenses (short run marginal cost) and expected capital
expenses (Iong run marginal cost). Pumping and transmission expenses are about 7% of
Operating Expenses net of depreciation, hydroelectric and recreation. 2004 figures are
28
•
•
•
•
•
•
•
•
•
•
•
•
•
•
•
•
•
•
•
•
•
•
•
•
•
•
•
•
•
•
•
•
•
•
•
•
•
•
•
•
•
•
•
•
•
•
•
•
•
•
•
..
•
•
•
•
•
•
•
•
•
•
•
•
•
•
•
•
•
•
•
•
•
•
•
•
•
•
•
•
•
•
•
•
•
•
•
•
•
•
•
•
•
•
•
•
•
not available yet, so 2003 values were used, since there is no evidence of significant
variation on this sort of expenses over the period of one year, and generated a US$1.8
million figure. The total amount of water supplied in 2003 was 34,000 acre-feet (or 11
million 1000g, since the water rates shown in Appendix A are measured in
dollarsll OOOg), so the short run marginal cost is of about $0.17/1 000g24.
The table below shows numbers taken out ofthe District's Capital Improvement Plan:
Table 81: Capital Expenses - EI Dorado Irrigation District (CIP)
Pump Station Treatment Facility Storage Tank Main Replacement
Year 2004 2004 2004 2004
Nominal Dollars Nominal Dollars Nominal Dollars Nominal Dollars 2004 $0 $0 $350,000 $350,000 $0 $0 $650,000 $650,000 2005 $50,000 $47,619 $100,000 $95,238 $50,000 $47,619 $15,000,000 $14,285,714 2006 $500,000 $453,515 $700,000 $634,921 $300,000 $272,109 $0 $0 2007 $700,000 $604.686 $2,000,000 $1,727,675 $1,500,000 $1,295,756 $0 $0 2008 $1,000,000 $822.702 $2.000,000 $1,645,405 $1,000,000 $822,702 $0 $0
2009 $0 $0 $3.000,000 $2,350,578 $0 $0 $0 $0 TOTAL $2,250,000 $1,928,523 $8,150,000 $6,803,817 $2,850,000 $2,438,187 $15,650,000 $14,935,714
Total Capital Expenses (2004 dollars) $26,106,241 Rental Price (r
=
5%, depreciation=
2.5%) $1,957,968Total capital expenses here represent 7 percent of accumulated assets. The rental price
divided by 7 percent of the water delivered that year produces an estimate for the long
run marginal cost of $2.68/1 OOOg, therefore the total marginal cost of extraction is
$2.85/1 OOOg.
242004 total raw supply is not available yet.