UNIVERSIDADE NOVA DE LISBOA
Faculdade de Ciências e Tecnologia
Departamento de Ciências e Engenharia do Ambiente
Assessment of Eutrophication Status of Two
Northern Irish Loughs
João Nuno Maximino Mimoso
Dissertação apresentada na Faculdade de Ciências e Tecnologia da
Universidade Nova de Lisboa para obtenção do grau de Mestre em
Engenharia do Ambiente, perfil Engenharia Sanitária
Orientador: Prof. João Gomes Ferreira
Resumo
A eutrofização das áreas costeiras é um problema global que afecta variados ecossistemas e actividades humanas em todo o mundo. O fenómeno da eutrofização tem vindo a aumentar substancialmente devido às actividades humanas. É causada pelo excesso de nutrientes e é identificada pelo surgimento de alguns sintomas. A avaliação proposta trata deste problema de uma forma específica. A metodologia “Assessment of Estuarine Trophic Status - ASSETS” será aplicada a dois estuários da Irlanda do Norte, de forma a classificar o seu estado de eutrofização e permitir uma comparação com outros métodos existentes. Os dados disponíveis para estes sistemas permitiram a implementação desta metodologia inovadora, que permite obter uma classificação baseada em pressão, estado e resposta. Assim, considerando as influências das actividades antropogénicas sobre as áreas costeiras, examinando os sintomas específicos dos sistemas aquáticos e analisando os indicadores para uma resposta futura, é possível atingir resultados consistentes relativamente à qualidade da água nos estuários e, consequentemente, identificar as medidas mais adequadas de forma a efectuar a sua gestão. Controlando o enriquecimento em nutrientes das áreas costeiras é possivel evitar problemas, como por exemplo, morte de peixes, interdição de aquacultura, perda ou degradação da vegetação dos leitos aquáticos e desaparecimento de bivalves e outros organismos bênticos. Como resultado, diversos custos sociais e económicos podem ser reduzidos. A metodologia ASSETS foi aplicada aos dois sistemas com sucesso, classificando ambos os estuários, Strangford Lough e Belfast Lough como “Moderate”. Estas classificações não mudarão a classificação da sua qualidade da água, sobre a Directiva Quadro da Água, Directiva do Tratamento das Águas Residuais Urbanas ou Directiva Nitratos, no entanto, é uma ferramenta que permite guiar os decisores políticos na tomada de decisões mais eficientes em termos de gestão futura dos sistemas.
Abstract
Coastal eutrophication is a global problem which affects many natural systems and human activities throughout the world. The phenomenon of eutrophication has increased substantially due to human activities. It is caused by excess nutrients and is identified by the emergence of some symptoms. The proposed assessment will address this problem in a more specific way. The Assessment of Estuarine Trophic Status (ASSETS) methodology is going to be performed to two Northern Irish Loughs in order to rank their eutrophication status and allow a comparison with other existing methods. The data available for these systems allowed the implementation of this innovative methodology, which can provide a classification based on pressure, state and response. Thus, by considering the influences of anthropogenic activities over the coastal areas, examination of specific symptoms of the water systems and analyzing the indicators for future response, it is possible to achieve consistent results regarding the quality of the water in the “loughs” and, consequently, identify the most adequate tools to enable their proper management. By controlling the nutrient enrichment of coastal areas it is possible to avoid problems, such as, fish kills, interdiction of shellfish aquaculture, loss or degradation of sea grass beds and smothering of bivalves and other benthic organisms. As a result, many social and economical costs can be reduced. ASSETS was successfully applied to both Strangford Lough and Belfast Lough, classifying them as “Moderate”. This classification will not change their water quality status under the Water Framework Directive, Urban Wastewater Treatment Directive or Nitrates Directive, however, it is a tool to guide policy makers into better decisions in terms of future management.
Index
1 Introduction... 10
2 State of the Art ... 12
2.1 OSPAR Common and Comprehensive Procedure... 13
2.2 EPA National Coastal Assessment ... 14
2.3 NOAA National Estuarine Eutrophication Assessment / ASSETS... 15
3 Approach... 17
3.1 Understanding Eutrophication ... 17
3.2 Current Legislation ... 18
3.2.1 Urban WasteWater Treatment Directive (UWWTD) ... 18
3.2.2 Nitrates Directive ... 20
3.2.3 Water Framework Directive (WFD)... 20
3.2.4 Marine Strategy Framework Directive ... 21
3.3 Eutrophication in Northern Ireland... 22
4 Methodology... 26
4.1 Overall Human Influence (OHI)... 28
4.2 Overall Eutrophic Condition (OEC) ... 31
4.3 Determination of Future Outlook (DFO)... 34
5 Spatial Domain... 36
6 Results... 38
6.1 Strangford Lough ... 38
6.1.1 Description of the Lough ... 38
6.1.2 Homogeneous Areas ... 39
6.1.3 Data Completeness and Reliability... 40
6.1.4 Overall Human Influence... 41
6.1.4.1 Susceptibility... 41
6.1.4.1.1 Dilution Potencial ... 41
6.1.4.1.2 Flushing potential... 43
6.1.4.2 Nutrient Inputs ... 45
6.1.5 Overall Eutrophic Condition... 50
6.1.5.1 Primary Symptoms... 50
6.1.5.1.1 Chlorophyll a ... 50
6.1.5.1.2 Macroalgae... 53
6.1.5.2 Secondary Symptoms... 54
6.1.5.2.1 Dissolved Oxygen... 54
6.1.5.2.2 Nuisance and Toxic Blooms ... 57
6.1.5.2.3 Submerged Aquatic Vegetation ... 58
6.1.6 Determination of Future Outlook... 59
6.1.6.1 Climate change... 63
6.1.7 Final Score ... 64
6.1.8 Conclusions... 65
6.2 Belfast Lough... 67
6.2.1 Description of the Lough ... 67
6.2.2 Homogeneus Areas ... 68
6.2.4 Overal Human Influence... 69
6.2.4.1 Susceptibility... 69
6.2.4.1.1 Dilution Potential ... 69
6.2.4.1.2 Flushing Potential ... 70
6.2.4.2 Nutrient Inputs ... 71
6.2.5 Overal Eutrophic Condition... 76
6.2.5.1 Primary Symptoms... 76
6.2.5.1.1 Chlorophyll a ... 76
6.2.5.1.2 Macroalgae... 81
6.2.5.2 Secondary Symptoms... 82
6.2.5.2.1 Dissolved Oxygen... 82
6.2.5.2.2 Nuissance and Toxic Blooms... 85
6.2.5.2.3 Submerged Aquatic Vegetation ... 85
6.2.6 Determination of Future Outlook... 86
6.2.6.1 Climate Change... 89
6.2.7 Final Score ... 89
6.2.8 Conclusions... 90
7 Conclusion ... 92
8 Bibliography ... 94
Index of Figures
Figure 1 – Conceptual diagram comparing a healthy ecosystem without signs of increased eutrophication and another ecosystem exhibiting eutrophic symptoms ... 17 Figure 2 – Indicators used in the methodology in the UK for definition of sensitive areas ... 19 Figure 3 – Definition of the River Basin Districts in Ireland ... 21 Figure 4 – Overall simplified classification of the status of water quality in the North Eastern River Basin District of Northern Ireland ... 23 Figure 5 – Surface water body overall status under the WFD, for Northern Ireland, where dark blue color is high, light blue is good, yellow is moderate, orange is poor and red is bad ecological status ... 25 Figure 6 – Scheme of the pressure-state-response approach adopted by the ASSETS methodology ... 27 Figure 7 – Decision rules for the determination of dilution potential... 28 Figure 8 - Decision rules for the determination of flushing potential... 28 Figure 9 – Matrix used in the determination of the susceptibility of the water body to retain or flush nutrient loads ... 29 Figure 10 - Matrix used for the determination of the OHI score of the water body in the ASSETS methodology... 30 Figure 11 – Description of the primary and secondary symptoms used for the
determination of OEC in ASSETS ... 31 Figure 12 – Description of the ratings used in ASSETS, in order to determine the
Figure 24 - Winter DIN for the Quoile Pondage. Points are the mean of all samples in
each sampling station. For both situations error bars are presented ... 50
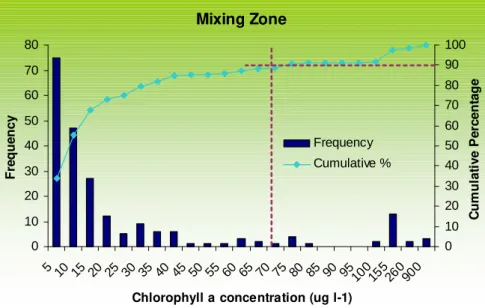
Figure 25 – Frequency distribution for Chlorophyll in the mixing zone in Strangford Lough. ... 51
Figure 26 - Frequency distribution for Chlorophyll in the seawater zone in Strangford Lough. ... 51
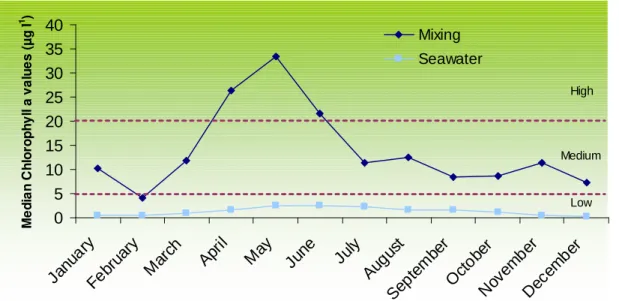
Figure 27 – Annual cycle of chlorophyll a in the two zones of Strangford Lough. ... 52
Figure 28 - Zones of influence of each sampling station in the mixing zone, calculated with the Thiessen Polygons Method. ... 53
Figure 29 - Frequency distribution for dissolved oxygen in the mixing zone in Strangford Lough. ... 55
Figure 30 - Frequency distribution for dissolved oxygen in the Seawater zone in Strangford Lough. ... 55
Figure 31 – Dissolved oxygen for the north of Strangford Lough. Data refers to samples from the ECWMP sampling station... 56
Figure 32 - Dissolved oxygen for the south of Strangford Lough. Points are the mean of all samples in the ECWMP sampling stations. Error bars are presented... 56
Figure 33 - Dissolved oxygen for the Quoile Pondage. Points are the mean of all samples in each sampling station (TSS and ECWMP). For each station, error bars are presented.57 Figure 34 - Current Status and Proposed Objectives for River Water Bodies in the Strangford Management Area 2008-2027 (MEP and GEP are Moderate and Good Ecological Potential, respectively)... 59
Figure 35 - Current Status and Proposed Objectives for Coastal Water Bodies in the North Eastern River Basin District 2008-2027... 60
Figure 36 - Location of the sampling stations and surface depths of Belfast Lough... 67
Figure 37 - Differences in water temperature in Strangford Lough, near the surface (up) and near the bottom (down) ... 70
Figure 38 - Water residence times in Belfast Lough, near the surface (up) and near the bottom (down)... 71
Figure 39 – Total DIN loadings to Belfast Lough by source... 72
Figure 40 - Total DIP loadings to Belfast Lough by source ... 72
Figure 41 – Loading of ammonium, nitrate and phosphate from the fertilizer plant into Belfast Lough, before its closure ... 72
Figure 42 – Soil uses in the catchment of Belfast Lough ... 73
Figure 43 – Total DIN loadings to Inner and Outer Belfast Lough... 75
Figure 44 - Total DIP loadings to Inner and Outer Belfast Lough ... 75
Figure 45 - Frequency distribution for Chlorophyll in the mixing zone in Belfast Lough. ... 77
Figure 46 – Frequency distribution for Chlorophyll in the seawater zone in Belfast Lough. ... 77
Figure 47 - Spring and summer chlorophyll a concentrations in inner Belfast Lough, taken from the ECWMP Routine Monitoring Station ... 78
Figure 48 – Annual cycle of chlorophyll a values for the two zones of Belfast Lough. .. 78
Figure 49 – Distribution of concentration levels of chlorophyll for the year of 1995 in Belfast Lough... 79
Index of Tables
Table 1 – Categories of information used in the Comprehensive Procedure of OSPAR. 13
Table 2 – Example of a final score table for OSPAR Comprehensive Procedure... 14
Table 3 – Final result and the criteria used in the classification for the EPA NCA methodology. ... 14
Table 4 – Criteria used by the UWWTD to determine sensitive areas... 19
Table 5 - Criteria used by the Nitrates Directive to determine vulnerable zones. ... 20
Table 6 – Thresholds and categories used to rate the nutrient loads to the system ... 30
Table 7 – Categories for primary and secondary symptoms according to their expression value in the system... 33
Table 8 - Physical Properties of Strangford Lough ... 39
Table 9 – Results of the data completeness and reliability for Strangford Lough... 40
Table 10 – Characteristics of the Wastewater Treatment Works which discharge in Strangford Lough, until the year of 2004... 46
Table 11 – Nitrogen Loads from the main anthropogenic sources to Strangford Lough . 48 Table 12 – Results of the ASSETS index application for chlorophyll a in Strangford Lough. ... 53
Table 13 – Results of the ASSETS index application for primary symptoms in Strangford Lough. ... 54
Table 14 - Results of the ASSETS index application for dissolved oxygen in Strangford Lough. ... 57
Table 15 - Results of the ASSETS index application for secondary symptoms in Strangford Lough. ... 59
Table 16 - Census Populations 1991, 2001 and 2008 estimate for District Council Areas, part or all of which lie within NERBD ... 62
Table 17 - Modifications to the major Wastewater Treatment Works discharging in the rivers of the catchment area of Strangford Lough. ... 63
Table 18 – Summary of the results obtained by the application of ASSETS methodology to Strangford Lough. EAR: Estuary Aggregation Rules; PSM: Primary Symptoms Method; SSM: Secondary Symptoms Method. ... 65
Table 19 - Physical Properties of Belfast Lough ... 68
Table 20 – Results of the data completeness and reliability for Belfast Lough ... 69
Table 21 – Characteristics of the Wastewater Treatment Works which discharge into Belfast Lough... 74
Table 22 - Nitrogen Loads from the main anthropogenic sources to Belfast Lough... 76
Table 23 – Results of the ASSETS index application for chlorophyll a in Belfast Lough. ... 81
Table 24 - Results of the ASSETS index application for primary symptoms in Belfast Lough. ... 82
Table 25 - Results of the ASSETS index application for secondary symptoms in Belfast Lough. ... 86
1 Introduction
Coastal eutrophication is a global problem which affects many natural systems and human activities throughout the world. It is a phenomenon which has increased substantially due to human activities, it is caused by excess nutrients and is identified by the emergence of some symptoms, such as, organic matter enrichment, low water clarity, abundance of algae and to a higher extent, fish kills, interdiction of shellfish aquaculture, loss or degradation of sea grass beds and smothering of bivalves and other benthic organisms. As a result, many social and economical costs can be reduced. The proposed dissertation will address this problem in a more specific way.
The main objective of this work is to apply the Assessment of Estuarine Trophic Status (ASSETS) methodology to two Irish Loughs: Strangford Lough and Belfast Lough. They are currently subject to several monitoring campaigns due to the obligation of Northern Ireland to comply with the Urban Wastewater Treatment Directive, Nitrates Directive and Water Framework Directive. Therefore, there is data available in order to rank their eutrophication status and there are other methods which are used by these Directives, which can be equally involved in a comparison, for these specific scenarios. The most innovative aspect of this method is the classification based on pressure, state and response of the estuaries, in order to achieve an overall grade for eutrophication. Thus, by considering the influences of anthropogenic activities over the coastal areas, examination of specific symptoms of the water systems and analyzing the indicators for future response, it is possible to achieve consistent results regarding the quality of the water in the Loughs, and consequently, identify the most adequate tools to enable their proper management.
The first chapter consists of this introduction, which summarizes the objectives of the work and provides a broader understanding of the overall structure.
The second chapter provides an overview of the existing methodologies in terms of evaluation of Eutrophication and quantitative and qualitative characterization of coastal water bodies.
In the third chapter a more detailed description of the phenomenon of eutrophication is given, together with a description of the approach adopted.
In the fourth chapter there will be a description of the methodology used to conduct this assessment, together with the tools which will be useful to understand the simulation of the eutrophication for the two Loughs.
The sixth chapter is where the results of the application of the assessment are presented and it is therefore, the core of this work. Firstly, Strangford Lough will be assessed, followed by Belfast Lough. For each Lough, a description of their physical characteristics will be given, followed by the analysis of the data and the assessment of Pressure-State-Reponse, finishing with the final result.
2 State of the Art
At an international level, the United Nations Convention on Law of the Sea is the basic legal framework that governs the uses of the oceans and seas. At a national or regional level, several initiatives have been developed worldwide, such as the Oceans Policy in Australia, the Oceans Act in Canada and the United States, the National Water Act and Coastal Management Act in South Africa, several legislation addressing environmental protection in China and the Water Framework Directive and European Marine Strategy in Europe (Borja et al., 2008). All these initiatives aim to protect and restore the oceans and coastal areas, by promoting a sustainable use of the seas and conservation of marine ecosystems. Avoiding coastal eutrophication is a phenomenon which is fundamental in achieving the goals proposed by national and international regulations and its assessment is often one of the biggest challenges faced by responsible agencies.
Historically, the analysis of eutrophication in estuaries and coastal areas has been quantified by the classical freshwater approach, also known as Phase I, which adopts the following methodology (Bricker et al., 2003):
- measurement of variables (transparency, nutrients and chlorophyll a); - establishment of a nutrient-based classification system.
This approach derives from freshwater methods, which are not necessarily appropriate to the complexity of coastal systems. Also, as more developments in this area emerged, it has been shown that high nutrient concentrations are not an obligatory indicator of eutrophication and low concentrations do not necessarily indicate absence of eutrophication (Bricker et al., 2003), because systems show widely varying responses to similar nutrient forcing (Xiao et al., 2007). This conclusion was enough to determine the fragile structure of the methodology adopted and that new methods were needed.
More robust methods have been researched, which use several parameters in order to characterize physically and biologically the estuarine and coastal systems. Currently, there are three types of methodologies most commonly used in the European Union and the United States, to assess the trophic status of coastal waters. These methodologies which are used worldwide are:
- OSPAR Common and Comprehensive Procedure; - EPA National Coastal Assessment (NCA);
- NOAA National Estuarine Eutrophication Assessment (NEEA) / ASSETS.
2.1 OSPAR Common and Comprehensive Procedure
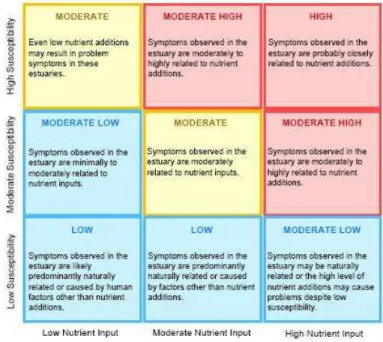
OSPAR is the mechanism by which fifteen Governments of the western coasts and catchments of Europe, together with the European Community, cooperate to protect the marine environment of the North-East Atlantic (OSPAR Commission, 2009). In order to assist their members in identifying areas where nutrient inputs may cause pollution, and to periodically assess the eutrophication status of the OSPAR maritime area, OSPAR developed a common assessment framework: the OSPAR Common and Comprehensive Procedure. This is a two step assessment process which is used in the European Union. The Common Procedure is a primary step which consists of a screening process in order to enable regional comparisons of eutrophication status by characterizing a water body as a problem area, an area with potential problems or a non-problem area. The Comprehensive Procedure is a second step which is applied to all the areas classified as problem areas or potential problem areas. The assessment of eutrophication status is based on four categories of information, which are described in Table 1.
Table 1 – Categories of information used in the Comprehensive Procedure of OSPAR.
Category I Causative Factors including sources of nutrients such as riverine loading of TN, TP, winter DIN and DIP, N/P-ratios
Category II
Direct Effects of nutrient enrichment including growing season maximum and mean chlorophyll a, phytoplankton indicator species, macrophytes, including macroalgae, microphytobenthos
Category III
Indirect Effects of nutrient enrichment including growing season degree of oxygen deficiency, changes/kills in zoobenthos and fish kills, changes of organic matter, ecosystem community structure
Category IV Other Possible Effects of nutrient enrichment such as algal toxins DSP/PSP mussel infection events
Table 2 – Example of a final score table for OSPAR Comprehensive Procedure.
Category I Category II Category III Category IV Classification
+ + + + Problem Area
- + + + Problem Area
+ - - - Potencial Problem
Area
- - - - Non Problem Area
The approach adopted by this methodology, makes it that the region-specific characteristics play a role in explaining the results of the area classification and are essential for the definition of a final classification.
2.2 EPA National Coastal Assessment
The EPA NCA is used in the United States as an instrument to fulfill specific requirements of the Clean Water Act. This document requires EPA to report periodically on the condition of the nation’s waters. In the first report presented, the eutrophication indicator was taken from the NOAA National Estuarine Eutrophication Assessment. In the second report the indicator used is roughly equivalent to NEEA / ASSETS eutrophication indicator. The necessary data used as input for the characterization of the indicators, is originated from a sampling campaign performed once a year in all estuaries or coastal water bodies included in the study. The indicators used are: nitrogen, phosphorous, chlorofill a, water clarity and dissolved oxygen.
The classification of each indicator is rated as poor, fair or good. The scores obtained by each indicator are then combined in order to reach a specific classification for a site, or a more global classification for a region, based on the sites related to their specific region (Table 3).
Table 3 – Final result and the criteria used in the classification for the EPA NCA methodology.
Rating Site Criteria Region Criteria Good A maximum of one indicator is
fair and no indicators are poor.
Less than 10% of coastal waters are poor and less than 50% are in combined poor and fair condition.
Fair One of the indicators is rated poor
or two or more indicators are rated fair.
10 to 20% of coastal waters are in poor condition or more than 50% are in combined fair and poor condition.
Poor Two or more of the five indicators
are rated poor.
Although the final criteria is region-specific and based on the sensitivity of a system to nutrient inputs, it does not include an evaluation of influencing factors.
2.3 NOAA National Estuarine Eutrophication Assessment / ASSETS
The NOAA National Estuarine Eutrophication Assessment (NEEA) is used in the United States and relies on the following diagnostic tools in order to evaluate eutrophication status:
- influencing factors;
- overall eutrophic condition; - future outlook.
Factors influencing eutrophication are nitrogen load and the estuary’s susceptibility to nitrogen, overall eutrophic condition is based in the analyses of primary and secondary symptoms (chlorophyll a, Macroalgae, Dissolved oxygen, submerged aquatic vegetation and nuisance toxic blooms) and the future scenario is calculated according to the changes in the nutrient loads and susceptibility to them.
ASSETS is an extension of the NEEA methodology which aims to combine the final results into one overall rating. The classification grades obtained for the systems evaluated are: high, good, moderate, poor or bad. It also, incorporates some significant changes, such as, the introduction of a comparison between anthropogenic nutrient loading and natural background concentrations and the refinement of the quantitative criteria for classification of system state based on different symptoms, including the combination of relational databases, geographical information systems and statistical criteria. Therefore, the combination of these two methodologies provides a consistent assessment procedure, which can harmonize the work performed in the European Union and the United States and at the same time converge to the objectives enclosed in the Clean Water Act and the European Union Water Framework Directive.
The most recent challenge has been the development of the NOAA National Estuarine Eutrophication Assessment Update Program which aims to improve monitoring and assessment efforts of the previous NEEA and ASSETS, by forming three workgroups: Typology, Monitoring, assessment and classification and Modeling and management. The typology working group intends to develop a type classification with the purpose of determining type specific indicator variables and thresholds. The monitoring, assessment and classification working group addresses the eutrophic conditions, causes and future outlook in order to introduce additional modifications and intends to develop a human use / socioeconomic index. The modeling and management working group focus on developing a better understanding of the complex system of nutrient input / water body response to ensure a successful management of the problems which arise. All these measures encompassed in the update program will result in improvements to the assessment method.
ASSETS in the following aspects: the concentration of DIN and DIP are taken as indicators of eutrophication and there is no differential weighting across indicators. Also, the OSPAR procedure fails to set thresholds for indicators concern. In EPA NCA only acutely degraded water quality is characterized during the monitoring period. It does not identify consistently poor conditions throughout longer periods. Besides this, it has a limited set of parameters, which do not include biological indicators neither nutrient concentrations.
3 Approach
3.1 Understanding Eutrophication
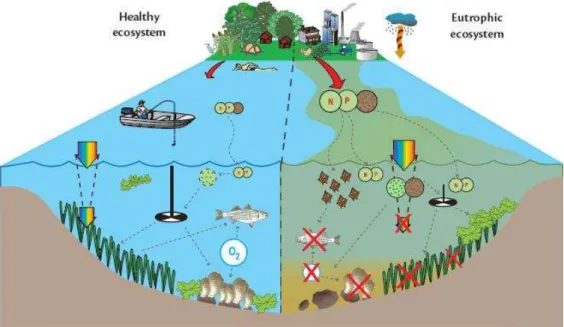
There are several definitions of eutrophication, however, for the purpose of this dissertation it will be defined as “a natural process by which productivity of a water body, as measured by organic matter, increases as a result of increasing nutrient inputs. These inputs are a result of natural processes but in recent decades they have been greatly supplemented by various human related activities” (ASSETS, n.d). Several nutrient sources are resulting from these activities, such as, agriculture, urban runoff, wastewater treatment plants and consumption of fossil fuels, which by one way or another, might end up in the aquatic systems accelerating eutrophication. In Figure 1, it is possible to observe a conceptual diagram which provides the comparison between a system without any signs of increased eutrophication and a similar system exhibiting eutrophic symptoms.
Figure 1 – Conceptual diagram comparing a healthy ecosystem without signs of increased eutrophication and another ecosystem exhibiting eutrophic symptoms (Bricker et al., 2007).
In healthy ecosystems, nutrient inputs, occur at a rate that stimulates a level of macroalgal and phytoplankton (chlorophyll a) growth in balance with grazer biota1. A low level of chlorophyll a in the water column helps keep water clarity high, allowing light to penetrate deep enough to reach submerged aquatic vegetation. Low levels of chlorophyll a and macroalgae result in dissolved oxygen levels most suitable for healthy fish and
shellfish so that humans can enjoy the benefits that a coastal environment provides (Bricker et al., 2007).
In an eutrophic ecosystem, increased sediment and nutrient loads from farming, urban development, water treatment plants and industry, in combination with atmospheric nitrogen, help trigger both macroalgae and chlorophyll a blooms, exceeding the capacity of grazer control. These blooms can result in decreased water clarity, decreased light penetration, decreased dissolved oxygen, loss of submerged aquatic vegetation, nuisance and toxic algal blooms and the contamination or die off of fish and shellfish (Bricker et al., 2007).
In terms of the nutrients involved, the most commonly discussed are nitrogen and phosphorous, however, other nutrients, such as, carbon and silica, may affect the onset of symptoms, but less knowledge exist at the moment, concerning their role (Bricker et al., 2007). A way to evaluate the level of eutrophication of an aquatic system is not only by looking at its status but also considering the capacity to assimilate, or inherent ability to absorb nutrients. Each system can react differently to similar inputs of nutrients.
The more sensitive to nutrients systems are, the higher the possibilities of being adversely affected, in terms of, even a slight increase in nutrients, by common maritime related activities, such as, commercial and recreational fishing, boating, swimming and tourism.
The impacts of eutrophication are interrelated and usually viewed as having a negative effect on water quality, ecosystem health, and human uses. Management concerns should address the human, or human-related activities, portion of nutrient additions insofar as the additions are detrimental to the environment, having into consideration the characteristics of the water body which is being managed.
3.2 Current Legislation
In 1991 the European Union (EU) introduced legislation dealing with the trophic status of estuaries and coastal waters. The Urban Waste Water Treatment Directive (91/271/EEC) deals with the relationship between eutrophication and urban waste water discharges. A similar directive, the Nitrates Directive (91/676/EEC), specifically relates to eutrophication resulting from nitrate inputs. In 2000 the Water Framework Directive (2000/60/EC) was launched, which establishes a legal framework to protect and restore clean water access in Europe. In 2008 the Marine Strategy Framework Directive (2008/56/EC), which determines deadlines for countries to achieve or maintain good environmental status of their waters, was released.
3.2.1 Urban WasteWater Treatment Directive (UWWTD)
Table 4 – Criteria used by the UWWTD to determine sensitive areas.
Directive Classification Type of Water Body Criteria
Sensitive areas
Freshwater lakes, other freshwater bodies, estuaries, coastal waters and marine waters
Surface freshwaters
- Eutrophic conditions - System with poor
water renewal
- High nutrient
discharge
- Nitrate > 50 mg.l-1 UWWTD
Less sensitive areas
Estuaries and coastal waters
- Good water exchange - Not subject to
eutrophication
- Not subject to oxygen depletion
This directive states that where a water body is found to be eutrophic or sensitive, certain management strategies must be implemented. It requires that suitable treatment must be introduced for qualifying sewage works (those with a Population Equivalent higher than 10 000) if the waters to which they discharge are classified as “sensitive”. Also, Trophic Status Studies are required under this Directive.
However, the definitions of “sensitive” refer, above all, to the potential for adverse effects to occur, caused by eutrophication arising from elevated nutrient inputs. These definitions contain several aspects which are left open to interpretation by Member States. In the United Kingdom guidance was issued for identifying sensitive areas under UWWTD in March 1993. Supplementary guidance was issued in May 2002 (UK National Report, 2008). For marine waters, the guidance is aligned closely with the OSPAR Common Comprehensive Procedure, whose methodology indicators used, are outlined in Figure 2.
In order to determine whether a water body is sensitive or a problem area, the methodology formerly described for the OSPAR Procedure, is applied.
3.2.2 Nitrates Directive
The waters may be identified as “vulnerable” under this Directive, concerning pollution by nitrates from agricultural sources, if found to be eutrophic or likely to become eutrophic, in case protective action is not taken. The criteria used by the Nitrates Directive to determine whether a water body is vulnerable or not, is presented in Table 5.
Table 5 - Criteria used by the Nitrates Directive to determine vulnerable zones.
Directive Classification Type of Water Body Criteria
ND Vulnerable zones
Surface freshwaters
Freshwater lakes, other freshwater bodies, estuaries, coastal waters and marine waters
- Nitrate > 50 mg.l-1
- Eutrophic conditions
In simple terms, the Nitrates Directive requires that appropriate controls on agricultural inputs of nitrate must be put in place within the catchment area of any water body classified as “vulnerable”.
Similarly, to the UWWTD, the definitions of “vulnerable” refer, mainly, to the potential for adverse effects to occur, caused by eutrophication arising from elevated nutrient inputs, which leave those definitions open to interpretation by Member States.
3.2.3 Water Framework Directive (WFD)
Figure 3 – Definition of the River Basin Districts in Ireland (NIEA, 2008a).
The WFD also establishes specific deadlines for the protection of aquatic ecosystems. The most important objective within the European Water Framework Directive is to achieve a “good ecological status” (GES) for all surface waters and groundwaters, by 2015. A surface water body is a section of a river, a lake, transitional or coastal waters. Transitional waters connect freshwaters and marine waters. Some methodologies have been developed for assessing GES within natural water bodies, in which the ecological status is a perceived or measured deviation from a reference condition (Borja et al., 2008).
The WFD also considers “Heavily modified water bodies” (HMWB), which are water bodies resulting from physical alterations by human activities, which substantially change its hydrogeomorphological character, such as harbours or weirs. In implementing the WFD, environmental managers are required to assess the status of HMWB in terms of achieving “Good Ecological Potential” (GEP). Ecological Potential means that it is expected the water body to achieve the biology that can be achieved given its changed conditions. Separate and less stringent goals are set for these situations.
The final result of the systems classifies the systems into five grades: High, Good, Moderate, Poor and Bad. This classification can then be added the ecological status or potential. The requirements for achieving the ecological status or potential are defined in an Annex to the Directive.
3.2.4 Marine Strategy Framework Directive
This Directive establishes a framework within which Member States shall take the necessary measures to achieve or maintain good environmental status in the marine environment by the year 2020 at the latest. This is achieved by a two stage approach, which consists of:
The preparation phase establishes deadlines for the delivery of current status of the water bodies, as well as, targets expected. The programme of measures relate to adequate actions to be taken in order to achieve or maintain good environmental status and the entry into operation of the programme.
The determination of a set of characteristics for good environmental status is conducted on the basis of the qualitative descriptors, indicative lists of elements and pressures or impacts of human activities in each marine region or sub region, listed in the Annexes of the Directive. In Annex I, eutrophication is addressed specifically, as a qualitative descriptor, when it is mentioned “Human-induced eutrophication is minimised, especially adverse effects thereof, such as losses in biodiversity, ecosystem degradation, harmful algae blooms and oxygen deficiency in bottom waters”, which is a different approach than the ones adopted by the other Directives.
3.3 Eutrophication in Northern Ireland
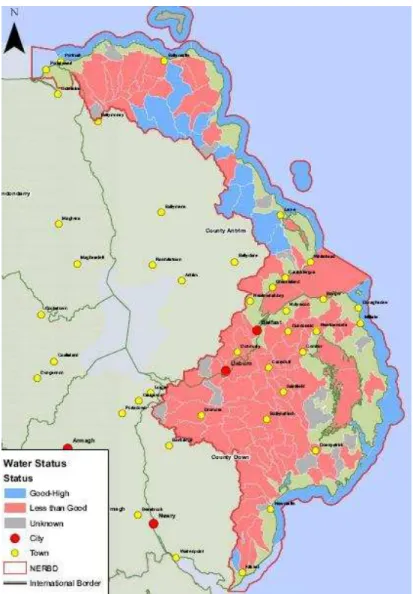
Figure 4 – Overall simplified classification of the status of water quality in the North Eastern River Basin District of Northern Ireland (NIEA, 2008j).
Considering that in recent years the phenomenon of eutrophication has become more serious, mainly due to agriculture and development pressures, in Northern Ireland six tidal waters and sea Loughs were identified, where marine eutrophication may justify the designation of their catchment as Nitrate Vulnerable Zones. These were (Foy & Girvan, 2004):
The two areas discussed in this assessment are Strangford and Belfast Lough. Both of them are represented in this list, as well as their transitional water bodies: Quoile Pondage and Tidal Lagan, respectively.
The requirement for designation depends on the vulnerability of these waters to eutrophication and that a significant proportion of the nitrate input originates from agricultural sources. To date this significant proportion has been taken to be 20% of the annual input of nitrate (Foy & Girvan, 2004). It should be noted that all the inflowing rivers to the tidal waters in Northern Ireland were in compliance with the standards for concentration of nitrate in surface waters as set by the Nitrates Directive (Foy & Girvan, 2004).
In relation to the UWWTD application, the last report performed in 2005 recommended eleven new Sensitive Area identifications: eight freshwater areas and three coastal waters. These new identifications will mean that over 80% of the total land area of Northern Ireland drains into water bodies that are sensitive. This correlates closely with the land area draining to polluted waters under the Nitrates Directive (EHS, 2005b).
When analysing the areas involved in this assessment, in Strangford Lough, only the North part was subject to this classification and the same for the inner part of Belfast Lough.
Figure 5 – Surface water body overall status under the WFD, for Northern Ireland, where dark blue color is high, light blue is good, yellow is moderate, orange is poor and red is bad ecological status (Water
Framework Directive Map in Northern Ireland, 2009).
4 Methodology
The methodology used was the Assessment of Estuarine Trophic Status (ASSETS), which can be applied to estuaries and coastal areas in order to rank their status and address management options. Most of the concepts have derived from the United States National Estuarine Eutrophication Assessment (NEEA), as described in previous chapters.
This methodology has been applied to several estuaries and coastal areas around the world and it is based on a logical stepwise process which combines three indices, calculated from the datasets available, in order to assess the eutrophication status.
The first step is to perform a physical classification of the system, with the objective of dividing it into zones with similar characteristics. For this method there is a maximum of three homogeneous zones based on salinity. These are:
- Tidal freshwater (zone with less than 0,5 psu2); - Mixing (zone with values between 0,5 and 25 psu); - Seawater (zone with more than 25 psu).
Each salinity zone is calculated supported on the measured salinity values representative of that area and on the results obtained from the sampling stations.
The second step is to validate the data available in terms of completeness and reliability, with the objective of interconnecting the spatial and temporal quality of the datasets (completeness) and the confidence in the results (reliability).
The data used in this method was obtained from the sampling campaigns performed in former Trophic Status Studies, meteorological data and in situ monitoring stations. The high amount of data available is mainly extracted using the BarcaWin2000 software. This tool uses databases and combines them in an organised and structured way, so that the final output can be exported to Excel and transformed into valuable information.
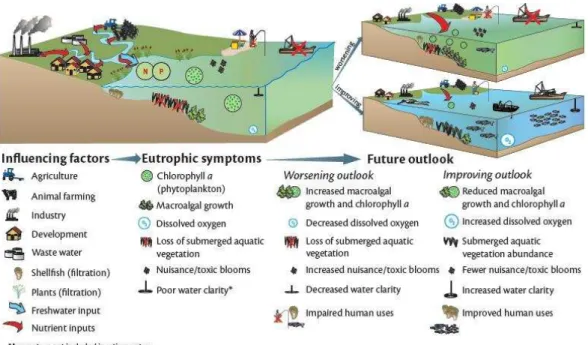
The third step is to calculate the eutrophication indices, based on the validated data and according to each homogeneous zone found in the system. The schematic representation of the three indices used in the ASSETS methodology, is presented in Figure 6.
Figure 6 – Scheme of the pressure-state-response approach adopted by the ASSETS methodology (Bricker et al., 2007).
The three indicators used by this methodology are based on influencing factors, eutrophic symptoms and future outlook which depend on quantitative components, field data, models and expert knowledge in order to define them. The influencing factors are the physical, hydrologic and anthropogenic factors which influence water quality and are defined in this method as Overall Human Influence (OHI). The eutrophic symptoms are a subset of five parameters whose concentration, spatial coverage and frequency of occurrence are representative of the eutrophic condition of the estuary or coastal system. This diagnostic tool is characterized in ASSETS as Overall Eutrophic Condition (OEC). Finally, the future outlook tries to forecast the behaviour of the system in terms of eutrophic conditions, by combining its susceptibility with the predicted future nutrient loads, to determine whether these conditions will improve or worsen.
The final step is to combine the three components described above in order to obtain a single overall score for each system, which may fall into one of five categories: High, Good, Moderate, Poor or Bad. This combination is performed through a matrix which is described in Appendix I. The categories are colour coded following international convention and provide a scale for setting reference conditions for different types of systems. The high grade will not be assigned if the expected future outlook is for worsening conditions, but a system may be rated as good based on high or good eutrophic condition and influencing factors, even if the expectation is that it will worsen in the future. Poor and bad grades reflect a range of undesirable pressure and state conditions, even if there are management plans for recovery (Bricker et al., 2007).
in the systems assessed. A more detailed description of the three core diagnostic tools used in the ASSETS methodology is performed hereafter.
4.1 Overall Human Influence (OHI)
In order to better understand the factors that influence eutrophic symptoms in a coastal area, a link between a system’s natural sensitivity to eutrophication and the nutrient loading must be establish. Therefore, the OHI in the ASSETS methodology is determined by calculating two factors, which are:
- Susceptibility of the system; - Nitrogen loads to the system.
Susceptibility is a measure of a system’s nutrient retention based upon dilution and flushing potential. In terms of dilution potential, an assumption is made that a larger portion of the water column is potentially available to dilute nutrient loads in a vertically homogeneous water body than in a vertically stratified system. Thus, determination of dilution potential can be performed according to the decision rules illustrated in Figure 7.
Figure 7 – Decision rules for the determination of dilution potential (Bricker et al., 1999).
In terms of flushing potential, the flushing capability of a system is determined by tidal action and the amount of freshwater flowing in from its catchment. Therefore, it is assumed that water bodies with large tide and freshwater influences have a greater capacity to flush nutrient loads. The determination of flushing potential can be performed according to the decision rules depicted in Figure 8.
In both of the scenarios mentioned above, the higher the rating, the greater the capacity to dilute or flush nutrient loads. By combining both components, a rating of susceptibility of the water body to retain or flush nutrient loads is obtained. The matrix used for this combination is shown in Figure 9.
Figure 9 – Matrix used in the determination of the susceptibility of the water body to retain or flush nutrient loads (Bricker et al., 1999).
Regarding the nutrient loads to the systems, this is the critical component for determining an OHI score. The ASSETS methodology uses nitrogen loads, because, although it is recognised that phosphorous may be the limiting nutrient in some systems or seasons, it is nitrogen the typical limiting nutrient in the majority of the estuaries and coastal waters. A new simple model which combines human pressure and system susceptibility was developed and integrated in ASSETS. The loading component is then estimated as the ratio of nitrogen coming from the land to that coming from the ocean and a rating is given. The equations used for the determination of the nitrogen loading to the water body can be better understood in Bricker et al., 2003, however, for the purpose of this assessment, they are written as shown in Equations 1, 2 and 3:
(1)
(
)
0 0 S S S m
m in e
h
−
= ; (2)
0 S
S m
m sea e
b = and (3) mc =mh +mb
In the first equation, mh is the human derived concentration of nitrogen (kg.m-3), min is
the nitrogen concentration in the inflow (kg.m-3), S0 is the offshore salinity and Se is the
estuarine salinity. In the second equation, mb is the background concentration of nitrogen
(kg.m-3) and msea is the nitrogen concentration in the ocean (kg.m-3). In the third equation,
mc is the total expected concentration of nitrogen (kg.m-3). In order to achieve a final
rating for nutrient loading, one more formula is used (Equation 4), which is:
(4) c h m m OHI =
Table 6 – Thresholds and categories used to rate the nutrient loads to the system (Bricker et al., 2003).
Class Thresholds
Low 0 to 0,2
Moderate Low > 0,2 to 0,4 Moderate > 0,4 to 0,6 Moderate High > 0,6 to 0,8
High > 0,8
The higher the rating obtained, the greater the influence of anthropogenic pressures to the system. In these calculations it should be noted that the concept of mean salinity used, only makes sense in systems where there is some regularity in the river discharge. In torrential areas, where rainfall is concentrated in a short period of the year, it is more appropriate to use the median salinity. Also, in coastal lagoons, where river inputs are not important, the approach mentioned above will not work, since it considers freshwater discharge as the main nutrient vector to the system. For all other areas the loading from the perimeter may easily be combined with the river-borne loading as a summation (Bricker et al., 2003).
Although the thresholds obtained from the application of the equations, can be a strong indication of the final OHI score, since that it accounts for the susceptibility components, (mainly, in terms of difference in the salinity of the ocean and the estuary), it is necessary to combine nitrogen loads and susceptibility of the water body, in order to obtain this final rating. Thus, the OHI score for the systems, when using the ASSETS methodology is obtained from the matrix shown in Figure 10.
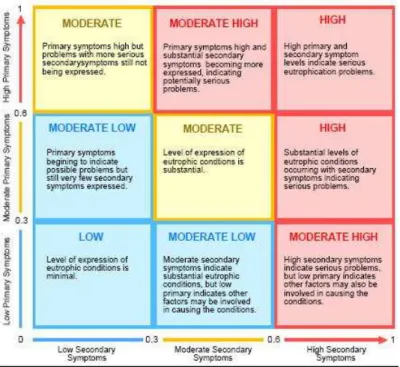
4.2 Overall Eutrophic Condition (OEC)
In general, there are several nutrient related water quality parameters which can be used in order to assess the eutrophication status of a system. However, only a subset of five parameters was chosen to provide an index of state, expressed as overall eutrophic condition. These parameters are divided into primary and secondary symptoms of eutrophication. The primary symptoms are chlorophyll a and macroalgae, whereas the secondary symptoms are dissolved oxygen, submerged aquatic vegetation (SAV) and nuisance and toxic algal blooms. A summarised description of the way these symptoms are disclosed in the systems and an explanation for their importance in the definition of OEC, are presented in Figure 11.
Figure 11 – Description of the primary and secondary symptoms used for the determination of OEC in ASSETS (Bricker et al., 2007).
After obtaining the expression value for each symptom by zone, the symptom level of expression for the whole system, is obtained by summation (Equation 5).
(5)
∑
= n e z E A A SLE 1 1
In Equation 5, SLE is the symptom level of expression of each symptom, Az is the
surface area of each zone, Ae is the total system surface area, El is the expression value at
each zone and n is the number of system zones.
Afterwards, the level of expression of the primary symptoms for the system is determined by calculating the average of the two level of expression values, according to Equation 6.
(6)
∑ ∑
= p n
e z E A A p P 1 1 1 1 1
In Equation 6, P1 is the level of expression of the primary symptoms for the system and p
is the number of primary symptoms used. This step is followed by the determination of the same level of expression, but for secondary symptoms. Thus, for each secondary symptom, an area weighted expression value for each zone is determined as described in Equation 5 above. However, the level of expression of secondary symptoms for the estuary is determined by choosing the highest of the three estuary level symptom expression values instead of following the same process as for primary symptoms. This is due to the fact that secondary symptoms are considered to be a clear indicator of problems, and the application of the precautionary principle means that the highest (worst-case) value dictates the classification. This way, it is recognized that these symptoms are indicative of more advanced nutrient-related impacts.
The system is then assigned a category for primary and secondary symptoms based on the level of expression calculated for each one of them, according to Table 7.
Table 7 – Categories for primary and secondary symptoms according to their expression value in the system (Bricker et al., 2003).
System Expression Value Category
0 to ≤ 0,3 Low
0,3 to ≤ 0,6 Moderate
0,6 to ≤ 1 High
al., 2007, and should be taken into account when calculating the OEC score, which by default already considers this factor, so that the results are not compromised.
Figure 13 - Matrix used for the determination of the OEC score of the water body in the ASSETS methodology (Bricker et al., 1999).
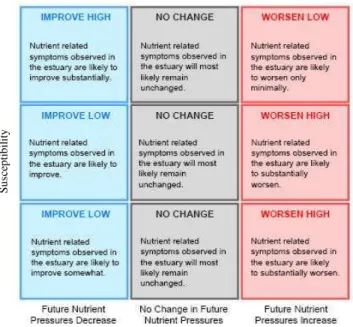
4.3 Determination of Future Outlook (DFO)
For the determination of the future outlook, two factors are combined in order to estimate future changes in terms of eutrophication conditions, based on expected modifications in nutrients inputs to a system. These are:
- Susceptibility;
- Predicted future loads.
In terms of the susceptibility of the system to nutrient loads, the analysis is the same as performed for OHI and described previously. The determination of the predicted future loads is based on predicted population increase, planned and/or recently implemented management actions and expected changes in watershed uses. In quantitative terms, it is carried out by ASSETS using the changes in demographic, wastewater treatment and agriculture trends.
Figure 14 - Matrix used for the determination of the DFO score of the water body in the ASSETS methodology (Bricker et al., 1999).
Su
sc
ep
tib
ili
5 Spatial Domain
The focus of this work is to conduct an assessment to specific coastal water bodies which are designated as estuaries. An estuary is an area where fresh water and salt water come together. The mixing of fresh and salt water creates a different environment, but estuaries are still home to a lot of plants, animals and bacteria. They are also extremely nutrient-rich because of sediment deposit of rivers, creeks or streams feeding into the salt water environment. There are five sea estuaries in Northern Ireland, being two of them transboundary systems, which form an international border with the Irish Republic. These estuaries are locally called loughs and can be seen in Figure 15.
Figure 15 - The five loughs of Northern Ireland (Ferreira et al., 2007).
1 000 km2 of marine waters, accounting for most of Northern Ireland’s coastline. Belfast Lough and Strangford Lough are the largest sea inlets in the district (NIEA, 2008j).
Due to the natural conservation of the main sea Loughs in Northern Ireland, all of them are subject to a range of conservation designations. Besides this, there are several activities being developed, directly or indirectly related to the Loughs, such as, recreational and commercial fishing, tourism, harbour developments and shipping. The Loughs are also used as receiving bodies for wastewater discharges.
6 Results
6.1 Strangford Lough
6.1.1 Description of the Lough
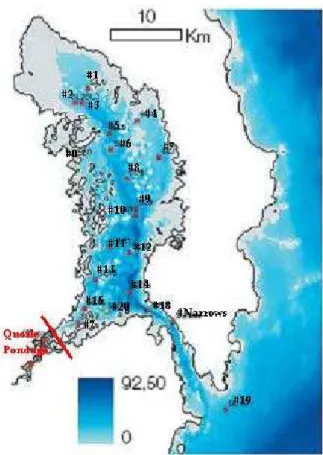
Strangford Lough is a large marine Lough which lies on the eastern County Down coast of Northern Ireland and is placed between the Ards Peninsula and the mainland. It has an area of approximately 150 km2 and it is connected to the Irish Sea via an 8 km long channel called the ‘Narrows’ which is as little as 800m wide in places. Although depths of more than 60 metres have been recorded in this channel, the majority of the Lough is less than 10 metres in depth (EHS, 2005a). A more detailed perspective of the Lough’s depths and the sampling stations used in this assessment, can be observed in Figure 16.
Figure 16 – Location of the sampling stations and surface depths of Strangford Lough (Ferreira et al., 2007).
position of the ‘Narrows’. Due to this fact, 30% of the Lough’s surface is intertidal (EHS, 2005a). There are two main freshwater flows into Strangford Lough: the Comber (Enler) River, which enters the Lough in its north western corner and the Quoile River, in the south western corner. The main characteristics of Strangford Lough are presented in Table 8.
Table 8 - Physical Properties of Strangford Lough (Ferreira et al., 2007 and Service et al., 1996).
Physical Properties Strangford Lough
Volume (x 106 m3) 1537
Area (km2) 149
Maximum Depth (m) 60
Catchment (km2) 772
Temperature (ºC) 2-19
Mean Salinity 33
River Flow (m3 s-1) 16
Water Residence Time (d) 4-28
Population in Catchment 144 000
Strangford Lough is classified as an Area of Special Scientific Interest (ASSI) and a Special Protection Area (SPA). Also, from all of the sea loughs analyzed, Strangford Lough is the only system on the UK list for designation as a Special Area of Conservation (SAC) under the EC Habitats Directive (Ferreira et al., 2007). This means that there is a special interest for nature conservation in this Lough.
The Lough can be divided geographically into three different areas which are influenced by different factors. The southern area, which is deeper and receives the direct inflows of seawater, the northern area which is shallower and is somewhat more affected by the intertidal effects and the Quoile Pondage which is directly affected by the discharge of the Wastewater Treatment Works and agriculture practices, therefore subject to higher loadings of nutrients.
6.1.2 Homogeneous Areas
The salinity of the Lough as a whole is virtually identical to that of the open sea (Brown, 1990). However, in the areas where streams and rivers flow in there are local effects due to the run of fresh water which makes it possible to see the division between the waters of any farmland stream and the true sea water of the Lough (Brown, 1990).
The western Irish Sea has a salinity that ranges between 34 and 35 psu (EHS, 2005a). For this study it was considered the median value of sampling station #19, which was 34 psu.
corresponds to the south area, where the Quoile Pondage is located (0,6 km2) and the seawater zone is the remaining area of the Lough (148,4 km2). The salinity value defined as representative of the mixing zone of the estuary was 2 psu and the seawater zone was 33 psu.
6.1.3 Data Completeness and Reliability
The amount of sampling stations used for this assessment cover almost the complete area of the Lough. This data is provided by the Estuarine and Coastal Waters Monitoring Programme (ECWMP), which has permanent monitoring sites in the whole area of the Lough and Trophic Status Studies performed during the periods between July of 1993 and December of 1995 and January of 2004 and March of 2006. The number of stations sampled, dates and water quality parameters for Strangford Lough are shown in Table 9.
Table 9 – Results of the data completeness and reliability for Strangford Lough
Number of Stations
Parameters Date Area
4* Dissolved Oxygen October 1990 to January 2004 (winter) Seawater 12 11 Salinity Chlorophyll a
July 1993 to April 1994 (monthly)
Seawater (all area)
15 19
Salinity Chlorophyll a
May 1994 to May 1995 (monthly)
All estuary
15 15
Salinity Chlorophyll a
July to September 1995 (monthly)
Seawater (all area)
13 Chlorophyll a October to December 1995
(monthly)
Seawater (all area)
5* Dissolved Oxygen January 1998 to May 2003 (winter)
Mixing
1 Salinity January to November 2004
(monthly)
Mixing
1 Chlorophyll a July to October 2004
(monthly)
Seawater
5 Chlorophyll a January 2004 to November
2005 (monthly)
Mixing Seawater
16 Salinity March 2004 to September
2005 (winter and summer)
Seawater (all area) Irish Sea 1
2
Salinity Chlorophyll a
December 2004 to March 2006 (monthly)
Seawater
3 Chlorophyll a January to November 2005
(monthly)
Seawater
Due to the difficulty in analysing the data, some sampling campaigns performed in isolated days in stations scattered all over the Lough, were not included in the figure above. These campaigns were mainly performed after January 2004 and are not representative of large temporal periods, however, they were considered in the assessment. The remaining campaigns shown were performed monthly, which provides a good temporal perspective, even though the timeframe between the campaigns conducted in the two homogeneous zones do not overlap on occasions. Thus, the data used in the assessment is considered to be reliable on account of the spatial and temporal representativeness of sampling and the analytical quality of the analyses. However, in terms of data completeness there is some inconsistency observed between the two homogeneous zones, in the period of sampling after January 2004, although the sampling campaigns are performed monthly.
6.1.4 Overall Human Influence
6.1.4.1 Susceptibility
6.1.4.1.1 Dilution Potencial
Due to the low depth of most of the Lough and high tidal amplitudes, the whole system is considered to be well mixed.
When wind and current are running in approximately the same direction, the waters tend to be relatively calm. A few hours later, when the tide turns, and current and wind are in opposition, a fierce sea can develop with standing waves breaking against each other as they fight against the current (Brown, 1990). In Figure 17, it is possible to observe the directions of tidal currents and waves in Strangford Lough.
Figure 17 - Tidal currents (left), wave direction (right) (Brown, 1990).
Strangford Lough is subject to essentially the same weather regime as the rest of the Province, but the rainfall is considerably reduced by the presence of the Mountains of Mourne, some 35 Km to the west. This rain shadow as it is called, gives the south-western parts of the Lough the distinction of being one of the driest parts of Ireland (Brown, 1990). This fact can explain the low freshwater flows into the Lough (NIEA, 2008b).
Another difference between the Lough and the Irish Sea is that the tidal range (difference between high and low water levels) is around four metres compared with about five on much of the open coast (Brown, 1990). Again, it is the Narrows creating this effect by hindering the tide levels in the Lough from reaching their maximum potential.
One major area that seems to operate in a slightly different way to the rest of the Lough is the shallow area lying to the north. To some extent this is due to the fact that the rate of water exchange with the other areas is slightly less - possibly because of the narrowing of the Lough and the long distance from the Narrows. With the tide rising over vast stretches of open mudflats the effects of summer sun and winter frost are much greater, and as a result water temperatures in this area vary considerably. Water from the rivers and canals running into it, can take somewhat longer to disperse. The combination of all these factors increases the likelihood of layering, or stratification, in this part of the Lough, which would reduce the amount of nutrient exchange in the water with considerable implications for wildlife, and for the effects of sewerage effluents (Brown, 1990). The differences in the northern and southern areas in terms of temperature of the waters, identifying possible layers of stratification can be seen in Figure 18.
Figure 18 – Differences in water temperature in Strangford Lough, near the surface (up) and near the bottom (down) (Ferreira et al., 2007).
It may be possible that the one redeeming feature preventing major stratification of this area is the influence of wind and wave action which must help to stir up those shallow waters (Brown, 1990). On the other side, some symptoms of stratification have been observed in the lower reaches of the Quoile Pondage, particularly, oxygen depletion and anoxia (Roberts et al., 2004).
Due to these diverse characteristics and physical differences between the northern and southern parts of the Lough, to the low freshwater inflow and after applying the formula described in previous chapters, the results obtained for the dilution potential fall within the “Moderate category”.
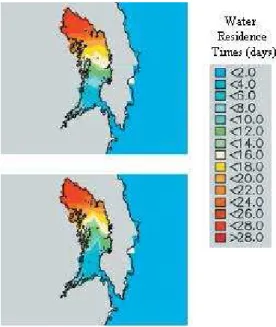
6.1.4.1.2 Flushing potential
It has been calculated that the total yearly freshwater input to the Lough from rivers and streams (mainly the Comber and Quoile Rivers) is exceeded by the amount of sea water entering over a mere three tides (Brown, 1990). It has also been calculated that the Lough’s tidal exchange3 is about 350 million cubic meters and results in a wide range of
current strengths and tidal variations, which results from its diversified characteristics. As an example, the Narrows are subjected to strong tidal currents, where the influence from tidal exchange is more noticeable. Conversely, some sheltered inlets on the western shores have virtually still water and are less influenced by this exchange (EHS, 2005a). By knowing the tidal exchange, the freshwater input rate (river flow) and the total volume of the Lough, it is possible to determine the water residence time. The water residence times from the surface and bottom of Strangford Lough can be seen in Figure 19.
Figure 19 - Water residence times in Strangford Lough, near the surface (up) and near the bottom (down) (Ferreira et al., 2007).
By analysing the figure above, it is possible to identify major differences between the areas located to the north and to the south. In the Northern area of the Lough there is less exchange of water due to the specific details described in the chapters above.
Another different zone is the Quoile Pondage. Although its location is a favourable one, close to the entrance of seawater in The Narrows, the flushing potential is controlled by the Quoile barrage and therefore is not subject to the natural tidal exchange as the remaining water body. This Pondage drains twice daily at low tide, which increases the susceptibility to eutrophication of this particular zone (EHS, 2005a).
However, since there are considerable differences, once more, between the northern and southern areas of the Lough and the Quoile Pondage, supported by the application of the decision rules for flushing potential, the classification will fall within the “Moderate” category.
6.1.4.2 Nutrient Inputs
Strangford Lough is not classified as a sensitive or vulnerable water body under the definitions of the UWWT and Nitrates Directives (Roberts et al., 2004), however, its northern part is subject to this classification. Its catchment area is approximately 772 km2 (Ferreira et al., 2007). It is estimated that approximately 65% of the land in the catchment is predominantly agricultural with a relatively greater importance of crop culture in the north and of livestock grazing in the south of the region (Roberts et al., 2004). Besides agricultural waste, there are also discharges from septic tanks and Waste Water Treatment Works (WWTW) entering the rivers and the direct catchment of the Lough.
In a yearly basis, further source apportionment throughout the catchment, demonstrated that the majority of sources of Dissolved Inorganic Nitrogen (DIN) and a significant part of the sources of Dissolved Inorganic Phosphorous (DIP), to Strangford Lough were from agricultural sources. (EHS, 2005a). The soil uses in the catchment of Strangford Lough is described in Figure 20.
Figure 20 – Soil uses in the catchment of Strangford Lough (NIEA, 2008j)
There are 26 WWTW in the Strangford Lough catchment, serving a population of approximately 101 740 (Foy & Girvan, 2004). The major works are those at Ballyrickard, Killyleagh and Downpatrick, the three of them together accounting for 81% of the total population equivalent of the catchment (EHS, 2005a). The detailed list of characteristics of the more important WWTW systems can be seen in Table 10.
Table 10 – Characteristics of the Wastewater Treatment Works which discharge in Strangford Lough, until the year of 2004.
WWTW Type of Treatment in 2004
Population Equivalent
Responsible
Ballyrickard Secondary 59 400 Glen Water
Killyleagh Secondary 13 025 Northern Ireland Water
Downpatrick Secondary 8 415 Northern Ireland Water
Kircubbin Primary 2 000 DRD Water Service Portaferry Coarse Screening 3 000 Northern Ireland Water Greyabbey Secondary 1 000 DRD Water Service
Others 14 900
Total 101 740
Because of the fragile status of the northern part of the Lough and considering that Ballyrickard WWTW contributes 15% of the total nitrogen loading to Strangford Lough (excluding the loadings for the Quoile Pondage.), it was recommended nitrogen reduction to be installed in Ballyrickard WWTW to meet the requirements of Article 5 of the UWWTD (EHS, 2005a). This is expected to happen by 2013.
Estimates point out that the nitrogen loading from Downpatrick WWTW makes up only 2,7% of the total nitrogen loading to the Quoile Pondage, which is a low value. However, due to the location of the discharge from the works entering an enclosed, heavily modified waterbody with minimal dilution, in this instance nitrogen removal was recommended and has been accounted for, with the construction works expected to end during the year of 2009. This WWTW contributes 15% of the total P loading to the Quoile Pondage and P removal is therefore also contemplated for this works (EHS, 2005a).