GUSTAVO DIAS DE ALMEIDA
QTL MAPPING REVEALS CONSTITUTIVE AND ADAPTIVE GENOMIC REGIONS FOR DROUGHT TOLERANCE IN TROPICAL MAIZE
(Zea mays L.)
Tese apresentada à Universidade Federal de Viçosa, como parte das exigências do Programa de Pós-Graduação em Genética e Melhoramento, para obtenção do título de
Doctor Scientiae.
VIÇOSA
Ficha catalográfica preparada pela Seção de Catalogação e Classificação da Biblioteca Central da UFV
T
Almeida, Gustavo Dias de, 1985-
A447q QTL mapping reveals constitutive and adaptive genomic 2012 regions for drought tolerance in tropical maize (Zea mays L.) /
Gustavo Dias de Almeida. – Viçosa, MG, 2012. xiii, 126f. : il. (algumas col.) ; 29cm.
Orientador: Aluízio Borém.
Tese (doutorado) - Universidade Federal de Viçosa. Inclui bibliografia.
1. Milho - Melhoramento genético. 2. Milho - Efeito da seca. 3. Interação genótipo-ambiente. 4. Mapeamento
cromossômico. 5. Marcadores genéticos. 6. Locos de caracteres quantitativos. I. Universidade Federal de Viçosa.
II. Título.
ii
“
It is not the strongest of the species who survive, nor the most
intelligent, but the one most responsive to change
”
iii
DEDICO
Aos meus pais,
José Elias de Almeida, que com o suor do seu
rosto fez brotar da terra o sustendo de nossa
família;
Marlene Dias de Almeida, grande mulher, que sempre
me apoiou.
OFEREÇO
iv
ACKNOWLEDGEMENTS
To God, for giving me life and immeasurable strength and perseverance in adversity times.
To Universidade Federal de Viçosa (UFV) and Programa de Pós-Graduação em Genética e Melhoramento.
To International Maize and Wheat Improviment Center (CIMMYT) for throughout the infrastructure for conducting experimental.
To Coordenação de Aperfeiçoamento de Pessoal de Nível Superior (CAPES) and Conselho Nacional de Desenvolvimento Científico e Tecnológico (CNPq) of Brazil for providing PhD fellowship to me.
To PhD. my supervisor Professor Aluízio Borém for their valuable guidance and support.
I would like to express my sincerest thanks to Dr. Raman Babu for providing the opportunity to work in this topic, for his invaluable advices and endless support throughout my study. I appreciated him not only for his great scientific knowledge, but also for his simple and warm personality, always ready to listen and to support.
I am very thankful to Prof. Cosme Damião Cruz, my co-advisor, for guiding during my Ph.D.
My big thanks to all professors of Programa de Pós-graduação em Genética e Melhoramento of UFV for the valuable teaching.
v
Marianne Bänziger, Dr. Boddupalli M Prasanna, Dr. Jose Crossa, Dr. Felix San Vicente, Dr. Natalia Palácio, Dr. Samuel Tracshel, Dr. Gary Atlin and Dr. Marc Rojas for directed and indirect contributions for this study.
I am very thankful to Biotechnology Laboratory team of CIMMYT: Araceli, Alberto Vergara, Aldo Vergara, Carlos Martinez, Irving Rosas, Marta Hernandez.
Special thanks to Carlos Martinez and Irving Rosas for company during all travelling to field work in CIMMYT’s station in Mexico.
My appreciation goes to Simon Prastana and Ciro Sanchez for the valuable teaching in filed work and excellent field experiments in México.
I am very thankful to secretary of the Global Maize Program-CIMMYT: Esperanza Calderon, Caritina Venado, Laura Rodriguez, Liliana Santamaria and Remmy Labuguen.
I am very thankful to secretary of the Pós-graduação em Genética e Melhoramento of UFV, Edna and Rita.
To my lovely parents, my brother and sister and other relatives for all life teaching.
To my friend Caio, by patience, familiarity, the great friendship and encouragement to join in this graduate program graduate, my honest thanks.
To all my friends from “república” and graduated program of UFV, my honest thanks.
I am very thankful to all CIMMYT stuffs and to Mexican people who warn receive in that country
vi
vii
BIOGRAPHY
GUSTAVO DIAS DE ALMEIDA, son of José Elias de Almeida and Marlene Dias Almeida, born in Barra de São Francisco City, Espírito Santo State-Brazil in 04th April, 1985.
In 2003, he started the college of Agronomy at Universidade Federal de Viçosa (UFES) getting degree in July of 2007.
In August 2007, he joined the graduate program in Crop Science at Universidade Federal de Viçosa (UFV). He then obtained his Master’s degree at UFV
viii Contents
ABSTRACT ... x
RESUMO ... xii
1. GENERAL INTRODUCTION ... 1
1.1 Drought: Its effects in human society ... 1
1.3 Aspects of drought tolerance in maize ... 4
1.4 Genetic mapping and QTL detections ... 9
1.5 Goals and objectives... 15
1.6 Reference ... 16
2. CHAPTER I ... 22
QTL mapping in three tropical maize populations reveals a set of constitutive and adaptive genomic regions for drought tolerance ... 22
Introduction ... 23
Materials and methods ... 27
Plant materials ... 27
Field experiments ... 28
Statistical analyses of phenotypic data ... 29
QTL analysis... 31
Single and multiple environment QTL analysis ... 31
QTL meta-analysis ... 32
Results ... 33
Phenotypic evaluations across different environments under two water regimes 33 QTL analysis ... 36
CML444xMALAWI (Tolerant x Intermediary susceptible) ... 37
CML440xCML504 (Tolerant x Tolerant) ... 38
CML444xCML441 (Tolerant x Tolerant) ... 40
Meta-analysis ... 45
Discussion ... 50
References ... 60
ix
3. CHAPTER II ... 76
Unraveling QTLs affecting morphophysiological traits related to drought tolerance in three maize tropical populations ... 76
Introduction ... 77
Materials and methods ... 81
Plant materials ... 81
Field experiments ... 82
Phenotypic data analysis ... 85
QTL identification ... 85
Results ... 88
Trait variation and correlations under two water regimes ... 88
QTL mapping for secondary traits under two water regimes ... 92
QTLs for EPP ... 93
QTL for stay-green traits ... 94
QTL for PH and EH ... 95
Clusters of QTLs detected by meta-analysis ... 95
Discussion ... 100
References ... 109
Supplementary information: ... 115
x ABSTRACT
ALMEIDA, Gustavo Dias, D.Sc., Universidade Federal de Viçosa, July, 2012. QTL
mapping reveals constitutive and adaptive genomic regions for drought tolerance in tropical maize (Zea mays L.). Adviser: Aluízio Borém. Co-advisers: Raman Babu
and Cosme Damião Cruz.
xi
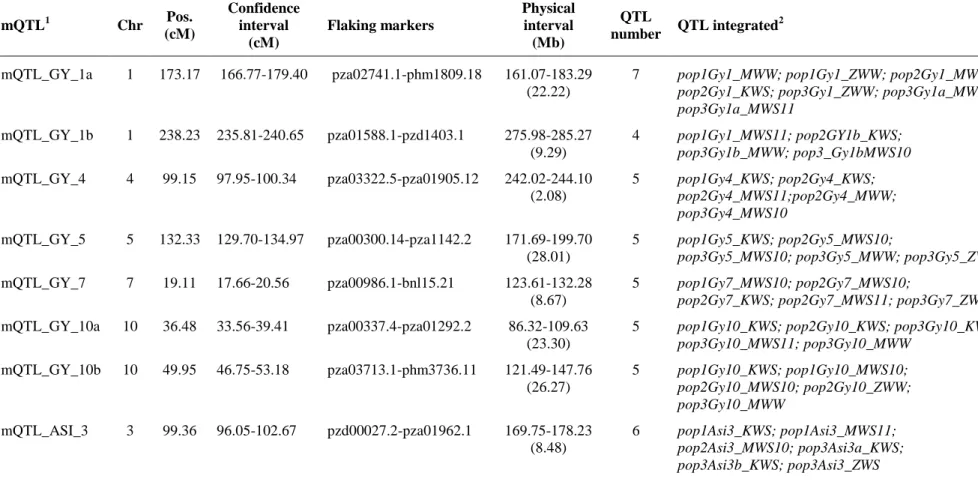
were not markedly affected by water shortage. In general drought stress tends to reduce genetic variance of GY, while secondary traits remain to be stable or even higher under water scarcity. Also, high correlation between morphophysiological traits and GY were observed under drought condition. Grain yield QTLs showed strong interactions with the environment (QEI) and changed their positions on the genome across environments. Whereas QTLs for secondary traits tend to be more stable across water regimes. Meta-QTL analysis reveals clusters of QTLs for grain yield and secondary traits, such as anthesis-silking interval, ears per plant, stay-green and plant and ears heights on chromosomes 1 (bin 1.06 at 161.07-183.83 Mb) and 10 (bin 10.04-06 at 111.26-141.82 Mb) while one interesting cluster of all secondary traits were detected on chromosome 3 (bin 3.06 at 169.75-178.23 Mb) under both water regimes. The confidence interval of metaQTLs regions harbored several genes, available in maize database (http://www.maizegdb.org), that were involved in diverse networks controlling development, metabolism and responses to biotic and abiotic stresses. The target regions identified by QTL mapping can contribute to complementing the evaluation and selection of improved germplasm, especially in poor areas with high risk of drought as in sub-Saharan Africa.
xii RESUMO
ALMEIDA, Gustavo Dias, D.Sc., Universidade Federal de Viçosa, julho de 2012.
Mapeamento de QTL relevela regiões genômicas constitutivas e adaptativas para tolerancia à seca em milho tropical (Zea mays L.). Orientador: Aluízio Borém.
Coorientadores: Raman Babu e Cosme Damião Cruz.
A seca é o estresse abiótico mais importante e resulta em prejuízos significativos na produtividade do milho (Zea mays L.). Atualmente o milho é reconhecido como uma das principais culturas agrícolas respónsaveis pela segurança alimentar devido ao alto potencial de rendimento comparado a outras culturas como arroz e trigo. O desenvolvimento de genótipos tolerantes à seca pode contribuir para garantir a segurança alimentar, principalmente em países em desenvolvimento da África, Ásia e América Latina, onde essa cultura é considerada alimento básico. No entanto, a seleção para tolerância à seca é difícil devido à complexidade dessa caracteristica, alta interação entre genótipos e ambientes e o conhecimento limitado sobre o papel e regulação de mecanismos de tolerância. Melhoramento genético clássico têm identificado características morfofisiológicas para a produção de grãos sob estresse hídrico, mesmo que sejam em sua maioria poligênica. No entanto, rendimento de grãos, provavelmente, continua sendo a característica mais complexa. A disponibilidade de marcadores moleculares tem permitido o mapeamento de
Quantitative Trace Loci (QTLs). O qual é uma ferramenta promissora para detecção
xiii
1
1. GENERAL INTRODUCTION
1.1 Drought: Its effects in human society
In plants drought stress occurs when the loss of water by the transpiration exceeds the root capacity of absorbing water from the soil for time sufficient enough to cause irreversible damage to the plant (Jaleel et al. 2007). When the water deficit occurs before the crop is fully developed, it can also reduce vegetative growth. The negative impact of drought depends mainly on the timing, duration and intensity of the stress. However, the occurrence of natural drought is largely unpredictable, making it difficult or almost impossible to distinguish between water-limited and non-limited agricultural systems (Messmer 2006).
Low water availability is one of the major causes for crop yield reductions affecting most farmed regions around the world (Ali et al. 2011). The large negative impact of drought in agriculture has been associate to the collapse of many ancient civilizations (Cázares et al. 2003). Historical evidence links drought to the collapse of the Mayan civilization from around 910 to 760 B.C. The first phase occurred between 810 and 760 B.C., the second phase was largely over by about 860 B.C. and the third and final phase finished around 910 B.C. These followed drought cycles in the Yucatan peninsula (Southern Mexico, Belize and Guatemala) strongly reduced the maize yield capacity, the main food of Mexican ancient civilizations, not providing sufficient food to about 13 million of people of the Maya society during the classic period (950 to 250 B.C.) (Huang et al. 2003).
2
main reason for the decline of Mochica culture in coastal Peru about 1500 years ago and it is related to the end of Tiwanaku culture in Bolivian-Peruvian Altiplano about 1000 years ago (Peterson and Huang 2005).
In the modern society, drought events have been related with a tremendous impact over millions of people around the world. A water shortage in northern China in 1876 dried up crops in an extensive region, producing famine and millions of deaths. In the USA, the most well-known American dry-period was the “Dust Bowl” on the Great Plains from 1931 to 1936. The years of 1934 and 1936 were the two driest years in the history of U.S.A. climate (Lassieur 2009). Russia also experienced a severe period without rain in 1890 and 1921, the later resulted in to five million deaths in the Volga river basin. The Northeast of Brazil is a semi-arid region. The lack of rain is the reason of exodus of many families from this region to others parts of Brazil. Drought has been reported in the Brazilian literature in a novel called barren lives (Vidas Secas) write by Graciliano Ramos in decade of 1930 that related the story of a poverty-stricken family (Fabiano, the father; Sinhá Vitória, the mother; two sons (just called boys) and their dog called Baleia) escaping from a severe drought.
3
driving plant scientist to breed plants that can be grown in marginal areas, as those with limited rainfall (Hao et al. 2010).
1.2 Maize: Origins, classifications and importance
Maize or corn is a grass from the Poaceae family, taxonomically classified as
Zea mays L. spp. mays, domesticated possibly around 9000 years ago by Mexican
ancient habitants. Species of Maydae tribe are characterized for monoecism, in which flowers are unisexual with male and female inflorescences almost one meter apart on the same plant while other grasses from this tribe have hermaphrodite flowers. Maize is a worldwide crop, however the origin of this cereal is essentially American because in this continent are found wild close relatives (Tesosinte and Tripsacum) were found as well as fossil, historical and linguistic evidence of the domestication of this crop. The most accepted hypothesis for the origin of maize is that this grass was derived from the wild plant called teosinte (Zea mays spp.) which is composed of the following sub-species: Z. mays spp. mexicana, Z. mays spp. parviglumis, Z. mays ssp.
luxurians and Z. mays spp. diploperenis. Both maize and teosinte have the same
number of homologs chromosomes (n=10), it can easily cross resulting in a fertile offspring with genetic similarity to both parents (Paterniani and Campos 2005).
4
maize could be a key to global food security since. Because this crop can be a direct food source for human nutrition as well as for animal feed in many tropical and sub-tropical zones. This crop is a staple food in many regions in the world, mainly in developing countries (Araus et al. 2011). In Africa, maize accounts for one fifth of the total daily calorie intake per capita, at least, in 12 countries and for more than 50% in countries like Lesotho, Zambia and Malawi. In West African coastal countries, the estimated maize per capita consumption ranges from 41 to 102 kg per year (Krivanek et al. 2007). The demand for maize in developing countries is expected to exceed 500 million tons in 2020, surpassing the demand for both rice and wheat. This projected rapid increase in demand is mainly explained by the increase in the demand for maize as livestock feed (for poultry and pigs, particularly in eastern and southeastern Asia) (Araus et al. 2011). In addition, maize has an important role in countries facing food shortage because this crop is grown over a wide range of environmental and geographical regions including lowland, mid-altitude and sub-tropical highland environments (Zaidi 2004).
1.3 Aspects of drought tolerance in maize
5
therefore, they will no longer depend on agronomic techniques to have high yield productions (Duvick 2005; Bänzinger et al. 2006).
The response of the crop to stress depends on numerous traits, many of which are constitutive, but which may also be modified by stress. A drought tolerant genotype produces higher yields than a drought susceptible genotype in a variety of water-stressed environments. The ideal genotype combines both high yield under favorable conditions and tolerance to water stress. The overall goal of breeding for drought tolerance is, therefore, to realize a high maximum yield potential and to reduce the gap between yield potential and yield under stress (Ali et al. 2011).
The success of breeding programs for drought tolerance requires knowledge of the morphophysiological aspects related to drought stress. It is necessary the understanding on the critical phase of the culture, parts of the plant affected most by the drought and if there is any trait correlated with grain yield under stress condition (Bänzinger et al. 2000). A severe drought stress tends to reduce the genetic variance of the grain yield in maize (Bänzinger et al. 2000). Further, there is a high genotype environment interaction (GEI) between drought and well water environments for the genotype performance which reduces the odds to selected genotypes with good performance under both water regimes (Bänzinger et al. 2006). Breeding programs for drought tolerance as from CIMMYT (Centro International de Mejoramiento de Maíz
y Trigo) has been adopting some secondary traits in the breeding process. These traits
6
About 50% of the on-farm increase in the yield of hybrid maize during the last 60 to 70 years has been achieved through genetic improvements, mainly by the better tolerance to stress that has been incorporated into newer hybrids. The increase in yield was accompanied by changes in a number of morphological and physiological traits, as for example anthesis-silking interval (ASI), stay-green, logging resistance, plant height and more efficient photosynthesis, as well as an improved photosynthetic rate after stress events (Duvick 2005). Considerable progress in the genetics of tropical maize was also achieved, leading to a higher yield potential and to an improvement in drought tolerance (Bänziger et al. 2000; Monneveux et al. 2008).
7
the anthesis-silking interval being the most prominent one (Bolaños and Edmeades 1996; Ribaut et al. 1997; Bänzinger et al. 2000; Campo et al. 2004; Messmer et al. 2009).
Low values of ASI indicates synchronism between male and female flowering time, resulting in an adaptation to stress which can provide a better grain yield under the adverse water condition. The anthesis-silking interval has been considered a major secondary trait used in breeding program for drought tolerance (Beltrán et al. 2003). Because of the stress, this trait shows an increase in the genetic variances, with the heritability ranging from medium to high and also a high genetic correlation with yield (Bänzinger et al. 2000). Messmer et al. (2009) demonstrated that the heritability of ASI increased from 0.52 in well-water to 0.75 in water stress conditions. Bolaños and Edmeades (1996) found significant genetic correlation of the -0.60 of between ASI and yield under stress conditions whereas Ribaut et al. (1997) detected a non-significant correlation of -0.07 between these two traits under optimal water conditions. Even though ASI is a complex trait which torn the selection for this trait also complicate (Buckler et al. 2009), this trait has been widely used in breeding process to drought tolerance.
8
Photosynthesis can be reduced by the drought stress by reactive oxygen species or by the remobilization of nitrogen from the older leaves in response to a decreased N-uptake by the roots (Rivero et al. 2007). This nitrogen is remobilized from chloroplast to the ears developing. The disintegration of the chloroplasts, a carrier of the photosynthetic apparatus, results in the typical yellowing of the leaves, a symptom which is commonly referred to as senescence (Messmer et al. 2011). The tolerance to premature senescence is referred to as stay-green, which is characterized by the increase of the photosynthesis capacity at the final stage of the plant cycle, providing a greater amount of photo-assimilates available for grain filling (Camara et al. 2007). A genotype can be considered as being stay-green if the time of contributions from green tissues is higher than the average of the population and the kernel moisture should be equal to or below the average of the population. Because if one genotype displays green leaves for a longer time but presents kernel moisture higher than the average of the population, it indicates that this genotype is not considered as stay-green but a genotype with a longer vegetative period (Belicuas 2009). Moreover, the stay-green trait was not found as being associated with a decrease in yield under normal water availability (Messmer et al. 2011).
9
with a portable chlorophyll meter (SPAD meter, Konica Minolta Inc). The SPAD values provide an indication of the relative amount of total chlorophyll (mg/cm2) in the leaves. Leaf chlorophyll content was reported to be positively correlated with grain yield (Xu et al. 2000).
1.4 Genetic mapping and QTL detections
Molecular markers is a recent approach in breeding programmes, however the theory of the Quantitative Trait Loci mapping, popularly known as QTL, was first described in Sax in 1923. This author noted that seed size in common bean (Phaseolus vulgaris), which is a complex trait, was associated with seed coat color, a monogenic trait. He interpreted this finding as the link of the single gene controlling seed color with one or more of the polygenes controlling seed size. The idea was that if segregation of a single gene marker could be used to detect and to estimate the effect of a linked polygene and if single gene markers were scattered throughout the genome of an organism, the mapping and characterizing of polygenes affecting a character (Tanksley 1993) would be possible. This idea is fascinating because quantitative traits are determined by several genes (polygenes) with small effects, highly influenced by the environment and usually with low heritability, which increases the work of the breeder (Falconer 1998).
10
the actions of the gene, and on the biological roles of specific loci involved in complex phenotypes.
Molecular markers can be classified into two distinct classes: random marker and linked markers. Random markers are used in fingerprinting and diversity studies. Linked markers are those linked to the useful trait, which are the focus for marker-assisted selection approaches (SAM) that could be used to accelerate the breeding process. Individuals in a suitable mapping population (F2, recombinant inbred lines,
backcross,) are analyzed in terms of DNA marker genotypes and of the target phenotype. For each DNA marker, the individuals are split into classes according to marker genotype. Mean and variance parameters are calculated and compared among the classes. A significant difference between classes suggests that there is a relationship between the DNA marker and the target trait, that is an evidence that DNA marker is probably linked to a QTL (Tanksley 1993).
Many studies with the objective of finding Quantitative Trait Loci (QTL) have been conducted to identify genomic regions responsible for traits and that could be applied in breeding programmes. The effects and locations of marker-linked genes that have an impact on a number of quantitative traits could be estimate by using an approach that could be applied to dissect the genetic make-up of any physiological, morphological and behavioral trait in plants (Vinod 2009). Molecular markers allows the genetic dissection of the quantitative traits in Mendelian factors controlling the adaptive or constitutive response of crops to abiotic stress (Guo et al. 2008).
11
insertions/deletions (indels) in sequences of bases in DNA homologous fragments and are considered the most valuable markers for genetic mapping and association studies (Zhu and Salmeron 2007). SNPs are the most common polymorphism among individuals of any species (Deschamps and Campbell 2010) because they are highly polymorphic, evenly distributed, co-dominant, accurate, reproducible, high-throughput and cost-effective (Trebbi et al. 2011). The availability of SNP genotyping platforms has been facilitating studies which include genetic diversity analysis, linkage map construction and QTL mapping for dissection of the genetic traits and the application of marker-assisted and genomic selection (Wen et al. 2011). According to Tenaillon et al. (2001) in maize, the average of one SNPs is every 104 pb between two randomly sampled sequences. Its torn this molecular marker valuable for QTL mapping studies in maize.
Quantitative Trait Loci mapping has become a standard procedure to study the genetic architecture of quantitative traits because it allows the estimation of the QTL number, their genomic position and the genetic effects of the QTL that control complex traits (Wang et al. 2010). Moreover, the molecular markers are also useful in the analysis and interpretation of the cause-effect relationship among the traits (Malosetti et al. 2008), which is a prerequisite to allow cost-effective applications of genomics-based approaches to breeding programs aimed to improving the sustainability and stability of yield in abiotic stress conditions (Collins et al. 2008).
12
genotypes on the basis of the marker phenotype. It is important, especially in cases in which the evaluation of the trait of interest is time-consuming and costly, especially for phenotypic traits with low heritability (Carter et al. 2010).
Extensive genetic dissections of drought tolerance traits have been carried out in maize, resulting in numerous QTL involved in the determination of morphological traits, yield components, flowering traits and plant height traits. Marker-assisted selection (MAS) has been successful used for simple traits controlled by only few major genes. However, for complex agronomic traits such as yield under drought stress MAS strategies have contributed less to improving germplasm than initially thought (Ribaut et al. 2009). Some limiting factors for MAS of complex traits were the specificity of QTLs to either stress or non-stress conditions, the low percentage of phenotypic variance explained by the individual QTLs, the cross-specificity of the QTLs and their sensitivity to changing environmental conditions (Campos et al. 2004).
The differential expression of the phenotypic trait by genotype across environment (GEI) is an old problem of primary importance for quantitative genetics (Falconer et al. 1989). The GEI can drastically change the ranking of the genotypes in different environments, which is a major challenge to breeders to obtain fast genetic progress (Peng et al. 2011). The advances in molecular technology and in the methods for detecting QTL have made possible to break down GEI into its QTL x environment interactions (QEI) (Chen et al. 2010). Overall, most of the QTLs identified for yield
13
QTLs had been expressed in well-water and stress conditions (Ribaut et al. 1997; Malosetti et al. 2008; Messmer et al. 2009; Hao et al. 2010; Zhu et al. 2011). The understanding of GEI and QEI components is essential to lead to a breakthrough in breeding under drought conditions and to the use of marker assisted selection (Li et al. 2011). QTLs stable across environments are crucial to develop varieties with large potential of grain yield in stress and well-watered conditions (Messmer et al. 2009).
14
15 1.5 Goals and objectives
16 1.6 Reference
Ali Q, Elahi M, Hussain B, Khan NH, Ali F, Elahi F (2011) Genetic improvement of maize (Zea mays L.) against drought stress: An overview. Agric Sci Res J 1: 228-237.
Araus JL, Sanchez C, Edmeades G (2011) Phenotyping maize for adaptation to drought. In Monneveux P and Ribaut JM (eds) Drought phenotyping in crops: from theory to practice. 1rd edn. Generation Challenge Program (GCP), Texcoco, Mexico, pp. 263-283.
Bänziger M, Edmeades Go, Beck D, Bellon M (2000) Breeding for drought and nitrogen stress tolerance in maize: from theory to practice. Mexico DF.: CIMMYT, 68p.
Bänziger M, Setimela PS, Hodson D, Vivek B (2006) Breeding for improved abiotic stress tolerance in maize adapted to southern Africa. Agr Water Manage 80: 212-224. doi:10.1016/j.agwat.2005.07.014.
Belicuas PR (2009) Estudo da herança dos caracteres stay-green, produção e seus componentes em milho utilizando o delineamento III e mapeamento de QTL. PhD Thesis, Escola Superior de Agricultura-USP, 98p.
Bernardo R (2009) Genome wide selection for rapid introgression of exotic germplasm in maize. Crop Sci 49: 419-425.
Betrán FJ, Beck D, Bänziger M, Edmeades GO (2003) Secondary traits in parental inbreds and hybrids under stress and non-stress environments in tropical maize. Field Crop Res 83: 51–65. doi:10.1016/S0378-4290(03)00061-3
Bolaños J, Edmeads GO (1996) The importance of the anthesis-silking interval in breeding for drought tolerance in tropical maize. Field Crop Res Field Crop Res 48: 65-80.
Buckler ES, Holland JB, Bradbury PJ, Acharya CB et al. (2009) The genetic architecture of maize flowering time. Science 325:714. doi:10.1126/science.1174276
17
Campos H, Cooper A, Habben JE, Edmeades GO, Schussler JR (2004) Improving drought tolerance in maize: A view from industry. Field Crops Res 90: 19-34. doi:10.1016/j.fcr.2004.07.003
Carter AH, Garland-Campbell K, Kidwell KK (2010) Genetic mapping of quantitative trait loci associated with important agronomic traits in the spring wheat (Triticum
aestivum L,) Cross 'Louise' × 'Penawawa'. Crop Sci 51: 84-95.
Cázares BX, Ortega FAR, Elenes LF, Medrano RR (2011) Drought tolerance in crops. Am J Plant Physiol. doi:10.3923/ajpp.2011.
Chen X, Zhao F, Xu S (2010) Mapping environment-specific Quantitative Trait Loci. Genetics 186: 1053–1066. doi: 10.1534/genetics.110.120311.
Collins NC, Tardieu F, Tuberosa R (2008) Quantitative Trait Loci and crop performance under abiotic stress: Where do as stand?. Plant Physiol 147: 469–486. doi/10.1104/pp.108.118117
Deschamps S, Campbell M (2010) Utilization of next-generation sequencing platforms in plant genomics and genetic variant discovery. Mol Breed 25:553–570. doi: 10.1007/s11032-009-9357-9.
Duvick DN (2005) The contribution of breeding to yield advances in maize (Zea mays L.) Adv Agron 86:v–ix. doi.org/10.1016/S0065-2113(05)86012-2
Falconer DS (1989) Introduction to Quantitative Genetics. 3th ed.
Ganunga RP (2005) Genotypic and phenotypic characterization of maize test cross hybrids under stressed and non-stressed conditions. PhD Thesis, Texas A&M University, 253p.
Ge TA, Sui FB, Bai LC, Tong CA, Sun, NB (2012) Effects of water stress on growth, biomass partitioning, and water-use efficiency in summer maize (Zea mays L.) throughout the growth cycle. Acta Physiol Plant 34: 1043-1053. doi: 10.1007/s11738-011-0901-y
Gilbert N (2010) Food: Inside the hothouses of industry. Nature 466:548-551. doi:10.1038/466548a
18
Guo J, Su G, Zhang J, Wang G (2008) Genetic analysis and QTL mapping of maize yield and associate agronomic traits under semi-arid land condition. Afr J Biotechnol 7: 1829-1838.
Hao Z, Li X, Liu X, Xie C, Li M, Zhang D, Zhang S (2010) Meta-analysis of constitutive and adaptive QTL for drought tolerance in maize. Euphytica 174: 165-177.
Haug GH, Günther LC, Peterson DM, Sigman KA, Aeschlimann H (2003) Climate and the collapse of Maya civilization. Science 299:1731–1735.
Jaleel CA, Gopi R, Manivannan P, Panneerselvam R (2007) Responses of antioxidant defense system of Catharanthus roseus (L.) to paclobutrazol treatment under salinity. Acta Physiol Plant 29: 205-209.
Kassahun B, Bidinger FR, Hash CT, Kuruvinashetti MS (2010) Stay-green expression in early generation sorghum [Sorghum bicolor (L.) Moench] QTL introgression lines. Euphytica, 172(3): 351-362.
Krivanek AF, De Groote H, Gunaratna NS, Diallo AO, Friesen D (2007) Breeding and disseminating quality protein maize (QPM) for Africa. Afr J Biotech 6:312-324.
Lassieur A (2009) The Dust Bowl: An Interactive History Adventure. Capstone Press. Malosetti M, Ribaut JM, Vargas M, Crossa J, van Eeuwijk FA (2008). A multi-trait
multi-environment QTL mixed model with an application to drought and nitrogen stress trials in maize (Zea mays L.). Euphytica 161:241–257. doi:10.1007/s10681-007-9594-0
Messmer R (2006) The genetic dissection of key factors involved in the drought tolerance of tropical maize (Zea mays L.). PhD Thesis, Swiss Federal Institute of Technology, 133p.
Messmer R, Fracheboud Y, Bänziger M, Stamp P, Ribaut JM (2011) Drought stress and tropical maize: QTLs for leaf greenness, plant senescence, and root capacitance. Field Crop Res 124: 93-103. doi:10.1016/j.fcr.2011.06.010
19
of QTLs across environments for yield components and secondary traits. Theor Appl Genet 119: 913-930. doi:10.1007/s00122-009-1099-x
Messmer R, Stamp P (2010) Trends in Drought Research. Kasetsart Journal Natural Science 44: 507 – 516.
Monneveux P, Sánchez C, Beck D, Edmeades GO (2006) Drought tolerance improvement in tropical maize source populations: Evidence of progress. Crop Sci 46: 180-191. doi:10.2135/cropsci2005.04-0034
Monneveux P, Sanchez C, Tiessen A (2008) Future progress in drought tolerance in maize needs new secondary traits and cross combinations. J Agr Sci 146: 1–14. doi:10.1017/S0021859608007818
Paterniani E, Campos MS (2006) Melhoramento do milho. In: Borém A (ed) Melhoramento de espécies cultivadas, 3rd. Viçosa: Editora UFV, pp 491-552. Peterson LC, Haug H G (2003) Climate and the collapse of maya civilization: A
series of multi-year droughts helped to doom an ancient culture. American Scientist 93: 322-329.
Ribaut JM, Jiang C, González-de-León D, Edmeades GO, Hoisington DA (1997) Identification of quantitative trait loci under drought conditions in tropical maize. 1. Yield components and marker-assisted selection strategies. Theor Appl Genet 94:887-896.
Ribaut JM, Ragot M (2007) Marker-assisted selection to improve drought adaptation in maize: The backcross approach, perspectives, limitations, and alternatives. J Exp Bot 58:351–360. doi:10.1093/jxb/erl214
Ribaut JM, Betrán J, Monneveux P, Setter T (2009) Drought tolerance in maize. In: Bennetzen JL, Hake SC (eds.), Handbook of Maize: Its Biology, 1rd edn. Springer, New York, pp. 311–344.
Rivero RM, Kojima M, Gepstein A, Sakakibara H, Mittler R, Gepstein S, Blumwald E (2007) Delayed leaf senescence induces extreme drought tolerance in a flowering plant. P Natl Acad Sci USA 104: 19631-19636. doi: 10.1073/pnas.0709453104 Sax K (1923) The association of size differences with seed-coat pattern and
20
Shirasawa K, Isobe S, Hirakawa H, Asamizu E, Fukuoka H, Just D, Rothan C, Tabata S (2012) SNP discovery and linkage map construction in cultivated tomato. DNA Research 17: 381-391. doi:10.1093/dnares/dsq024
Swamy BM, Vikram P, Dixit S, Ahmed HU, Kumar A (2011) Meta-analysis of grain yield QTL identified during agricultural drought in grasses showed consensus. BMC Genomics 12: 319. doi:10.1186/1471-2164-12-319
Tanksley SD (1993) Mapping polygenes. Annu Rev Genet 27:205-233.
Tenaillon MI, Sawkins MC, Long AD, Gaut RL, Doebley JF, Gaut BS (2001) P Natl Acad Sci USA 98: 9161-9166. doi: 10.1073/pnas.151244298
Trebbi D, Maccaferri M, de Heer P, Sørensen A, Giuliani S, Salvi S, Sanguineti, M.C., Massi A, Van der Vossen EAG, Tuberosa, R. (2011) High-throughput SNP discovery and genotyping in durum wheat (Triticum durum Desf.). Theor Appl Genet 123: 555-569. Doi: 10.1007/s00122-011-1607-7.
Truntzler M, Barriere Y, Sawkins MC, Lespinasse D, Betran J, Charcosset A, Moreau L (2010) Meta-analysis of QTL involved in silage quality of maize and comparison with the position of candidate genes. Theor Appl Genet (2010) 121:1465–1482. doi: 10.1007/s00122-010-1402-x
Varshney RK, Glaszmann JK, Leung H, Ribaut JM (2010) More genomic resources for less-studied crops. Trends Biotechnol 28: 452–460. doi:10.1016/j.tibtech.2010.06.007
Vinod KK (2009) Genetic mapping of quantitative trait loci and marker assisted selection in plant crops. In vitro techniques in plantation crops. doi:htpp://kkvinod.web.com.pp.111-132.
Wang C, Chen Y, Ku L, Wang T, Sun Z, Cheng F, Wu L (2010) Mapping QTL associated with photoperiod sensitivity and assessing the importance of QTL×environment interaction for flowering time in maize. PLoS ONE 5 (11): e14068. doi:10.1371/journal.pone.0014068
21
Xu W, Rosenow DT, Nguyen HT (2000) Stay green trait in grain sorghum: Relationship between visual rating and leaf chlorophyll concentration. Plant Breeding 119:365-367
Young ND (1996) QTL mapping and quantitative disease resistance in plants. Annu Rev Phytopathol 34: 479–501
Zaidi PH (2004) Drought tolerance in maize: Theoretical considerations and practical implications. Maize Program. CIMMYT, Mexico City.
Zhu J, Wang XP, Sun C, Zhu X, Li M, Zhang G, Tian Y, Wang Z (2011) Mapping of QTL associated with drought tolerance in a semi-automobile rain shelter in maize (Zea mays L.). Agri Sci China 10: 987-996.
22 CHAPTER I 1
QTL mapping in three tropical maize populations reveals a set of constitutive
and adaptive genomic regions for drought tolerance
Abstract: Despite numerous published reports of Quantitative Trait Loci (QTLs) for
drought related traits, practical applications of such QTLs in maize improvement are scarce. Identifying QTLs of sizeable effects that express more or less uniformly in diverse genetic backgrounds across contrasting water regimes can complement significantly the conventional drought tolerance breeding efforts. We evaluated three tropical bi-parental populations under water stress (WS) and well-watered (WW) regimes in Mexico, Kenya and Zimbabwe to identify stable genomic regions responsible for grain yield (GY) and anthesis-silking interval (ASI) across multiple environments and diverse genetic backgrounds. Across the three populations, on an average, drought stress reduced the GY by more than 50% and increased the ASI by 3.2 days. We identified a total of 83 and 62 QTLs through individual environment analyses for GY and ASI, respectively. In each population, most QTLs consistently showed up in each water regime. Across the three populations, the phenotypic variance explained by various individual QTLs ranged from 2.6 to 17.8% for GY and 1.7 to 17.8% for ASI under WS environments and from 5 to 19.5% for GY under WW environments. Meta-QTL analysis across the three populations and multiple environments identified seven genomic regions for GY and one for ASI, of which six
1 Chapter submitted for publication to Theoretical Applied in Genetics (TAG-2012-015) in June 16th of
23
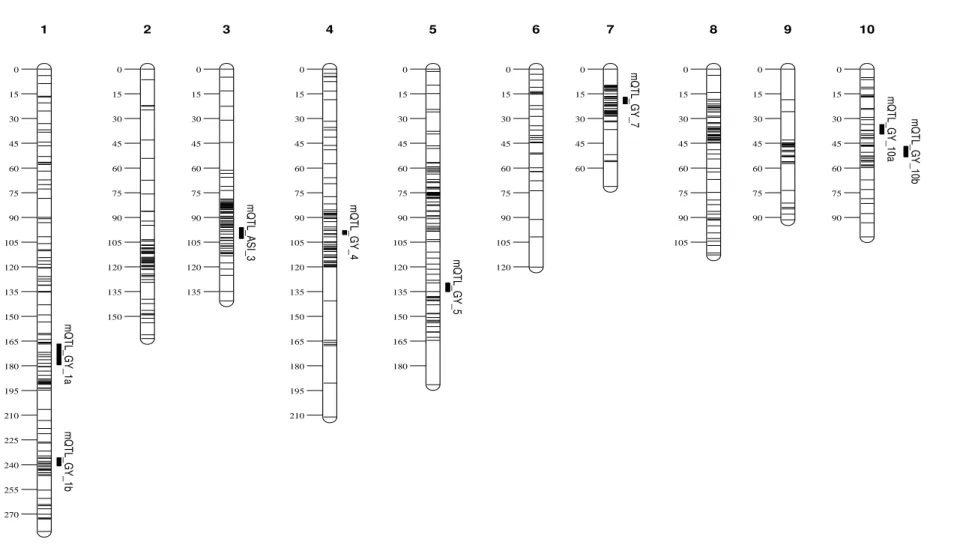
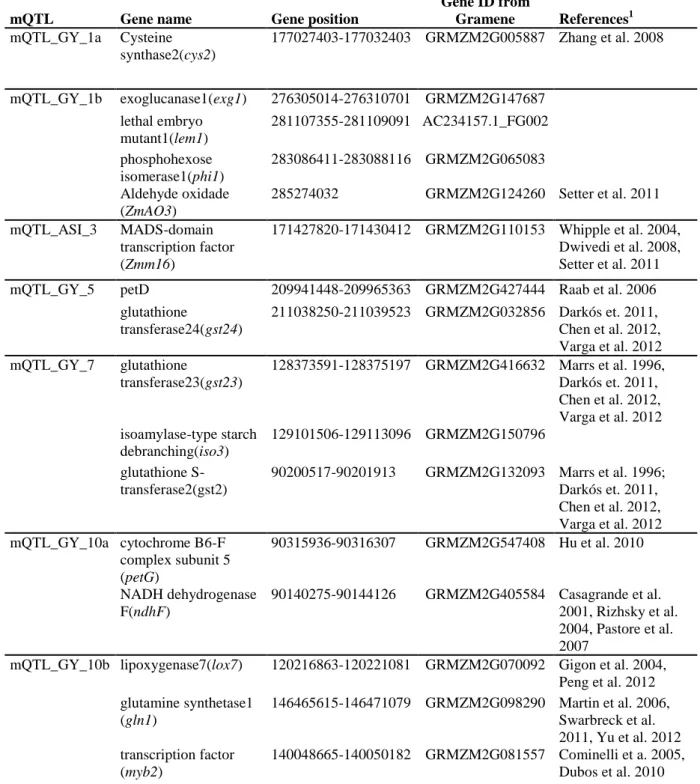
mQTLs on chr.1, 4, 5 and 10 for GY were constitutively expressed across WS and WW environments. mQTL on chr.7 for GY and one on chr.3 for ASI were found to be ‘adaptive’ to WS conditions. High throughput assays for SNPs delimiting the
physical intervals of these mQTLs have been developed. At most of the QTLs, almost equal number of favorable alleles was donated by either of the parents within each cross, thereby demonstrating the potential of DT x DT (drought tolerant x drought tolerant) crosses to identify QTLs under contrasting water regimes.
Keywords: drought tolerance, SNP, QTL x Environment Interaction, metaQTLs.
Introduction
24
Duvick et al. (2005) estimated the rate of breeding progress for temperate maize germplasm under mild drought to be 0.85% per year for hybrids released between 1930 and 1990, and slightly less under optimal conditions. The significant breeding gain in temperate maize under drought stress is mainly attributed to the use of rain-fed breeding nurseries with high plant densities and large scale multi-location testing (Banziger and Araus, 2007). Plant water and nutrient deficits occur more readily under high plant densities and the large-scale multi-location testing frequently exposed newer hybrids to drought conditions (Tsonev et al. 2009). With the introduction of ‘managed stress’ screening, especially for reproductive stage drought
tolerance, a higher breeding progress of 2 – 2.5% per year was reported (Campos et al. 2004). Despite the shorter breeding history, yield gains of 3.8% to 6.3% per year under drought and slightly less under optimal conditions were reported for tropical maize (Banziger and Araus, 2007), which were mainly associated with increased flowering synchronization, fewer barren plants, a smaller tassel size, a greater harvest index, and delayed leaf senescence (Ribaut et al. 2009).
25
In maize, QTL mapping for grain yield (GY) under water stress and other associated traits such as anthesis-silking interval (ASI) in maize has been an active area of research especially in the past two decades. The QTLs detected under water stress and well watered conditions can be categorized according to the stability of their effects across environmental conditions. A ‘constitutive’ QTL is consistently detected across most environments, while an ‘adaptive’ QTL is detected only in
specific environment such as WS conditions (Collins et al. 2008). One of the earliest studies involving tropical germplasm under managed stress conditions identified 13 QTLs on chromosome 1, 2, 4, 6, 7, 8 and 10 for grain yield, of which QTLs on chr.1 and chr.10 were stable across WW and WS environments (Ribaut et al. 1997). Since then, a number of QTLs regulating morphophysiological component traits as well as GY have been reported in maize (Malosetti et al. 2008; Messmer et al. 2009; Li et al. 2010; Messmer et al. 2011). An updated compilation of mapped QTL and major genes associated with abiotic stress tolerance including drought in maize is available at www.maizegdb.org as well as www.plantsress.com. Drought tolerance QTL studies in maize and other crops and the strategies for their use in marker assisted selection (MAS) in breeding programs have been extensively discussed in several comprehensive reviews (Ribaut and Ragot 2007; Araus et al. 2008; Collins et al. 2008; Ribaut et al. 2009; Tuberosa and Salvi, 2009).
26
al. 2008; Tsonev et al. 2009; Truntzler et al. 2010; Li et al. 2011). Integrating MAS in conventional breeding especially for drought related traits will be successful only when constitutive QTLs with effects of considerable size that express across a range of elite germplasm are identified. Meta-QTL analyses especially geared towards identification of genomic regions responsible for grain yield under water stress as well as well-watered conditions across a range of germplasm are a right step forward in this direction (Goffinet and Gerber 2000; Li et al. 2011; Swamy et al. 2011).
Single nucleotide polymorphisms (SNP) are the most common polymorphism among individuals of any species and have numerous advantages over all other marker systems such as high polymorphism, even distribution, co-dominance, high accuracy and reproducibility, high-throughput, rapid turn-around time and cost-efficiency (Xu et al. 2009; Deschamps and Campbell 2010). Most of the reported studies in maize till date have utilized SSRs for linkage map construction and QTL mapping. With the availability of whole genome sequence information in maize (Gore et al. 2009), most SNPs are physically anchored and provide an ideal platform for linkage mapping and QTL identification in maize, results of which could be easily compared with previous studies.
27
(4) propose a set of SNP markers that physically delimit the identified meta-QTLs to enable integrating marker assisted selection for drought tolerance in the conventional maize improvement programs for the tropics.
Materials and methods
Plant materials
We evaluated three tropical maize populations that were developed by the Global Maize Program of CIMMYT. Population 1: CML444xMALAWI - consisted of 234 recombinant inbred lines (RILs), developed by single seed descent method.
Population 2: CML440xCML504 - consisted of 247 F2:3 families, obtained from
randomly chosen F2 plants. Population 3: CML444xCML441 – consisted of 300 F2:3
families, obtained from randomly chosen F2 plants. Inbred lines CML444, CML441,
CML440 and CML504 were developed by CIMMYT, are adapted to mid-altitude (1000-1500 m asl) regions of sub-Saharan Africa and are considered to be tolerant to water limited conditions especially at flowering. Inbred MALAWI was developed in Zimbabwe and is considered to be relatively sensitive to water limited conditions, but has a high yield potential under optimal conditions. Inbreds CML444 and SC-Malawi are of late maturity (937 Male GDD), CML440 and CML441 mature early (824 and 870 Male GDD respectively) and CML504 is of early to intermediate maturity. Segregating families of all three populations CML444xMALAWI and CML444xCML441 were testcrossed to CML312, whereas families of CML440xCML504 were testcrossed to CML395 for phenotypic evaluations. Both testers are extremely sensitive to water scarcity.
28 Field experiments
The field experiments were conducted in Mexico (Tlatizapán station: 18ºN, 99ºW, 940m), Kenya (Kiboko station: 2º9’S, 37º75’E, 975m) and Zimbabwe (Harare station: 17°S, 31°E, 1468m and Chiredzi: 21ºS, 31ºE, 392m). Detailed characterization of these environments for drought phenotyping has been documented by Masuka et al. (2012). In Tlaltizapán, both well-watered (WW) and water stressed (WS) trials were conducted, whereas only WS trials were conducted in Kiboko. In Zimbabwe, the WW experiments were conducted in Harare and WS experiments were conducted at Chiredzi station. The soils at Tlaltizapán are classified as Vertisol, those at Kiboko are Arenosol, while the soils at Harare and Chriedzi are Alfisol. The trials were conducted in 2010 (both WW and WS) and 2011 (WS) in Mexico, whereas in Kenya and Zimbabwe the trials were conducted in 2010. In Zimbabwe the trials were planted in May at Chiredzi and Octuber at Harare. In Kenya trials were planted in June during the rain free period. Abbreviations for well watered environments were Mexico (MWW), Zimbabwe (ZWW) and water stress environments were Mexico in 2010 (MWS10), Mexico in 2011 (MWS11), Kenya (KWS) and Zimbabwe (ZWS).
29
planted with two seeds per hill and thinned to one plant per hill three weeks after planting resulting in a plant population of approximately 53,333 plants ha-1. Fertilizers, insecticides and herbicides were applied as required and in accordance with local recommendation practices. Drought stress was applied according to the established protocols in CIMMYT (Banziger et al. 2000), which is briefly described as below. In Mexico, water was applied to WS trials through furrow irrigation method at 10 days interval, until three weeks before the expected time of anthesis date (AD) in each population. This stress condition was maintained until five weeks after 50% of the families flowered. One more irrigation was applied during grain filling. The WS trials in Zimbabwe and Kenya were irrigated with sprinklers once a week until six and two weeks before and after flowering, respectively. In WW trials at all the locations, the soil moisture was maintained at about at field capacity.
The anthesis silking interval (ASI) was measured as the difference between the silking-date (SD) and anthesis-date (AD) in days (Bolaños and Edmeads 1996). AD is number of days from sowing to at least 50% of the pollen released per plot. SD is number of days from sowing to at least 50% silk emergence per plot. Mature ears were harvested manually, bagged, air-dried and shelled using an electric shelling device. The total grain yield of each plot was weighed on an electronic balance and converted to GY (t/ha) by dividing the total grain weight per plot by the plot area.
Statistical analyses of phenotypic data
Variance components were estimated from the standardized plot raw data by linear mixed model analysis using PROC MIXED of SAS (REML option). In all cases, AD was used as covariate. For individual analyses using alfa-lattice design and adjusting by a covariate, using the same syntaxes as in the SAS programs, the model is:
ijk k
i j i
ijk p Block p Gen Cov
30
µ is the mean effect, Repiis the effect of the ith replicate, Blockj(Repi) is the effect of the jth incomplete block within the ith replicate, Genkis the effect of the kth genotype, Cov is the effect of the covariate, and ijk is the error associated with the ith replication, jth incomplete block, and kth genotype, which is assumed to be normally and independently distributed with mean zero and homocedastic variance 2.
For the combined analyses across locations by management or across all locations, the above models incorporate new terms. For the lattice design adjusted by
a covariate, the model is:
ijkl l
i l
j i k i
j i
ijkl Loc p Loc Block Loc p Gen Loc Gen Cov
Y Re ( ) ( Re ) ( ) ,
where the new terms Loci and (LociGenl) are the effects of the ith location and the location × genotype interaction, respectively.
When we are interested in calculating the BLUEs (LS means), both the genotypes and the covariate are considered fixed terms while all other terms are declared random terms; for calculating the broad-sense heritability, all terms are considered random, except the covariate. The broad-sense heritability was estimated by the formula: ⁄ ⁄ , where is the genotypic variance,
is the genotype x environment interaction, is the error variance, l is the
number of environments and r is the number of replications in each trials.
For phenotypic and genotypic correlation the data was not adjusted by the covariate (AD). The phenotypic correlations among traits were calculated as simple Pearson’s correlation coefficients based on adjusted and standardised phenotypic data.
31 Genetic maps
Genomic DNA was extracted from young leaves collected in a bulk of 15 plants per family/RIL and according to CIMMYT’s Laboratory Protocols (CIMMYT, 2001).
Genotyping was done with selected polymorphic markers for each population, from a set of 1536 SNPs (Yan et al. 2009). SNP genotyping was performed at Kbiosciences, UK using the KasPar chemistry.
Linkage maps in all the three populations were constructed using QTL IciMapping ver. 3.2 software (http://www.isbreeding.net) using the twin criterion of more than 3.0 LOD (Li et al. 2007). The recombination frequency between linked loci was transformed into centimorgan (cM) distances using Kosambi’s mapping function
(Kosambi 1944). In CML444xMALAWI, an integrated linkage map was constructed using 216 SNPs and 160 SSRs previously describe by Messmer et al. (2009; 2011), with which the length of the map was 2,349.23 cM. For the F2:3 populations,
CML440xCML504 and CML444xCML441, linkage maps were constructed using
194 and 265 SNPs, with 2,712.38 and 3,558.33 cM, respectively. The three distinct genetic maps were merged into a single integrated map using MetaQTL software version 1.0 (Veyrieras et al. 2007). The distances between adjacent markers from all individual maps were rescaled in Haldane unit. After integration of all the three maps, a consensus map of 620 markers was obtained. The consensus map had a total length of 1,484.45 cM with an average distance of 2.39 cM between markers (Fig. 1).
QTL analysis
Single and multiple environment QTL analysis
32
Three procedures were realized to identify QTL in each population as follow: (1) mapping QTL for each individual environment, (2) mapping stable QTLs across combined WW and combined WS environments within each population and (3) mapping stable QTLs across all locations within each population. In all procedures the walking step in QTL scanning was 1 cM and likelihood odds (LOD) threshold of 2.5 was chosen for declaring the putative significant QTLs (Ribaut et al. 1997; Tuberosa et al. 2002). The stable QTLs were declared when the LOD of the QEI was below the threshold limit (LODQEI ≤ 2.5). For F2:3 populations, additive (a) and
dominance (d) effects for each QTL as provided by QTL IciMapping v.3.2 were used to calculate the ratio of dominance level |d/a| and classified the nature of QTLs as per the criteria of Stuber et al. (1987), as follow: additive (A) = 0–0.20; partial dominance (PD) = 0.21–0.80; dominance (D) = 0.81–1.20, and overdominance (OD) > 1.20. The sign of the additive effects of each QTL was used to identify the origin of the favorable alleles as proposed by Lubberstedt et al. (1997).
QTL meta-analysis
QTL meta-analysis was performed with the MetaQTL software version 1.0 (Veyrieras et al. 2007). The statistical method implemented in this software hypothesizes that the input mapping studies are independent from each other. If redundant QTLs in the
same population in different environments were detected, only QTLs with the highest effect (R2) were kept in the analysis. The QTL intervals that were not supported by a
33
adopted in meta-QTL analysis, see Danan et al. (2011).
Results
Phenotypic evaluations across different environments under two water regimes
The estimated means, genetic variance components, heritability and correlation between GY and ASI for the three populations are listed in Table 1. In general,
drought stress significantly reduced the GY and increased the ASI across all the environments. In Mexico, between MWW and MWS10, the GY reductions were 41.3%, 28.8% and 47.2% in CML444xMALAWI, CML440xCML504 and
CML444xCML441, respectively. In MWS11, the reduction in GY was more than 50% in all the three populations. The comparatively lower GY reduction in MWS10 was due to the unexpected rainfall in January (20.0 mm) and February (68.0 mm) of
2010. Across the three populations, combined GY means across all environments ranged from 1.91 to 9.23 t/ha, whereas GY under stress ranged from 0.1 to 6.76 t/ha.
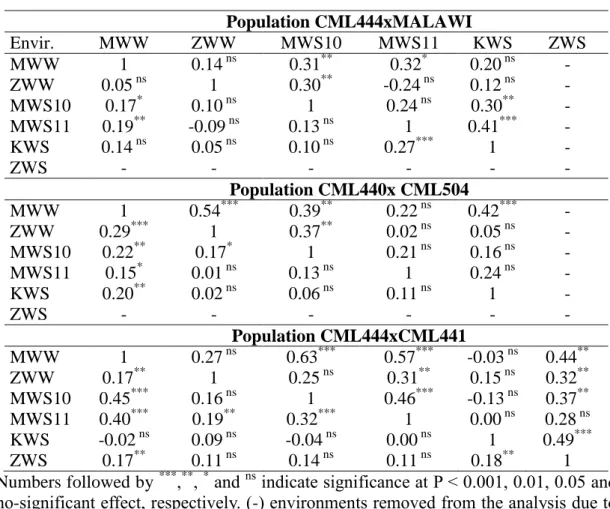
Across all the three populations, strong Genotype x Environment interaction (GEI) was observed while no significant negative correlation among locations was noted (Table S1) indicating wider adaptability of these populations across diverse
environments.
Among the three populations, drought stress was most effective in
CML444xCML441, which showed 63% GY reduction and 94% increase in ASI, based on combined water stress (WS) trials. Among the three populations, heritability
for GY under combined WS (h2GYws) ranged from 0.31 to 0.46, while under combined
WW environments (h2
GYww), from 0.1 to 0.3. Strong GEI for WW locations (as
indicated by lower h2
GYww) and weak GEI (as indicated by higher h2GYws) in two
34
drought tolerant genotypes across diverse environments. CML444, which is the
common parent shared by these two populations had been previously shown to be stable and high yielding under WS conditions (Messmer et al. 2009). Across the three populations, on an average, mean ASI increased by 3.3 days under WS conditions and
mean ASI ranged between 0.12 to 11.2 days, while under WW conditions, from -2.0 to 7.0 days. The genetic variance of the ASI was higher in WS environments than in
WW in all the three populations. Notably, the heritability of the combined analysis in WS environments (h2
ASIws) was 0.5 and above, whereas h2ASIww in WW environments
was 0.15 or below. This reinforces the earlier findings (Messmer et al. 2009, Lu et al.
2011) that reduced ASI is an important common drought adaptive mechanism among different drought tolerant genotypes. Significant and negative phenotypic (rp) and
genotypic (rg) correlations between GY and ASI were observed across all WS
environments across the three populations (Table 1). These correlations were mostly non-significant in WW environments. In some locations, it was not possible to estimate the rg values because of the very low genetic variance for ASI, which were
35
Table 1. Estimates of means, genetic variance components, heritability and phenotypic ( ) and genotypic ( ) correlations between grains yield (GY) and anthesis-silking interval (ASI) for families on the three populations in single and multi-environments
CML444xMALAWI
Env.
GY (ton/ha) ASI (days) Correlations
Mean Max Min CV Mean Max Min CV
MWW 9.60 14.69 4.43 1.41 - 2.68 0.51 17.64 0.74 5.31 -1.48 0.25 - 0.78 0.39 127.88 -0.06ns -0.14ns ZWW 7.19 12.33 3.10 0.56 - 3.85 0.22 30.13 0.91 13.50 -1.00 0.05 ns - 0.67 0.13 91.01 -0.05ns -0.45** MWS10 5.64 10.50 1.57 1.50 - 1.33 0.74 22.35 2.06 5.99 -2.47 0.65 - 2.29 0.36 74.23 -0.28** -0.36** MWS11 4.30 8.15 1.81 0.79 - 2.18 0.63 25.55 4.10 9.53 0.42 1.92 - 3.30 0.54 49.86 -0.51*** -0.87*** KWS 3.83 5.96 2.05 0.36 - 0.46 0.61 19.74 2.02 7.21 0.07 0.83 - 1.34 0.55 60.19 -0.40** -0.67*** WW 8.58 11.60 5.54 0.14 0.56** 2.96 0.10 19.14 0.87 7.00 -0.75 0.07 ns 0.08ns 1.57 0.14 118.11 -0.05ns NAф WS 4.64 6.76 2.20 0.21 0.91*** 1.03 0.31 24.61 2.83 8.34 0.12 0.57 0.68*** 2.34 0.48 45.67 -0.53** NAф ALL 6.14 8.33 3.68 0.22 0.84*** 1.95 0.38 15.99 2.03 5.11 -0.15 0.28 0.52*** 2.05 0.48 44.27 -0.21** NAф
CML440xCML504
MWW 8.61 12.29 4.95 0.86 - 0.77 0.69 10.66 0.85 3.01 -0.50 0.12 - 0.73 0.25 104.06 -0.14* -0.41* ZWW 11.39 17.94 6.37 1.47 - 3.95 0.43 18.34 -0.06 2.50 -2.00 0.00 ns - 1.33 0.00 -1946.11 -0.10ns -NAф MWS10 6.13 8.23 3.56 0.34 - 0.71 0.49 15.00 2.37 8.33 -0.32 0.39 - 1.77 0.31 59.67 -0.09ns -0.24* MWS11 4.25 6.59 1.86 0.51 - 0.42 0.71 17.40 4.66 9.89 1.73 1.16 - 2.06 0.53 33.42 -0.53*** -0.86*** KWS 4.24 5.94 2.69 0.11 - 0.47 0.32 17.65 2.50 5.53 0.38 0.42 - 1.04 0.45 42.85 -0.28** -0.66** WW 10.00 14.22 6.88 0.61 0.55* 2.40 0.41 13.59 0.40 1.81 -0.79 0.01 ns 0.03ns 1.14 0.04 195.24 -0.09* NAф WS 4.88 6.36 3.38 0.11 0.22** 0.56 0.39 12.35 3.18 6.15 1.18 0.39 0.26*** 1.63 0.52 27.47 -0.26** -0.65** ALL 6.93 9.23 5.00 0.23 0.46** 1.31 0.51 9.95 2.07 3.78 0.67 0.18 0.22*** 1.41 0.48 30.34 -0.21* -0.56**
CML444xCML441
MWW 10.81 14.15 2.93 1.73* - 1.33 0.72 10.67 0.35 2.96 -2.03 0.17 - 0.38 0.47 186.81 -0.15* -0.25* ZWW 8.99 12.67 2.47 0.96* - 1.75 0.52 14.71 0.33 2.00 -2.00 0.00 ns - 0.33 0.00 339.80 0.15ns 0.07 ns MWS10 5.71 9.33 0.74 1.04* - 0.84 0.71 17.56 3.07 7.32 0.45 0.92 - 1.20 0.61 38.17 -0.35*** -0.55*** MWS11 5.33 8.33 2.08 0.71* - 0.68 0.67 17.55 4.70 9.04 0.37 1.14 - 1.74 0.57 30.89 -0.33*** -0.45** KWS 1.83 3.40 0.09 0.02 - 0.42 0.11 37.15 6.85 15.81 1.51 2.00 - 7.23 0.36 42.73 -0.61** NAф ZWS 1.81 3.40 0.39 0.06 - 0.48 0.19 39.59 8.00 16.25 0.66 0.24 - 12.43 0.04 45.27 -0.33*** NAф WW 9.91 12.66 3.27 0.38 1.05*** 1.50 0.30 15.82 0.34 3.00 -2.00 0.09 0.00ns 0.76 0.32 218.10 -0.21** NAф WS 3.66 5.79 0.10 0.15 0.36*** 0.63 0.46 18.25 5.65 11.22 1.48 0.72 0.37*** 5.42 0.48 33.34 -0.39*** NAф ALL 5.73 7.53 1.91 0.30 0.49*** 0.91 0.66 11.53 3.88 7.54 -0.29 0.44 0.33*** 3.99 0.53 27.03 -0.67*** NAф
36 QTL analysis
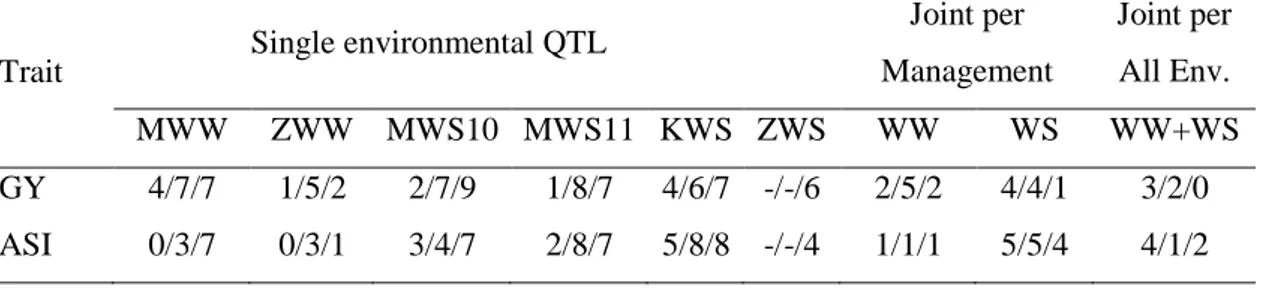
Single environment QTL analyses revealed 83 and 70 significant QTLs for GY and
ASI, respectively, among the three populations (Table 2) with varying magnitude of effect sizes. In general, both parents in each of the three populations contributed
positive alleles for both the traits. Most of the QTLs exhibited strong QEI, which was expected keeping in view the diverse environments across Latin America and Africa. In the RIL population of CML444xMALAWI, fewer number of QTLs were identified
due to non-detection of dominant QTLs. QTLs detected in the two other F2:3
populations across WS and WW environments predominantly showed partial to
overdominant effects. In the population, CML440xCML504, around 30% of the QTLs for GY and 15% for ASI had additive effects (Table S2). Maximum number of
QTLs was detected in CML444xCML441, in which however, only 10% of the QTLs had additive effects for GY and ASI (Table S4).
Table 2. Number of QTLs detected by three different mapping procedures in populations CML444xMALAWI, CML440xCML504 and CML444xCML441
Trait Single environmental QTL
Joint per Management
Joint per All Env.
MWW ZWW MWS10 MWS11 KWS ZWS WW WS WW+WS
37
CML444xMALAWI (Tolerant x Intermediary susceptible)
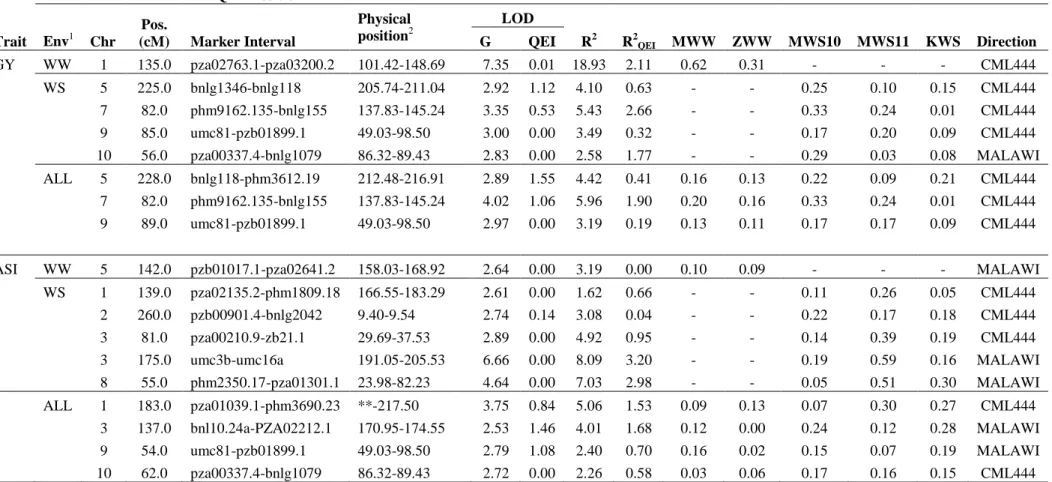
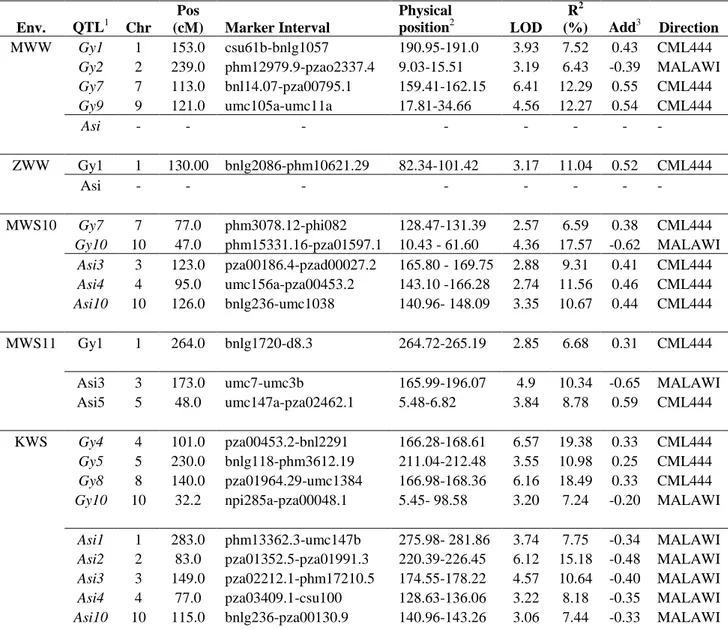
The single location, individual analyses revealed QTLs for GY on almost all the chromosomes, except on chr.3 and chr.6 (Table S2). In the combined analysis across WW environments, one QTL on chr.1 (at about 135.0 cM, 101.42-148.69 Mb) had large additive effects (0.62 t/ha in MWW and 0.31 t/ha in ZWW) and explained around 19% of the phenotypic variance (Table 3). This QTL also consistently showed
up in the individual WW analyses (Table S2). The low R2QEI (2.1%) indicated the
more stable nature of this QTL across WW environments. For ASI, we detected a minor QTL on chr.5 that explained around 3% of phenotypic variance across WW
environments.
The combined analysis across WS environments revealed four significant
QTLs for GY on chr.5, chr.7, chr.9 and chr.10. Interestingly, of the four QTLs, one on chr.10 was contributed by MALAWI, which is known to be more sensitive to drought stress (Messmer et al. 2009). QTLs on chr.5, chr.7 and chr.9 were also detected across
ALL environment analysis, indicating their possible utility in selection decisions across WW and WS environments. Though none of these QTLs explained more than
6% of phenotypic variance for GY, most had very low R2QEI values indicating their
stable nature across diverse environments. Viewed in conjunction with heritabilities for GY (0.31 in WS and 0.38 in ALL), these QTLs explain 7 to 18% of the genetic
variance, which certainly merits their attention in marker based selection indices. The QTL on chr.5 was particularly interesting as it had relatively higher additive variance
(R2 = 4.1) as compared to R2QEI (0.63), which indicates its consistent performance
across WS environments. In one of the WS environments (KWS), it explained close to 11% of phenotypic variance for GY (Table S2). In terms of additive genetic effects in
38
on chr.7 had the highest additive genetic effect of 0.33 t/ha in MWS10. We detected
five significant QTLs on chr.1, chr.2, chr.3 and chr.8 for ASI based on the combined WS environments, of which, the QTL on chr.3 (191.05 – 205.53 Mb) explained the largest (8%) phenotypic variance (Table 3) and also got detected in all individual WS
environment analyses (Table S2). Contrary to QTLs for GY, most of the QTLs detected between WS and ALL environments for ASI were different.
CML440xCML504 (Tolerant x Tolerant)
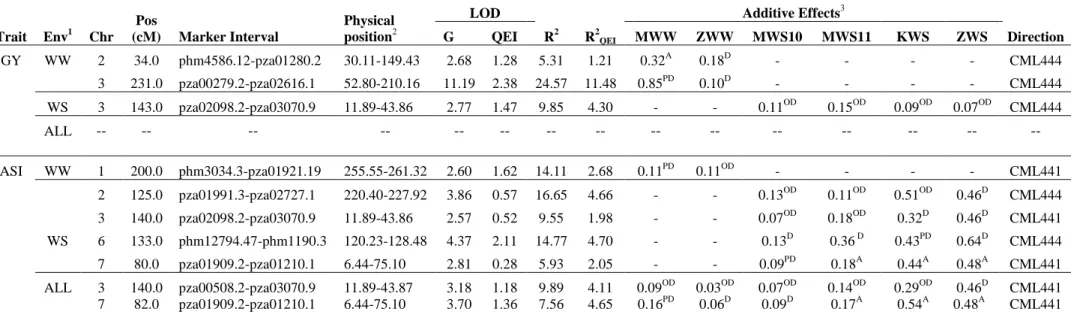
The individual location QTL analyses for this population revealed 33 and 20 significant QTLs for GY and ASI, respectively, spread across all 10 maize chromosomes (Table S3). Unlike the CML444 x MALAWI (Tolerant x Intermediary susceptible) population, here, both the parents contributed with good number of QTLs influencing positively GY and ASI. Under WW conditions, both the parents contributed equally the favorable alleles at detected GY-QTLs, while CML440 contributed around 66% of favorable alleles for ASI QTLs. In WS environments, CML440 contributed 57% and 60% of favorable alleles at GY-QTLs and ASI-QTLs respectively. The phenotypic variance explained by individual location QTLs for GY ranged from 1.5 to 16% (Table S3).
In the combined analysis across WW environments, we detected five QTLs on chr.2, chr.4, chr.6, chr.8 and chr.9 for GY, which individually explained phenotypic variances ranging from 11 to 20%. As indicated by R2QEI, except one QTL on chr.9,
all the others were consistent across WW environments. The QTL on chr.2 appeared very stable (R2QEI = 0.55) and explained around 20% of the phenotypic variance for
39
allele came from CML504. The other four GY-QTLs detected for WW environments were either partially dominant or over-dominant (Table 4). We detected four GY-QTLs in the combined analysis across three WS environments on chr.1, chr.5, chr.7 and chr.10, which individually explained phenotypic variances ranging from 7 to 17%. The predominant gene action was that of over-dominance for most QTLs detected under WS environments. The effect sizes in different WS environments for these GY-QTLs ranged from 0.02 to 0.18t/ha. The QTL on chr.7, which explained the largest phenotypic variance of 17% for GY in the combined WS analysis, was also detected in all the three individual WS environment analyses (Table S3). The QTL on chr.10 was also identified in two single WS environment analyses (Table S3). At the four GY-QTLs identified, CML504 contributed the favorable alleles for three of them (Table 3). The two QTLs on chr.2 and chr.6 identified in the WW analysis also showed up in the combined (ALL) analysis. We identified four QTLs for ASI based on combined analysis across the three WS environments on chr.2, chr.3, chr.5 and chr.9, which individually explained phenotypic variances varying from 8 to 15%. The ASI-QTL on chr.5 was the same as detected for GY in the combined WS analysis, corroborating the strong genotypic and phenotypic correlation between these two traits, especially under drought stress conditions. The QTL on chr.2 explained the largest phenotypic variance (15%) for ASI, performed consistently across the three WS environments (R2QEI = 1.9) with effects ranging from 0.14 to 0.36 days. The QTL