___________________________
Corresponding author:Ana Nikoli , Maize Research Institute „ZemunPolje“,S. Baji a 1, 11185 Belgrade, Serbia,e-mail: [email protected]
UDC 575:633.15 DOI: 10.2298/GENSR1302341N
Original scientific paper
IDENTIFICATION OF QTL-s FOR DROUGHT TOLERANCE IN MAIZE, II : YIELD AND YIELD COMPONENTS
Ana NIKOLI , Violeta ANDJELKOVI , Dejan DODIG, Snežana MLADENOVI DRINI , Natalija KRAVI , Dragana IGNJATOVI -MICI
Maize Research Institute „ZemunPolje“, Belgrade, Serbia
Nikoli A., V. An elkovi , D. Dodig, S. Mladenovi Drini , N.Kravi and D. Ignjatovi Mici (2013): Identification of Qtl-s for drought tolerance in maize, II : Yield and yield components. Genetika, Vol 45, No. 2, 341-350.
Grain yield is the primary trait of interest in maize breeding programs. Worldwide, drought is the most pervasive limitation to the achievement of yield potential in maize. Drought tolerance of maize has been considerably improved through conventional breeding. Traditional breeding methods have numerous limitations, so development of new molecular genetics techniques could help in elucidation of genetic basis of drought tolerance .In order to map QTLs underlying yield and yield components under drought 116 F3 families of DTP79xB73 cross were evaluated in the field trials. Phenotypic correlations calculated using Pearson’s coefficients were high and significant. QTL detection was performed using composite interval mapping option in WinQTL Cartographer v 2.5. Over all nine traits 45 QTLs were detected:five for grain yield per plant and 40 for eight yield components. These QTLs were distributed on all chromosomes except on chromosome 9. Percent of phenotypic variability determined for the identified QTLs for all the traits was in the range from 27.46 to 95.85%. Different types of gene action were found for the QTLs identified for analyzed traits.
Key words:
drought tolerance, maize, QTLs, yield, yield
components
INTRODUCTION
by conventional breeding programs remains a slow, laborious and mostly empirical process. In consequence, significant efforts have been made in identification of specific traits that have higher heritability than yield per se and contribute to its increase under drought. Improvement in grain yield can be achieved by increasing a value of yield components (GUPTA et al., 2006) because they have higher heritability than grain yield (MESSMER et al., 2009).
Development in plant molecular genetics have given new opportunities for drought tolerance improvement (GUO et al., 2008; MARINO et al., 2009; ANDJELKOVIC and IGNJATOVIC
-MICIC, 2011). Quantitative genetics, with wide range of molecular markers available, provide identification of the genetic factors (quantitative trait loci-QTLs) responsible for expresion of traits (DEKKERS and HOSPITAL, 2002). The identification of QTL for grain yield and its components is very important for all QTL studies because increasing yield production under drought conditions is the first target of all breeding programs. Also, the coincidence of QTLs for yield and for other traits provides information on traits likely to be responsible for effect on yield (QUARRIE et al., 2006).
Indirect selection for marker loci linked to QTLs for the traits of interest could enhance selection efficiency. The possibility to compare localization of QTLs with that of mutants and EST (expressed sequence tagged) clones of known function could give us important information about potential candidate genes for the analyzed traits and this may be the first step in eventual cloning of loci underlying quantitative trait variation (PETERS et al., 2003).
In this study, the objective was to map QTLs conferring the expression of yield and yield components under drought stress conditions, to identify common QTLs for different traits and to compare the results with those obtained in other maize populations.
MATERIALS AND METHODS
The information about material and methods used in this study have been previously given in NIKOLIC et al. (2011) and will be only briefly reported here.
Plant materials and field trials
An F2 population derived from the cross DTP79 (inbred line extracted from Drought Tolerant Population) and B73 (drought susceptible maize line) was used to construct the genetic linkage map. The 116 corresponding F3 families were evaluated in the field. The experiment was arranged in a random complete block design with tree replicates. A total of 20 plants per genotype after thinning were grown at a row. Measurements were performed on ten randomly chosen plants per genotype from all tree replicas and then mean value for each family was calculated. Grain yield per plant (GY), number of rows per ear (NRE), number of kernels per row (NKR), ear length (EL), ear weight (EW), ear diameter (ED), 1000-kernel weight (KWT), kernel length (KL), kernel width (KW) and kernel thickness (KT) were determined after drying.
-Grain yield (GY) was expressed in grams per plant.
-Number of rows per ear (NRE) is the average number of rows of 10 primary ears. -Number of kernels per row is the average number of kernels per row of 10 primary ears. -Kernel weight (KWT) is the weight (g) of a 1000-kernel sample taken from each genotype.
-Kernel length (KL) is 10-kernel length (cm) estimated from the average of five measurements of the length of 10 kernels in the middle of an ear.
-Kernel width (KW) is 10-kernel width (cm) estimated from the average of five measurements of the length of 10 kernels in the middle of an ear.
-Kernel thickness (KT) is 10-kernel thickness (cm) estimated from the average of five measurements of the length of 10 kernels in the middle of an ear.
Molecular analysis
Detailed description of molecular map construction is given in NIKOLIC et al. (2011).
Statistical analysis
Pearson correlation coefficient was used for calculating phenotypic correlations between the analyzed traits. QTL analysis was performed using composite interval mapping in WinQTL cartographer, version 2.5 (http://statgen.ncsu.edu). A LOD score treshold of 2.0 was selected for QTL detection. Information about number, position, effect and phenotypic variance explained by detected QTLs was obtained from WinQTL cartographer.
Level of dominance (for each QTL detected) and average dominance for each trait were determined as described in NIKOLIC et al. (2011).
RESULTS
Phenotypic relationships among the traits
Phenotypic correlations between analyzed traits are presented in Table 1.
Six of eight analyzed yield components showed significant phenotypic correlation with yield. Highly significant positive correlation (P<0.001) beetween yield and four yield components was detected – NKR, NRE, EL and ED. Kernel thickness (KT) was significantly negatively correlated (P<0.001) with yield. Besides significant correlation with yield, yield components were also higly correlated among themselves. Kernel weight (KWT) was significantly correlated only with kerenel width (KW). Kernel lenght (KL) showed highly significant positive correlation with kernel width (KW) and highly significant negative correlation with ear diameter (ED). Number of kernels per row (NKR), number of rows per ear (NRE), ear diameter (ED) and kernel thickness (KT) showed highly significant negative correlation between themselves.
QTL analysis
Table 1 Phenotypic Pearson correlations among different traits: grain yield (GY), number of rows per ear (NRE), number of kernels per row (NKR), 1000 kernels weight (KWT), ear length (EL), ear diameter (ED), kernel length (KL), kernel width (KW) and kernel thickness (KT)
GY NRE NKR KWT EL ED KL KW KT
GY 1
NRE 0.602*** 1
NKR 0.641*** 0.639*** 1
KWT 0.135 0.076 0.073 1
EL 0.368*** 0.661*** 0.291** 0.155 1
ED 0.674*** 0.678 *** 0.568*** 0.109 0.411*** 1
KL 0.223* 0.079 0.079 0.105 0.019 -0.327** 1
KW 0.192 0.044 -0.022 0.325** 0.150 -0.197 0.741*** 1
KT -0.605*** -0.717*** -0.629*** 0.080 -0.232* -0.481*** -0.159 -0.062 1
Significant * 0.218 at P<0.05, ** 0.280 at P<0.01, *** 0.328 at P<0.001
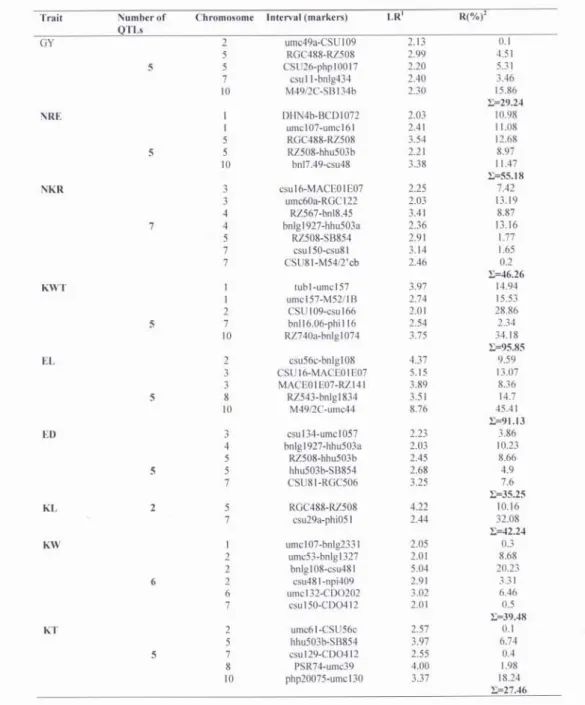
Table 2a Intervals containing QTL with a LOD score of >2.0 (abbreviations as per Table 1)
1
likelihood ratio test statistic, 2
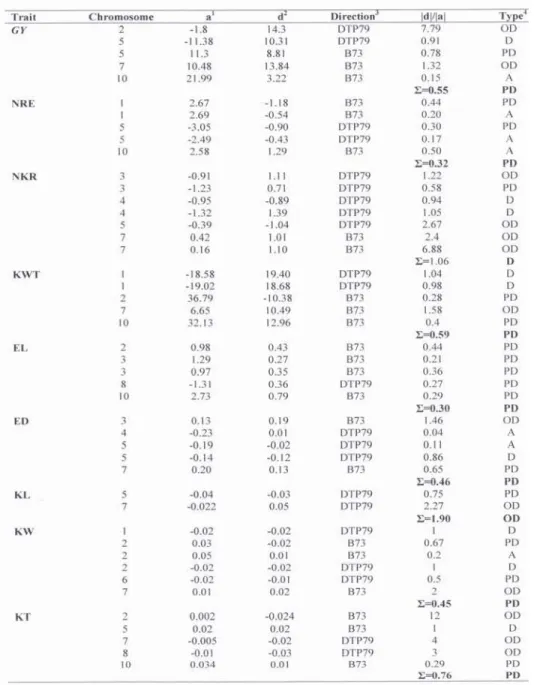
Table 2b Effects and types of individual gene action of QTLs for analyzed traits(abbreviations as per Table 1)
1additive effect, 2 dominant effect, line that increases the value of the trait, 4type of gene action
Yield
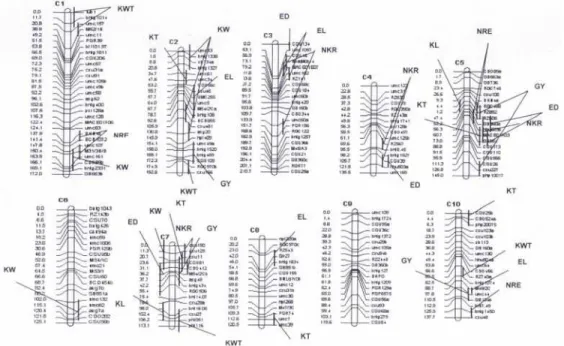
A total of five yield QTLs were identified. One QTL was identified per chromosomes 2, 7 and 10, while two QTLs were identified on chromosome 5. The percentage of variation explained by these QTLs ranged from 0.1 to 15.86%. Parental line DTP79 contributed the alleles at two of five detected QTLs (Table 2b), while alleles incresing the trait came from parental line B73 for the other three QTLs. Estimates of genetic effects revealed different types of gene action. QTLs detected on chromosome 2 and 7 displayed dominance effect (overdominance), two QTLs on chromosome 5 exibited partial dominance and dominance effect and only one QTL for yield mapped on chromosome 10 showed additive gene action (Table 2). Partial dominance was average level of dominance.
Yield components
Forty QTLs were mapped for eight yield components on all chromosomes except on chromosome 9. Five QTLs were identified for NRE on chromosomes 1, 5 and 10 and seven for NKR on chromosomes 3, 4, 7 and 10. For KWT, five QTLs were mapped on four chromosomes (1, 2, 7 and 10). Also, five QTLs influenced EL (on chromosomes 2, 3, 8 and 10) and five were identified for ED (on chromosomes 3, 4, 5 and 7), too. A total of 13 QTLs for kernel traits were detected, two for KL (chromosomes 5 and 7), six for KW (chromosomes 1, 2, 6 and 7) and five for KT (chromosomes 2, 5, 7, 8, 10).
For most of the analyzedyield components, both parental lines contributed toward the increase of the trait values for the identified QTLs (Table 2b). The only exception was KL - only alleles from DTP79 line contributed toward increase of trait value.The phenotypic variance explained by individual QTL for these traits ranged from 0.1 for KT to 45.41% for EL.
The level of dominance ranged from additive to overdominance, and the average level of dominance was partial dominance for most of the traits. Only NKR showed dominance and KL overdominance as average level of dominance.
Coincidence of QTLs for yield and yield components
Regions of QTLs for GY, KL and one QTL for NRE overlapped on chromosome 5.Chromosome region harbouring coinciding QTLs affecting GY, NKR, ED, KW, KT were found on chromosome 7. And finally, coincident QTL for GY and EL was found on chromosome 10.
Coincidence of QTLs for yield and yield components
QTL coincidence between EL and NKR was found on chromosome 3, while QTL affecting NKR partialy overlapped with one QTL for NRE, two QTLs for ED and QTL for KT on chromosome 5.
DISCUSSION
A total of 45 QTLs were identified for yield and yield components under drought stress conditions. Genomic regions involved with the analyzed traits were detected in nine out of ten maize chromosomes.
phenotypic variation) were identified in different studies on different crops (AJMONE-MARSON et al., 1995; GEORGIADY et al.,2002; GYENIS et al., 2007). Also, the phenotypic variance explained by all QTLs for three yield components (NRE, KWT and EL) was greater than 50%. However, smaller phenotypic variations were also found on maize (GUO et al., 2008)
Gene action was partial dominance to overdominance for most of the QTLs for all traits evaluated. Regions characterized by additive effects were less common. Large percentage (82%) of all mapped QTLs (38) showed dominant effect. Average level of dominace for GY was partial dominance. SIBOV et al. (2003) also reported partial dominance as average level of dominance for grain yield in the tropical maize population evaluated. It is well known that overdominance or dominance for tolerance to drought stress is the preferable type of gene action.
Significant correlation between two traits and identification of QTLs for these traits in the same genomic region could indicate pleiotropic effects or linkage between the QTLs (SANGUINETI et al., 1999). Grain yield presented significant correlation with almost all yield components except KWT and KW. Coincident QTLs were found for GY and almost all yield components which were significantlly correlated with yield (NRE, NKR, EL; ED; KL and KT). It is generally accepted that genes affecting yield components have pleiotropic effects on yield and this relationship also may exist in this case.
There are differences in number, position or genetic effects of QTLs for the same traits between different studies which probably resulted from the experimental differences such as parents, population, ecological conditions or genetic map. QTLs found in this study were also compared with previously identified QTLs in different studies. The same QTLs for yield were identified on chromosomes 2 and 5 by AGRAMA and MOUSSA (1996), while GUO et al. (2008) found another QTL on chromosome 2. Various authors (RIBAUT et al., 1997; MELCHINGER et al., 1998) found QTLs for this trait on chromosome 7 (7.04 - 7.05) very close to the region the QTL for yield was detected in this study (7.2 - 7.3 bins). Near this region HUANG et al. (2010) also found a QTL for yield. QTLs for NRE identified in this study were the same as QTLs for this trait detected on chromosome 1 and 10 by AUSTIN and LEE (1996) and also QTLs for EL identified on chromosomes 2, 3 and 8 by STUBER et al. (1992). Presented results confirm the fact that QTLs detected in this study could represent genomic regions common to different populations. These QTLs could be considered as stabile QTLs and important for marker-assisted selection.
CONCLUSION
Detecting QTLs for desirable traits is only a first step and much further work is neccessary to truly dissect quantitative variation. Fine-mapping of the QTL is very important if the QTL information will be used in applied research. Once fine-mapped, QTL can serve as useful tool for possible candidate gene detection for analyzed traits. Recent development in molecular marker technology is expected to enable greater power in detection of QTL for agronomicaly important traits and utilization of QTL information for crop improvement.
ACKNOWLEDGEMENT
This study was part of the project TR31068 of Ministry of education, science and Technological development Republic of Serbia.
Received September03th
, 2012 Accepted April 06th
, 2013
REFERENCES
AGRAMA, H.A.S. and M.E. MOUSSA (1996): Mapping QTLs in breeding for drought tolerance in maize (Zea Mays L.). Euphytica 91:89-97.
AJMONE-MARSAN, P., G. MONFREDINI, W.F. LUDWIG, A.E. MELCHINGER, P. FRANCESCHINI, G. PAGNOTTO and M. MOTTO (1995): In an elite cross of maize a major quantitative trait locus controls one-fourth of the genetic variation for yield. Theor. Appl. Genet. 90:415–424.
ANDJELKOVIC, V. and D. IGNJATOVIC-MICIC (2011): ESTs analysis in maize developing kernels exposed to single and combined water and heat stresses. Sci. Agric. 68, 353-360.
AUSTIN, D.F. and M. LEE (1996): Comparative mapping in F2:3 and F6:7 generations of quantitative trait loci for grain yield
and yield components in maize. Theor. Appl. Genet. 92, 817-826.
DEKKERS, J.C.M., and F. HOSPITAL (2002): The use of molecular genetics in the improvement of agricultural populations. Nature Reviews 3:22-32.
GEORGIADY, M. S., R. W. WHITKUS and E. M. LORD (2002): Genetic Analysis of Traits Distinguishing Outcrossing and Self-Pollinating Forms of Currant Tomato, Lycopersicon pimpinellifolium (Jusl.) Mill. Genetic 161 :333-344.
GUO, J., G. SU, J. ZHANG and G. WANG(2008): Genetic analysis and QTL mapping of maize yield and associate agronomic traits under semi-arid land condition. African Journal Of Biotechnology: 12:1829-1838.
GYENIS, L., S.J.YUN, K.P. SMITH, B.J. STEFFENSON, E. BOSSOLINI, M.C. SANGUINETI and G.J. MUEHLBAUER (2007):Genetic architecture of quantitative trait loci associated with morphological and agronomic trait differences in a wild by cultivated cross barley. Genome 50:714-723.
GUPTA, P.K., S. RUSTGI and N. KUMAR (2006): Genetic and molecular basis of grain size and grain number and its relevance to grain productivity in higher plants. Genome 49:565–571.
HUANG, YF, D MADUR, V COMBES, CL KY, D COUBRICHE, P JAMIN, S,JOUANNE F DUMAS, E BOUTY, P BERTIN, A CHARCOSSET, L. MOREAU (2010): The genetic architecture of grain yield and related traits in Zea maize L. revealed by comparing intermated and conventional populations. Genetics. 186(1):395-404.
KRAVI , N., M. VULETI , A. NIKOLI , V. BABI , D. RISTI , V. PERI , V. AN ELKOVI (2012): The effect of osmotic stress on physiological parameters in different maize genotypes. International Conference on BioScience: Biotechnology and Biodiversity-Step in the Future- The Forth Joint UNS-PSU Conference, Novi Sad, Serbia, June 18-20, page 87.
MELCHINGER, A.E., H. UTZ and C.C. SCHON (1998): Quantitative trait locus (QTL) mapping using different testers and independent population samples in maize reveals low power of QTL detection and large bias in estimates of QTL effects. Genetics 149, 383-403.
MARINO R., M.PONNAIAH, P.KRAJEWSKI, C.FROVA, L.GIANFRANCESCHI, M.E.PE, M. SARI-GORLA (2009): Addressing drought tolerancein maizebytranscriptional profilingand mapping. Mol. Genet. Genomics 281(2):163-79.
MESSMER R., Y. FRACHEBOUD, M. BANZIGER, M.VARGAS, P. STAMP, J.M. PALIWAL R.L., G. GRANADOS, H.R. LAFITTE, A.D. VIOLIC, J.P. MARATHEE (2000): Tropical maize: improvement and Production, Food and Agriculture Organization of the Unites Nations, Rome, Italy.
PETERS L.J., F. CNUDDE and T. GERATS (2003):Forward genetics and map-based cloning approaches. Trends Plant Sci.
8(10): 484-491.
QUARRIE S., S. PEKIC QUARRIE, R. RADOSEVIC, D. RANCIC, A. KAMINSKAet al. (2006): Dissecting a wheat QTL for yield present in a range of environments: from the QTL to candidate genes. J. Exp. Bot. 57:2627–2637.
RIBAUT J.M., C. JIANG, D. GONZALEZ DE LEON et al. (1997): Identification of quantitative trait loci under drought conditions in tropical maize. 2. Yield components and marker-assisted selection strategies. Theor. Appl. Genet. 94:887-896.
SANGUINETI M.C., R. TUBEROSA, P. LANDI, S. SALVI, M. MACCAFERRI, E. CASARINI, S. CONTI (1999): QTL analysis of drought-related traits and grain yield in relaton to genetic variation for leaf abscisic acid concentration in field-grown maize. J. Exp. Bot., 337:1289-1297.
SIBOV S.T., C.L. DE SOUZA, A.A. GARCIA, A.R. SILVA., A.F. GARCIA AND C.A.MANGOLIN (2003): Molecular mapping in tropical maize (Zea mays L.) using microsatellite markers. 2. Quantitative trait loci (QTL) for grain yield, plant height, ear height and grain moisture. Hereditas 139:107-115.
STUBER, C.W., S.E. LINCOLN, D.W. WOLFF, T. HELENTIJARIS, E.S. LANDER (1992): Identification of genetic factors contributing to heterosis in a hybrid from two elite maize inbred lines using molecular molecular. Genetics
132:823-839.
IDENTIFIKACIJA LOKUSA ZA KVANTITATIVNA SVOJSTVA KOD KUKURUZA U USLOVIMA SUŠE, II: PRINOS I KOMPONENTE PRINOSA
Ana NIKOLI , Violeta ANDJELKOVI , Dejan DODIG, Snežana MLADENOVI DRINI , Natalija KRAVI , Dragana IGNJATOVI -MICI
Institut za kukuruz „Zemun Polje“, Beograd, Srbija
Izvod
Prinos je najvažnije svojstvo u programima oplemenjivanja kukuruza, a suša je glavni ograni avaju i faktor u postizanju optimalnog prinosa. Zna ajno poboljšanje tolerantnosti na sušu kod kukuruza ostvareno je metodama konvencionalnog oplemenjivanja. Me utim, tradicionalne metode oplemenjivanja imaju brojna ograni enja, pa se zahvaljuju i razvoju novih metoda molekularne genetike može posti i napredak u rasvetljavanju geneti ke osnove tolerantnosti na sušu. U cilju mapiranja QTL-ova za prinos i komponente prinosa kod kukuruza u uslovima suše izvršeno je fenotipsko ocenjivanje 116 F3 familija ukrštanjaDTP79xB73 u polju. Fenotipske korelacije izme u ispitivanih svojstava su izra unate pomo u Pirsonovog koeficijenta i bile su visoke i zna ajne. Za identifikaciju QTL-ova koriš ena je composite interval mapping opcija u programu WinQTL Cartographer v 2.5. Detektovano je ukupno 45 QTL-ova za devet analiziranih svojstava: pet za prinos i 40 za osam komponenti prinosa. QTL-ovi su detektovani na svim hromozomima izuzev na hromozomu 9. Procent fenotipske varijabilnosti identifikovan za sve QTL-ove za sva ispitivana svojstva bio je u opsegu od 27.46 do 95.85%. Razli iti tipovi genskih efekata detektovani su za razli ite QTL-ove za analizirana svojstva.