Deletion of Serum Amyloid A3 Improves High Fat High
Sucrose Diet-Induced Adipose Tissue Inflammation and
Hyperlipidemia in Female Mice
Laura J. den Hartigh1*, Shari Wang1, Leela Goodspeed1, Yilei Ding1, Michelle Averill1, Savitha Subramanian1, Tomasz Wietecha2, Kevin D. O’Brien2, Alan Chait1
1Division of Metabolism, Endocrinology, and Nutrition, Department of Medicine, University of Washington, Seattle, Washington, United States of America,2Division of Cardiology, Department of Medicine, University of Washington, Seattle, Washington, United States of America
Abstract
Serum amyloid A (SAA) increases in response to acute inflammatory stimuli and is modestly and chronically elevated in obesity. SAA3, an inducible form of SAA, is highly expressed in adipose tissue in obese mice where it promotes monocyte chemotaxis, providing a mechanism for the macrophage accumulation that occurs with adipose tissue expansion in obesity. Humans do not express functional SAA3 protein, but instead express SAA1 and SAA2 in hepatic as well as extrahepatic tissues, making it difficult to distinguish between liver and adipose tissue-specific SAA effects. SAA3 does not circulate in plasma, but may exert local effects that impact systemic inflammation. We tested the hypothesis that SAA3 contributes to chronic systemic inflammation and adipose tissue macrophage accumulation in obesity using mice deficient for Saa3 (Saa32/2). Mice were rendered obese by feeding a pro-inflammatory high fat, high sucrose diet with added cholesterol
(HFHSC). Both male and femaleSaa32/2 mice gained less weight on the HFHSC diet compared toSaa3+/+ littermate
controls, with no differences in body composition or resting metabolism. FemaleSaa32/2mice, but not males, had reduced
HFHSC diet-induced adipose tissue inflammation and macrophage content. Both male and female Saa32/2 mice had
reduced liverSaa1andSaa2expression in association with reduced plasma SAA. Additionally, femaleSaa32/2mice, but not
males, showed improved plasma cholesterol, triglycerides, and lipoprotein profiles, with no changes in glucose metabolism. Taken together, these results suggest that the absence ofSaa3attenuates liver-specific SAA (i.e., SAA1/2) secretion into plasma and blunts weight gain induced by an obesogenic diet. Furthermore, adipose tissue-specific inflammation and macrophage accumulation are attenuated in femaleSaa32/2 mice, suggesting a novel sexually dimorphic role for this
protein. These results also suggest thatSaa3influences liver-specific SAA1/2 expression, and that SAA3 could play a larger role in the acute phase response than previously thought.
Citation:den Hartigh LJ, Wang S, Goodspeed L, Ding Y, Averill M, et al. (2014) Deletion of Serum Amyloid A3 Improves High Fat High Sucrose Diet-Induced Adipose Tissue Inflammation and Hyperlipidemia in Female Mice. PLoS ONE 9(9): e108564. doi:10.1371/journal.pone.0108564
Editor:G. William Wong, Johns Hopkins University School of Medicine, United States of America
ReceivedJune 3, 2014;AcceptedAugust 22, 2014;PublishedSeptember 24, 2014
Copyright:ß2014 den Hartigh et al. This is an open-access article distributed under the terms of the Creative Commons Attribution License, which permits unrestricted use, distribution, and reproduction in any medium, provided the original author and source are credited.
Data Availability:The authors confirm that all data underlying the findings are fully available without restriction. All relevant data are within the paper and its Supporting Information files.
Funding:This work was supported by the University of Washington Nutrition Obesity Research Center (NIDDK P30 DK035816) (LJD), Experimental Pathology of Cardiovascular Disease Training Grant (T32 HL007312) (LJD), K01 AT007177-01 (LJD), P01 HL092969 (LJD, SW, LG, YD, MMA, SS, AC), and R01 HL094352 (LJD, SW, LG, YE, MMA, SS, AC). The funders had no role in study design, data collection and analysis, decision to publish, or preparation of the manuscript.
Competing Interests:The authors have declared that no competing interests exist. * Email: [email protected]
Introduction
Chronically elevated SAA associates with obesity and T2DM in humans and in mice [1–4]. Members of the serum amyloid A (SAA) family are acute phase proteins released in response to inflammation [5], and have been implicated in chronic inflam-matory diseases such as rheumatoid arthritis [6,7], atherosclerosis [8,9], and obesity [2,10]. There are four known human subtypes of SAA (SAA1–4), which vary in their alleged function and tissue expression. SAA1 and SAA2 are closely related subtypes primarily expressed by the liver. Circulating levels of SAA1 and SAA2 can rapidly increase up to 1000-fold in response to inflammatory stimuli such as lipopolysaccharide (LPS), silver nitrate, and casein, and are primarily associated with HDL in the blood [11]. Conversely, SAA3 is expressed in most extrahepatic tissues as well as the liver, with the highest expression found in adipocytes, lung,
macrophages, and large intestine [12,13]. SAA3 has not been found in blood using sensitive mass spectrometric techniques [14,15] and therefore presumably performs paracrine/autocrine functions. Furthermore, while SAA3 is highly expressed in some mammals such as mice, it has evolved as a pseudogene in humans [16], where it is thought to be replaced functionally in obese adipose tissue by SAA1 and SAA2. SAA4 is expressed constitu-tively by most cells and responds only moderately to inflammatory stimuli [17].
conserved through evolution [26], suggesting that they play a crucial role in the response to inflammation. While murine SAA1 and SAA2 are 96% homologous, SAA3 is only 63% and 65% homologous to SAA1 and SAA2, respectively [27]. Coupled with its differential tissue expression, this suggests that adipose tissue SAA3 could play an as yet undefined role in chronic inflammatory diseases that differs from hepatic acute phase SAA. Moreover, little is known about the consequences of chronic elevation of adipose tissue SAA3 in inflammatory conditions such as obesity.
A characteristic feature of obesity is the accumulation of macrophages within adipose tissue [28]. We and others have shown thatSaa3can be highly expressed by cultured adipocytes in response to inflammatory stimuli such as saturated fatty acids and
25 mM glucose [29,30]. A primary function of adipocyte SAA3 appears to be chemoattraction of monocytes, similarly to monocyte chemotactic protein-1 (MCP-1, encoded by Ccl2) [31]. Furthermore, we have also previously shown that a high fat, high sucrose diet with and without added cholesterol not only induces obesity and systemic inflammation, but also increases adipose tissueSaa3expression and macrophage content [4,29,32]. Mice deficient in the MCP-1 receptor show diminished macro-phage content within adipose tissue when placed on a high fat diet [33], although some macrophages still remain which suggests that other chemotactic factors for macrophage recruitment, such as SAA3, also might play a role.
Figure 1. Deletion ofSaa3attenuates weight gain on a HFHSC diet.(A) Male and (B) femaleSaa3+/+andSaa32/2mice were fed chow or a high fat, high sucrose+cholesterol (HFHSC) diet for 16 weeks, and weekly body weights recorded. (C–D) Gonadal white adipose tissue (gWAT) and
(E–F) liver weight were recorded at sacrifice and normalized to total body weight. n = 6–15 mice per group. *P,0.05 from chow group;#P,0.05 from Saa3+/+
controls. WT:Saa3+/+;KO:Saa32/2. doi:10.1371/journal.pone.0108564.g001
Because humans do not express SAA3, a murine model specifically deleting SAA3 provides a unique opportunity to tease apart the effects of adipose tissue-specific SAA from hepatic SAA that would otherwise be difficult to do in humans. We hypothesized that the absence of SAA3 would reduce obesity-induced macrophage accumulation in adipose tissue, which could improve systemic inflammation. To test this hypothesis, we generated mice with specific global deletion of Saa3. Saa32/2
mice had restricted weight gain on an obesogenic diet. Female
Saa32/2mice also had reduced adipose tissue inflammation and
macrophage content, and an improved systemic lipid profile. Liver-derived SAA production was also decreased in Saa32/2
mice, suggesting that SAA3 could play a significant role in hepatic inflammation and lipoprotein metabolism.
Materials and Methods
Generation ofSaa32/2 mice
Targeted embryonic stem cells lacking the entire protein coding sequence of Saa3 were derived from C57BL/6N mice by Regeneron Pharmaceuticals through the Knock Out Mouse Project (KOMP) at the University of California, Davis. Specific information on how theseSaa3-null embryonic stems cells were generated can be found at http://www.velocigene.com/komp/ detail/13807. Chimeric offspring were generated by injecting
Saa3-null embryonic stems cells into albino C57BL/6 embryos. Germline transmission was confirmed by breeding male chimeras to albino females, yielding black pups that were heterozygous for the desiredSaa3deletion. Wild type (Saa3+/+
, WT), heterozygous (Saa3+/2, HET), and knock out (Saa32/2, KO) mice used in this
study were obtained by breeding F2 generationSaa3+/2mice to
yield littermates with all three genotypes represented. Mice from all three genotypes appeared normal with no obvious phenotype. A minimum of 6 mice were used in each treatment group. For simplicity, only results from the Saa3+/+
andSaa32/2mice will be
shown.
Mouse study design
Ten-week-old adult male and femaleSaa3+/+
, Saa3+/2, and
Saa32/2mice were fed either normal chow (12% calories from fat)
or a high fat, high-sucrose diet with 0.15% added cholesterol (HFHSC, F4997, Bioserv) ad libitum for 16 weeks. Details of these diets have been published previously [32]. The HFHSC diet provides 20.5% of calories as protein, 36% as fat (40% w/w saturated, 50% monounsaturated, and 10% polyunsaturated fats) and 36% as carbohydrate. The HFHSC diet was used in this study as we have previously shown that it induces significantSaa3gene expression in adipose tissue [32]. Body weights were measured weekly. At sacrifice, harvested tissues were snap-frozen in liquid nitrogen and stored at270uC or were fixed with 10% neutral-buffered formalin and embedded in paraffin wax. All experimental procedures were undertaken with approval from the Institution Animal Care and Use Committee of the University of Washing-ton. Terminal procedures were performed under isoflurane anesthesia, and every effort was made to minimize animal suffering.
Quantitative real-time PCR
Total RNA was extracted from,100 mg of whole adipose or
liver tissues using a commercially available RNA extraction kit according to the manufacturer’s protocol (Qiagen RNeasy Mini Kit). After spectroscopic quantification, 2mg of RNA was reverse-transcribed, and the cDNA thus obtained was analyzed by real-time quantitative PCR by standard protocols using an ABI
7900HT instrument. Primer and probe sets for individual genes were purchased from Applied Biosystems (Assay-on-Demand, Life Technologies, Carlsbad, CA). GAPDH was used as a housekeep-ing gene, levels of which did not change with the various diets or genotypes. Relative amounts of the target gene were calculated using theDDCt formula and expressed as a fold change from the
Saa3+/+chow animals. Body composition
Measurements of body lean and fat mass were determined in live, conscious animals by use of quantitative magnetic resonance spectroscopy (QMR; EchoMRI-700TM; Echo MRI) after 11 weeks on diet by the University of Washington Nutrition Obesity Research Center (NORC) Energy Balance and Glucose Metabolism (EBGM) Core.
Indirect calorimetry and ambulatory activity
Mice were acclimated to calorimetry cages prior to the study and data collection. Energy expenditure measurements were obtained as described previously [34]. Briefly, measurements were collected using a computer-controlled open-circuit indirect calo-rimeter using the Oxymax Laboratory Animal Monitoring System (Columbus Instruments, Columbus, OH) with support from the EBGM Core of the NORC at the University of Washington, as previously described [35]. Oxygen consumption (V2) and carbon
dioxide production (Vc2) were measured for each mouse every
20 minutes for 2-minute intervals, and food and water intake were measured using the feed-scale and volumetric drinking monitoring systems, respectively (Columbus Instruments). V2was converted to
total energy expenditure in kilocalories per hour by Columbus software, which uses the standard Lusk formula [TEE (kcal/h) = (3.815+1.2326RQ) 6V2 (l/h)], where respiratory quotient
(RQ) is the ratio of V2 to Vc2 [36]. Locomotor activity was
evaluated using an Opto-Varimetrix-3 sensor system (Columbus Instruments). Consecutive adjacent infrared beam breaks in the x-axis were scored as an activity count, and a tally was recorded every 20 min. Mice were evaluated over two consecutive 24-h periods, and we report the results for the dark (active) photope-riods.
Plasma analyses
Lipoprotein classes were separated from pooled plasma samples by fast-phase liquid chromatography (FPLC). Triglycerides and cholesterol were measured from fasting plasma and pooled plasma FPLC fractions using colorimetric assays as previously described [3], and plasma insulin was measured using a commercially available kit, as described previously [37]. Plasma SAA was measured by ELISA [3].
Liver lipids and histology
Lipids were extracted using the Folch technique as described previously [38]. Triglycerides and cholesterol were then measured using commercially available kits as described previously [39].
Glucose homeostasis
Blood glucose was measured from each mouse every 4 weeks. Glucose tolerance testing was performed on fasted mice (4 hour fast) after 14 weeks on HFHSC diet. An intraperitoneal glucose dose of 1.5 mg/kg was administered followed by blood glucose measurements at 0, 15, 30, 60 and 120 minutes post injection from a tail nick. Insulin tolerance was determined on 4 hour-fasted mice after 15 weeks on HFHSC by injecting 1 mU/g human insulin intraperitoneally and measuring blood glucose at 0, 30, 60, and 120 minutes post-injection.
Immunohistochemistry and adipocyte sizing
Formalin-fixed, paraffin-embedded adipose tissue was sectioned and stained with a rat monoclonal Mac2 antibody (1:2500 dilution, Cedarlane Laboratories) for relative quantification of adipose tissue macrophages as described previously [32]. Area quantification for Mac2 staining was performed on digital images of immunostained tissue sections using image analysis software (Image Pro Plus software, Media Cybernetics). To estimate mean adipocyte size, sections of gonadal adipose tissue were stained with Movat’s Pentacrhome. One randomized photomicrograph was analyzed at 20X objective (Canon EOS 5D Mark II, Olympus
Figure 2. Plasma triglycerides, cholesterol, and lipoprotein profiles are improved in femaleSaa32/2mice.(A–B) Triglycerides and (C–D) total cholesterol were measured from fasted plasma after 16 weeks on chow or HFHSC diet. (E–F) Lipoprotein profiles were obtained by fast-phase liquid chromatography (FPLC) of pooled fasted plasma samples taken at sacrifice. n = 6–15 mice per group. *P,0.05 from chow group;#P,0.05 from Saa3+/+
controls. WT:Saa3+/+;KO:Saa32/2. doi:10.1371/journal.pone.0108564.g002
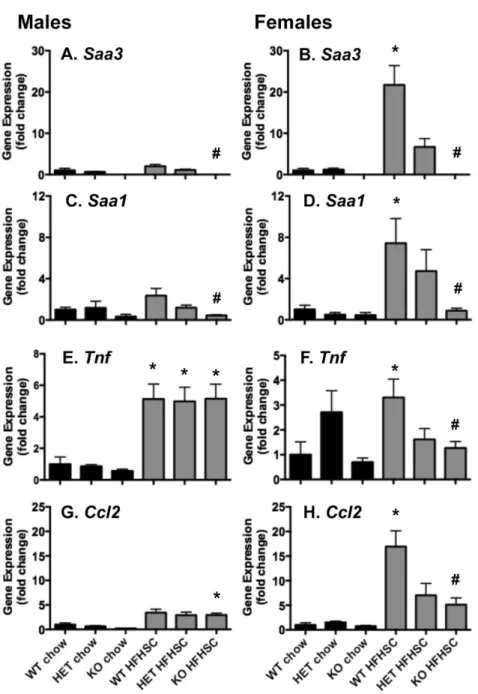
Figure 3. Gonadal white adipose tissue inflammatory and chemotactic gene expression is attenuated in femaleSaa32/2mice.(A–H) Total RNA from whole gonadal white adipose tissue (gWAT) was reverse transcribed into cDNA for quantitative PCR analysis. Genes includingSaa3 (A–B),Saa1(C–D),Tnf(E–F), andCcl2(G–H) are presented, normalized to an internal control gene (Gapdh) and presented as fold change fromSaa3+/+
chow controls. n = 6–15 mice per group. *P,0.05 from chow group;#P,0.05 fromSaa3+/+controls. WT:Saa3+/+;HET:Saa3+/2; KO:Saa32/2. doi:10.1371/journal.pone.0108564.g003
Table 1.Relative expression ofSaasubtypes in gWAT.
gWAT
Males Females
Saa1 Saa3 Saa1 Saa3
Saa3+/+
chow 1 330 1 363
Saa32/2chow 0 1 0 1
Saa3+/+HFHSC 2 660 3 5460
Saa32/2HFHSC 0 1 1 3
BX50) and quantified by manually outlining each individual adipocyte by hand (Image Pro Plus/Media Cybernectics software, Wacom Cintiq 21UX tablet).
Statistics
Data were analyzed using GraphPad Prism 6 software and are represented as means +/2standard errors. One- and two-way
Figure 4. Macrophage content of gonadal white adipose tissue is decreased in femaleSaa32/2 mice.(A–D) Total RNA from whole gonadal white adipose tissue (gWAT) was reverse transcribed into cDNA for quantitative PCR analysis. Genes includingMac2(A–B) andEmr1(C–D) are presented, normalized to an internal control gene (Gapdh) and presented as fold change fromSaa3+/+chow controls. (E–G) gWAT was fixed in
formalin and embedded in formalin before sectioning and staining with a Mac2 antibody. (E) Representative images are shown, 10X magnification. (F–G) Quantification of the percentage of total Mac2-stained area in all tissue sections examined. n = 6–15 mice per group. *P,0.05 from chow group;
#P,0.05 fromSaa3+/+
controls. WT:Saa3+/+;
KO:Saa32/2. doi:10.1371/journal.pone.0108564.g004
ANOVA (ANOVA) were used to compare differences between mice of different genotypes receiving the different diets as indicated, and Bonferroni post-hoc testing was used to detect differences among mean values of the groups. APvalue,0.05 was considered statistically significant.
Results
Absence ofSaa3blunts HFHSC-induced weight gain
Saa3+/+ and Saa32/2 mice did not appear phenotypically
different on a chow diet. However, on a HFHSC diet, both male and female Saa32/2 mice gained significantly less weight than
theirSaa3+/+counterparts, a trend that persisted over the 16-week
dietary intervention (Figure 1A–B). At baseline male and female
Saa3+/+mice weighed an average of 25.3 and 20.9 g, respectively,
and after 16 weeks of HFHSC diet weighed 47.0 and 41.0 g. Conversely, male and female Saa32/2 mice began at 24.5 and
19.1 g, respectively, and after 16 weeks on the HFHSC diet weighed 43.2 and 34.2 g. Compared to Saa3+/+
controls, male and female Saa32/2 mice gained 8.1% and 16.4% less weight,
respectively. Despite significant differences in body weight, there were no differences in body composition relative to body weight betweenSaa3+/+
and Saa32/2 mice after 11 weeks on chow or
HFHSC diet (Figure S1 in File S1). Moreover, gWAT mass, expressed as a total percentage of body weight, did not differ betweenSaa3+/+
and Saa32/2male or female mice at sacrifice
(Figure 1C–D). Liver mass was significantly decreased from 2.9 to 2.0 g inSaa32/2male mice (Figure 1E, presented as a percent of
total body weight), but not in femaleSaa32/2mice (1.3 to 1.1 g,
Figure 1F) compared toSaa3+/+
HFHSC-fed controls. To explore additional mechanisms for the blunted weight gain in Saa32/2
female mice on HFHSC diet, we measured indirect calorimetry and resting activity. Female mice fed a HFHSC diet had higher V2, Vc2, and heat production, with a decrease in respiratory
quotient (RQ) and food intake (Figure S2 in File S1). There were no differences in V2, Vc2, RQ, heat production, or physical
activity between femaleSaa32/2andSaa3+/+
mice (Figure S2 in File S1). Furthermore, gWAT adipocyte size in female mice of different genotypes were not different, but male adipocytes were larger inSaa32/2mice on a HFHSC diet (Figure S3 in File S1). Plasma lipids, but not glucose metabolism, are improved by deletion ofSaa3in obese female mice
Total triglycerides and cholesterol were measured from fasting plasma from all animals after 16 weeks on diet. As shown in Figure 2A–B, fasting triglycerides were not increased by HFHSC diet, but were significantly reduced in female Saa32/2 mice.
Predictably, fasting cholesterol levels increased considerably in all animals fed the HFHSC diet, and were also reduced in female
Saa32/2mice (Figure 2C–D). FPLC from pooled fasting plasma
suggests that this decrease in cholesterol can be attributed to female Saa3+/2 and Saa32/2 mice having less total LDL
(Figure 2F). Notably, there was no improvement in any lipoprotein class in maleSaa32/2mice (Figure 2E).
To determine if the reduced weight gain in the absence ofSaa3
improved glucose metabolism over Saa3+/+
controls, glucose tolerance (GT) and insulin tolerance (IT) tests were performed. While the HFHSC diet worsened glucose and insulin tolerance in both males and females (Figure S4 in File S1), there were no differences between Saa3+/+
and Saa32/2 mice for either sex.
Concurrently, fasting insulin levels were not different between any groups, with no improvements in blood glucose over time.
FemaleSaa32/2mice demonstrate decreased visceral
adipose tissue expression of inflammatory and chemotactic factors
Since we have previously shown that Saa3 expression is increased in visceral and subcutaneous adipose tissue in response to the HFHSC diet in C57BL/6 mice [32], we examined inflammatory and chemotactic gene expression in the same tissues inSaa32/2 mice. As expected, Saa3 expression was absent in
whole gWAT from both male and female Saa32/2 mice, and
significantly reduced in female Saa3+/2 mice (Figure 3A–B).
Although not highly expressed in adipose tissue,Saa1 was also reduced inSaa32/2mice (Figure 3C–D). A direct comparison of
expression levels of Saa1 and Saa3 in gWAT from these mice showed thatSaa3is,300-fold more abundant thanSaa1in both
males and females in Saa3+/+ chow-fed mice (Table 1 and
Figure S5 in File S1). Furthermore, while bothSaa1andSaa3are induced by the HFHSC diet in gWAT from both sexes,Saa3is induced to considerably higher levels than Saa1. Furthermore, Table 1 exemplifies the considerably higher induction ofSaa3by HFHSC diet in female mice than males (15- vs. 2-fold, respectively). Moreover, Saa32/2 mice had no gWAT Saa3
expression, with only a slight decrease in Saa1. This analysis supports the current dogma that visceral fat expresses large amounts ofSaa3, with little contribution bySaa1. Interestingly, while expression levels ofTnfandCcl2were unchanged in male gWAT (Figure 3E, G), femaleSaa32/2 mice showed significant
decreases in Tnf and Ccl2 (Figure 3F, H). Notably, Saa3+/2
female mice fed HFHSC diet also had reduced expression ofTnf
andCcl2(Figure 3F, H), suggesting that the absence of only one allele is necessary to reduce inflammatory gene expression. Similar gene expression profiles were seen in whole inguinal white adipose tissue (iWAT) (Figure S6 in File S1), again highlighting a trend towards improved inflammatory and chemotactic gene expression profiles in femaleSaa32/2mice, but not in male mice.
Visceral adipose tissue macrophage content is attenuated in femaleSaa32/2mice
The macrophage content of white adipose tissue is thought to contribute to the pro-inflammatory state associated with obesity [40]. We and others have shown that SAA3 is chemotactic for macrophages [41]. We therefore examined macrophage accumu-lation within white adipose tissue inSaa32/2mice by quantitative
real-time PCR for the general macrophage markers Mac2 and
Emr1and immunostaining for Mac2. As shown in Figure 4A–D, expression of macrophage markersMac2andEmr1is significantly decreased in whole gWAT from femaleSaa32/2 mice, but not
from maleSaa32/2 mice when compared to Saa3+/+controls.
This is corroborated by decreased Mac2 protein immunostaining in gWAT (Figure 4E–G). Mechanistically, these data are in line with our observation that female Saa32/2 mice have reduced
chemotactic factor expression in gWAT (Figure 3H). In subcuta-neous iWAT, whileSaa1andSaa3gene expression were reduced inSaa32/2mice, there were no significant changes in
inflamma-tory cytokine and macrophage gene expression (Figure S6 and S7, respectively, in File S1).
LiverSaaexpression and circulating SAA levels are decreased inSaa32/2 mice
inflammation and lipid metabolism, gene expression analysis was performed. As shown in Figure 5,Saa1,Saa2, andSaa3are all induced in the liver by HFHSC diet, and are all attenuated in
Saa32/2 mice of both sexes. This translated to decreased SAA
protein in fasting plasma fromSaa32/2mice (Figure 6A–B).
We next determined relative expression levels of the three primary SAA subtypes expressed by the liver, Saa1–3, shown in Figure S4C–D in File S1 and Table 2. Contrary to gWAT expression patterns,Saa subtypes were expressed in the liver of chow-fed Saa3+/+
mice as follows: Saa2. Saa1. Saa3. Moreover, the HFHSC diet further increased expression ofSaa1
and Saa2 to much higher levels than Saa3. Again contrary to expression patterns in gWAT, livers from male mice showed a much higher induction of Saa1 and Saa2 than female mice (Table 2). As expected, liverSaa3was not expressed bySaa32/2
mice, whileSaa1 and Saa2 were only slightly decreased in the
Saa32/2males.
In the liver, there were no changes in expression of macrophage (Mac2,Emr1) or chemotactic factors (Ccl2) between genotypes. In addition, despite improved lipid profiles in femaleSaa32/2mice,
there were no differences in genes involved in triglyceride synthesis (Dgat1), cholesterol synthesis (Srebp1), fatty acid synthesis (Fasn), or fatty acid oxidation (Cpt1alpha) (Figure S8 in File S1). Concurrently, livers fromSaa32/2mice showed no difference in
triglyceride or cholesterol content (Figure S9 in File S1). These results suggest that attenuation of liver SAA by deletion ofSaa3
does not directly impact liver inflammation, lipid synthesis genes, or liver fat content.
Discussion
In this study, we examined the role ofSaa3in a mouse model of chronic low-grade inflammation. The absence of Saa3 had significant effects on adipose tissue, liver, and systemic inflamma-tion with diet-induced obesity. In addiinflamma-tion, we have shown that deletion of Saa3 leads to diminished weight gain in mice on a HFHSC diet that cannot be attributed to changes in fat and lean body mass ratios or basal metabolism. Moreover, the blunted weight gain inSaa32/2mice did not improve the insulin resistant
phenotype generated by the HFHSC diet. However, the absence
ofSaa3did improve systemic lipid and lipoprotein profiles, as well as adipose tissue-specific inflammation and macrophage content in female mice. Finally, the loss ofSaa3also attenuated liver-specific
Saa1 and Saa2 expression and SAA secretion into the blood, suggesting a novel mechanism by which adipose tissue SAA could impact hepatic SAA production.
Human obesity falls into two major classes- ‘‘metabolically more healthy’’ and ‘‘metabolically less healthy’’ [42]. The latter associates more strongly with visceral adiposity, inflammation, dyslipidemia, hypertension, and dysglycemia (i.e., features of the metabolic syndrome [43]), as well as an increased risk of cardiovascular disease [44]. We have found that mice fed a HFHSC diet have many features of the metabolic syndrome in humans [32]. These include local (adipose tissue) and systemic inflammation (as assessed by an increase in the circulating inflammatory marker SAA), dyslipidemia, insulin resistance and mild elevations in fasting glucose levels [32]. Our findings in mice suggest that strategies for reducing adipose tissue inflammation and macrophage accumulation in adipose tissue could have downstream benefits on lipids and systemic inflammation.
The observation that both male and femaleSaa32/2mice had
blunted weight gain on the HFHSC diet, but only females showed improved adipose tissue inflammation and circulating lipid profile, suggests that these changes in adipose tissue and circulating lipids could be due to enhanced weight loss in females, the specific loss of
Saa3, or the female gender itself. As a future direction, weight-matched control animals will help determine if the extra weight lost by females contributed to this phenotype. Wild type female mice showed a more robust HFHSC diet-induced increase inSaa3
expression in gWAT than males (Table 1), possibly due to lower baseline levels of adipose tissue Saa1 and Saa3 expression. Moreover, female mice of all genotypes gained less weight on HFHSC diet than male mice, which could have an impact on local inflammation and systemic lipids. A future direction to address this possibility would be to compare weight-matched male and female
Saa3+/+andSaa32/2mice fed the HFHSC diet. The reason for
the reduced weight gain in both male and femaleSaa32/2mice is
not clear since there were no detectable differences in resting metabolic rate. It is conceivable that our methods were not sufficiently sensitive to pick up small differences in energy
Figure 5. LiverSaa1andSaa2are attenuated inSaa32/2mice.Total RNA from whole liver was reverse transcribed into cDNA for quantitative PCR analysis. Genes includingSaa1(A–B),Saa2(C–D),Saa3(E–F),Mac2(G–H),Emr1(I–J), andCcl2(K–L) are presented, normalized to an internal control gene (Gapdh) and presented as fold change fromSaa3+/+
chow controls. n = 6–15 mice per group. *P,0.05 from chow group;#P,0.05 from Saa3+/+controls. WT:Saa3+/+;KO:Saa32/2.
doi:10.1371/journal.pone.0108564.g005
Figure 6. Plasma SAA is decreased in both male and femaleSaa32/2mice.(A–B) Total SAA was measured from fasted plasma taken at
expenditure or food intake, which could be studied in future, detailed metabolic cage studies.
A major finding in this study was that SAA3 appears to drive adipose tissue inflammation and macrophage accumulation in females, but not males. This sexual dimorphism could be at least partially explained by the significant decrease inCcl2expression in gWAT of femaleSaa32/2mice, whileCcl2levels remain elevated
in maleSaa32/2mice. This provides further evidence that both
Saa3andCcl2are required for monocyte recruitment into adipose tissue, and when one is absent the other can compensate for any loss in chemotaxis. This has been corroborated by Weisberg et al., who showed that mice lacking Ccr2, the receptor forCcl2, also have reduced but not ablated adipose tissue macrophage content [33]. Our previous studies in cultured adipocytes also support this notion, as silencing bothSaa3andCcl2had a synergistic effect on decreasing monocyte chemotaxis [29].
It has previously been shown that SAA indirectly impacts MCP-1 expression in HUVECs [45], HepG2 and H22 cells [46], and human monocytes [47] through p38-dependent mechanisms. p38 has been implicated in promoting inflammatory responses in disease states such as rheumatoid arthritis, inflammatory bowel disease, and diabetes [48–50]. Recently, p38 was shown to have sexually dimorphic functions related to multiple sclerosis [51], wherein pharmacologic inhibition of p38 ameliorated symptoms of multiple sclerosis in female mice, but not male mice. Taken together, it could be possible that the sexual dimorphic nature of p38 could influence SAA-inducedCcl2expression in female mice but not males in our study. In addition, there is some evidence that estrogen confers some protection against high fat diet-induced systemic and adipose tissue inflammation [52,53], which could contribute to reduced Ccl2 expression [54,55]. Lower baseline
Ccl2expression in the gWAT of female chow-fed Saa3+/+
mice compared to their male counterparts supports this notion. It would now be of great interest to determine if the phenotype observed in femaleSaa32/2mice could be enhanced by generating a mouse
lacking bothSaa3andCcl2.
Recent work by Sjo¨holm et al. also supports a sexual dimorphic role of SAA [56]. The authors of this study examined body composition, systemic inflammation, insulin resistance, and adipocyte size in obese diabetic and non-diabetic cohorts of men and women. They showed that plasma SAA correlated more strongly with systemic inflammatory markers such as CRP and IL-6 in women than in men. Moreover, plasma SAA correlated positively with subcutaneous adipocyte size in women only. The authors speculated that there seems to be an unknown sexual dimorphic role for SAA in the context of obesity, which is also supported by our study.
It was previously believed that obesity-induced adipose tissue macrophage accumulation, specifically the polarization of
macro-phages towards an inflammatory phenotype, contributed to insulin resistance [57]. However, recent evidence suggests that immune cell populations such as macrophages have very little impact on glucose homeostasis in obese conditions. Montes et al. recently showed that attenuating T cell-mediated macrophage accumula-tion in obese adipose tissue showed no improvement in insulin resistance [58]. In addition, recent work in which transgenic male mice have been engineered to express human SAA1 in intra-abdominal adipose tissue showed no negative effects on insulin resistance [59]. In the current study, we support this theme by showing that the absence of adipose tissue SAA in femaleSaa32/
2defficient mice does not affect glucose metabolism, despite
decreasing visceral adipose tissue macrophage content.
A major finding in this study was the effect ofSaa3deletion on plasma triglycerides, cholesterol, and lipoprotein profiles in female mice. Total triglyceride and cholesterol levels were comparable between male and female mice, but only femaleSaa32/2 mice
showed improvements in these lipids. In addition, males appeared to have more LDL and less HDL than females (Figure 2E–F). Work recently published by Ahlin et al. in which recombinant human SAA1 was overexpressed in adipose tissue from ApoE2/2
mice showed that despite increases in plasma SAA, there were no changes in lipoprotein profiles, but only male mice were used in that study [60]. Moreover, a recent study by de Beer et al. showed that deletion of SAA1/2 from ApoE2/2 mice does not improve
lipoprotein profiles in either male or female mice [61]. Taken together, these two studies suggest that SAA1, whether expressed from adipose tissue or liver, has little effect on lipoprotein metabolism. Therefore, the improvements in female lipoproteins seen in the absence ofSaa3in our study suggests that liver SAA3 could play an unknown but important role in lipoprotein metabolism. Interestingly, maleSaa32/2 mice showed reduced
liver size. Because there were no measureable differences in liver cholesterol or triglycerides and no apparent differences in liver histology, we speculate that the reduced liver size in maleSaa32/2
mice is consistent with the reduced body weight of these mice. Another potentially significant finding in this study is that deletion of Saa32/2 from both male and female mice led to
decreased adipose tissue and liver Saa expression as well as circulating SAA levels. This was a surprising finding, given that only femaleSaa32/2mice had reduced adipose tissue
inflamma-tion and macrophage content. This would suggest that chronically elevated SAA3 could directly or indirectly impact expression and secretion of SAA. It is also conceivable that the reduced SAA levels, mainly SAA1 and SAA2, could have resulted in the phenotype seen (reduced weight gain in both males and females and reduced adipose tissue inflammation and lipoprotein changes in females), although it is widely believed that weight loss results in
Table 2.Relative expression ofSaasubtypes in liver.
Liver
Males Females
Saa1 Saa2 Saa3 Saa1 Saa2 Saa3
Saa3+/+
chow 3 16 1 2 39 1
Saa32/2chow 1 5 0 0 7 0
Saa3+/+HFHSC 42 232 2 9 123 2
Saa32/2HFHSC 5 57 0 2 27 0
doi:10.1371/journal.pone.0108564.t002
reduced circulating SAA levels and reduced adipose tissue inflammation, rather than the other way around [62–64].
In conclusion, we have shown that the absence ofSaa3confers some protection against HFHSC-induced weight gain, systemic inflammation, hyperlipidemia, and white adipose tissue inflam-mation in female mice. We speculate that the sexual dimorphic effect seen with deletion of Saa3 could hold clues regarding its effect on adipose tissue inflammation and macrophage content, and that both SAA3 and MCP-1 are required for efficient inflammatory cell chemotaxis. Future directions made possible by this study would be to examine globalSaa3deletion in the context of atherosclerosis, given the improved lipid phenotype in females. This could be achieved by generating double Saa32/2/Ldlr2/2
mice. Furthermore, it is now prudent to tease apart the individual contributions of Saa3 from adipocytes and macrophages by generating cell-specific knock out mice.
Supporting Information
File S1 Supplementary figures S1–S9. Contains figures
showing additional data that was not included in the main text.
Figure S1. Deletion of Saa3 does not alter body
composition. Male and female Saa3+/+ (WT) and Saa32/2
(KO) mice were fed either chow or a high fat high sucrose diet with added cholesterol (HFHSC) for 16 weeks. (A–B) Total fat and (C–D) lean mass were estimated using quantitative magnetic resonance spectroscopy after 11 weeks on diet, and expressed as a percentage of total body mass. n = 6–15 mice per group. *P,0.05 from chow group.Figure S2. Deletion ofSaa3does not alter
basal metabolism or food intake in females. Male and
female Saa3+/+
(WT) andSaa32/2 (KO) mice were fed either
chow or a high fat high sucrose diet with added cholesterol (HFHSC) for 16 weeks. (A) V2, (B) Vc2, (C) respiratory quotient
(RQ), (D) heat production, (E) food intake, and (F) activity were calculated using an indirect calorimeter after 11 weeks on diet. n = 6–15 mice per group. *P,0.05 from chow group.Figure S3. Gonadal adipocyte size is not altered by deletion ofSaa3.
Male and femaleSaa3+/+
(WT) andSaa32/2(KO) mice were fed
either chow or a high fat high sucrose diet with added cholesterol (HFHSC) for 16 weeks. Sections of gonadal adipose tissue were stained with Movat’s Pentacrhome, and adipocyte size was estimated using Image Pro Plus/Media Cybernectics software. n = 6–15 mice per group. *P,0.05 from chow group.Figure S4. Glucose homeostasis is not improved by deletion of
Saa3.Male and femaleSaa3+/+(WT) andSaa32/2(KO) mice
were fed either chow or a high fat high sucrose diet with added cholesterol (HFHSC) for 16 weeks. (A–B) Fasting blood glucose was measured every 4 weeks on diet. (C–F) Glucose tolerance tests (GTT) were performed after 14 weeks on diet. Insulin was measured at the 30-minute time point. (G–H) Insulin tolerance tests (ITT) were performed after 15 weeks on diet. n = 6–15 mice per group. *P,0.05 from chow group,#P,0.05 fromSaa3+/+
controls.Figure S5. Relative expression of Saa subtypes in
epididymal white adipose tissue (eWAT) and liver.Male
and femaleSaa3+/+(WT) andSaa32/2(KO) mice were fed either
chow or a high fat high sucrose diet with added cholesterol
(HFHSC) for 16 weeks. (A–B)eWAT and (C–D) liver were harvested at sacrifice, and Saa1 and Saa3 expression was quantified by RT-PCR. Results are presented normalized to
Saa1expression in WT mice for eWAT subtype comparison, and normalized to Saa3 expression in WT mice for liver subtype comparison,+/2SEM. n = 6–15 mice per group. *P,0.05 from chow group, #P,0.05 from Saa3+/+
controls. Figure S6. Inflammatory gene expression profiles in inguinal white adipose tissue (iWAT). Male and female Saa3+/+
(WT) and
Saa32/2 (KO) mice were fed either chow or a high fat high
sucrose diet with added cholesterol (HFHSC) for 16 weeks. iWAT was harvested at sacrifice and (A–B)Saa3, (C–D)Saa1, (E–F)Tnf, and (G–H)Ccl2expression was quantified by RT-PCR. Results are presented normalized to WT chow mice,+/2SEM. n = 6–15 mice per group. *P,0.05 from chow group, #P,0.05 from
Saa3+/+controls.Figure S7. Inflammatory gene expression
profiles in inguinal white adipose tissue (iWAT).Male and femaleSaa3+/+(WT) and Saa32/2 (KO) mice were fed either
chow or a high fat high sucrose diet with added cholesterol (HFHSC) for 16 weeks. iWAT was harvested at sacrifice and (A– B)Mac2and (C–D)Emr1expression was quantified by RT-PCR. Results are presented normalized to WT chow mice,+/2SEM. n = 6–15 mice per group. *P,0.05 from chow group.Figure S8.
Lipid synthesis genes are not altered by deletion ofSaa3
in liver.Male and femaleSaa3+/+
(WT) andSaa32/2(KO) mice
were fed either chow or a high fat high sucrose diet with added cholesterol (HFHSC) for 16 weeks. Liver was harvested at sacrifice and (A–B) Dgat, (C–D) Srebp1, (E–F) Fasn, and (G–H) Cpt1a
expression was quantified by RT-PCR. Results are presented normalized to WT chow mice, +/2 SEM. n = 6–15 mice per group.Figure S9. Liver lipids and histology. (A–D) Lipids were extracted from previously frozen liver samples using the Folch method. Cholesterol (Chol.: A, C) and triglycerides (TG: B, D) were quantified. E. Representative images of Masson’s trichrome-stained liver sections from male and female, WT (Saa3+/+
) and KO (Saa32/2) mice after 16 weeks of chow or
HFHSC diet. Scale bar = 200mm. (PDF)
Acknowledgments
We gratefully acknowledge the Trans-NIH Knock Out Mouse Project (KOMP) for the generation of embryonic stem cells lackingSaa3. We thank Robert Hunter of the University of Washington for assistance in Saa3 chimera generation; Greg Morton, Kayoko Ogimoto, and Karl Kaiyala of the University of Washington for assistance with body composition and calorimetry data and statistical analyses; and Jin Kim, Brittany Sullivan, Bernard Do and Anthony Sta. Teresa III of the University of Washington for immunohistochemical analyses of adipose tissue macrophage quantification and adipocyte sizing.
Author Contributions
Conceived and designed the experiments: LJD AC. Performed the experiments: LJD SW LG YD MMA SS TW. Analyzed the data: LJD TW KDO. Contributed reagents/materials/analysis tools: LJD SW TW KDO AC. Wrote the paper: LJD AC.
References
1. Mu¨ller S, Martin S, Koenig W, Hanifi-Moghaddam P, Rathmann W, et al. (2002) Impaired glucose tolerance is associated with increased serum concentrations of interleukin 6 and co-regulated acute-phase proteins but not TNF-alpha or its receptors. Diabetologia 45: 805–812.
2. Poitou C, Viguerie N, Cancello R, De Matteis R, Cinti S, et al. (2005) Serum amyloid A: production by human white adipocyte and regulation by obesity and nutrition. Diabetologia 48: 519–528.
3. Lewis KE, Kirk EA, McDonald TO, Wang S, Wight TN, et al. (2004) Increase in serum amyloid a evoked by dietary cholesterol is associated with increased atherosclerosis in mice. Circulation 110: 540–545.
5. McAdam KP, Sipe JD (1976) Murine model for human secondary amyloidosis: genetic variability of the acute-phase serum protein SAA response to endotoxins and casein. J Exp Med 144: 1121–1127.
6. Migita K, Eguchi K, Tsukada T, Kawabe Y, Takashima H, et al. (1996) Increased circulating serum amyloid A protein derivatives in rheumatoid arthritis patients with secondary amyloidosis. Lab Invest 75: 371–375. 7. O’Hara R, Murphy EP, Whitehead AS, FitzGerald O, Bresnihan B (2000)
Acute-phase serum amyloid A production by rheumatoid arthritis synovial tissue. Arthritis Res 2: 142–144.
8. Fyfe AI, Rothenberg LS, DeBeer FC, Cantor RM, Rotter JI, et al. (1997) Association between serum amyloid A proteins and coronary artery disease: evidence from two distinct arteriosclerotic processes. Circulation 96: 2914–2919. 9. Johnson BD, Kip KE, Marroquin OC, Ridker PM, Kelsey SF, et al. (2004) Serum amyloid A as a predictor of coronary artery disease and cardiovascular outcome in women: the National Heart, Lung, and Blood Institute-Sponsored Women’s Ischemia Syndrome Evaluation (WISE). Circulation 109: 726–732. 10. van Dielen FM, van’t Veer C, Schols AM, Soeters PB, Buurman WA, et al.
(2001) Increased leptin concentrations correlate with increased concentrations of inflammatory markers in morbidly obese individuals. Int J Obes Relat Metab Disord 25: 1759–1766.
11. Benditt EP, Eriksen N (1977) Amyloid protein SAA is associated with high density lipoprotein from human serum. Proc Natl Acad Sci U S A 74: 4025– 4028.
12. Meek RL, Benditt EP (1986) Amyloid A gene family expression in different mouse tissues. J Exp Med 164: 2006–2017.
13. Benditt EP, Meek RL (1989) Expression of the third member of the serum amyloid A gene family in mouse adipocytes. J Exp Med 169: 1841–1846. 14. Chiba T, Han CY, Vaisar T, Shimokado K, Kargi A, et al. (2009) Serum
amyloid A3 does not contribute to circulating SAA levels. J Lipid Res 50: 1353– 1362.
15. Reigstad CS, Lunde´n GO, Felin J, Ba¨ckhed F (2009) Regulation of serum amyloid A3 (SAA3) in mouse colonic epithelium and adipose tissue by the intestinal microbiota. PLoS One 4: e5842.
16. Kluve-Beckerman B, Drumm ML, Benson MD (1991) Nonexpression of the human serum amyloid A three (SAA3) gene. DNA Cell Biol 10: 651–661. 17. Uhlar CM, Whitehead AS (1999) Serum amyloid A, the major vertebrate
acute-phase reactant. Eur J Biochem 265: 501–523.
18. Badolato R, Johnston JA, Wang JM, McVicar D, Xu LL, et al. (1995) Serum amyloid A induces calcium mobilization and chemotaxis of human monocytes by activating a pertussis toxin-sensitive signaling pathway. J Immunol 155: 4004–4010.
19. Liang TS, Wang JM, Murphy PM, Gao JL (2000) Serum amyloid A is a chemotactic agonist at FPR2, a low-affinity N-formylpeptide receptor on mouse neutrophils. Biochem Biophys Res Commun 270: 331–335.
20. Su SB, Gong W, Gao JL, Shen W, Murphy PM, et al. (1999) A seven-transmembrane, G protein-coupled receptor, FPRL1, mediates the chemotactic activity of serum amyloid A for human phagocytic cells. J Exp Med 189: 395– 402.
21. Lindhorst E, Young D, Bagshaw W, Hyland M, Kisilevsky R (1997) Acute inflammation, acute phase serum amyloid A and cholesterol metabolism in the mouse. Biochim Biophys Acta 1339: 143–154.
22. Kisilevsky R, Subrahmanyan L (1992) Serum amyloid A changes high density lipoprotein’s cellular affinity. A clue to serum amyloid A’s principal function. Lab Invest 66: 778–785.
23. Tsun JG, Shiu SW, Wong Y, Yung S, Chan TM, et al. (2013) Impact of serum amyloid A on cellular cholesterol efflux to serum in type 2 diabetes mellitus. Atherosclerosis 231: 405–410.
24. Artl A, Marsche G, Lestavel S, Sattler W, Malle E (2000) Role of serum amyloid A during metabolism of acute-phase HDL by macrophages. Arterioscler Thromb Vasc Biol 20: 763–772.
25. Banka CL, Yuan T, de Beer MC, Kindy M, Curtiss LK, et al. (1995) Serum amyloid A (SAA): influence on HDL-mediated cellular cholesterol efflux. J Lipid Res 36: 1058–1065.
26. Uhlar CM, Burgess CJ, Sharp PM, Whitehead AS (1994) Evolution of the serum amyloid A (SAA) protein superfamily. Genomics 19: 228–235.
27. Lowell CA, Potter DA, Stearman RS, Morrow JF (1986) Structure of the murine serum amyloid A gene family. Gene conversion. J Biol Chem 261: 8442–8452. 28. Weisberg SP, McCann D, Desai M, Rosenbaum M, Leibel RL, et al. (2003) Obesity is associated with macrophage accumulation in adipose tissue. J Clin Invest 112: 1796–1808.
29. Han C, Subramanian S, Chan C, Omer M, Chiba T, et al. (2007) Adipocyte-derived serum amyloid A3 and hyaluronan play a role in monocyte recruitment and adhesion. Diabetes 56: 2260–2273.
30. Lin Y, Rajala MW, Berger JP, Moller DE, Barzilai N, et al. (2001) Hyperglycemia-induced production of acute phase reactants in adipose tissue. J Biol Chem 276: 42077–42083.
31. Badolato R, Wang JM, Murphy WJ, Lloyd AR, Michiel DF, et al. (1994) Serum amyloid A is a chemoattractant: induction of migration, adhesion, and tissue infiltration of monocytes and polymorphonuclear leukocytes. J Exp Med 180: 203–209.
32. Subramanian S, Han C, Chiba T, McMillen T, Wang S, et al. (2008) Dietary cholesterol worsens adipose tissue macrophage accumulation and atherosclerosis in obese LDL receptor-deficient mice. Arterioscler Thromb Vasc Biol 28: 685– 691.
33. Weisberg SP, Hunter D, Huber R, Lemieux J, Slaymaker S, et al. (2006) CCR2 modulates inflammatory and metabolic effects of high-fat feeding. J Clin Invest 116: 115–124.
34. Matsen ME, Thaler JP, Wisse BE, Guyenet SJ, Meek TH, et al. (2013) In uncontrolled diabetes, thyroid hormone and sympathetic activators induce thermogenesis without increasing glucose uptake in brown adipose tissue. Am J Physiol Endocrinol Metab 304: E734–746.
35. Morton GJ, Kaiyala KJ, Fisher JD, Ogimoto K, Schwartz MW, et al. (2011) Identification of a physiological role for leptin in the regulation of ambulatory activity and wheel running in mice. Am J Physiol Endocrinol Metab 300: E392– 401.
36. McLean J, Tobin G (1987) Animal and Human Calorimetry. Cambridge, UK: Cambridge Univ. Press.
37. Schreyer SA, Vick C, Lystig TC, Mystkowski P, LeBoeuf RC (2002) LDL receptor but not apolipoprotein E deficiency increases diet-induced obesity and diabetes in mice. Am J Physiol Endocrinol Metab 282: E207–214.
38. Folch J, Lees M, Sloane Stanley GH (1957) A simple method for the isolation and purification of total lipides from animal tissues. J Biol Chem 226: 497–509. 39. Subramanian S, Goodspeed L, Wang S, Kim J, Zeng L, et al. (2011) Dietary cholesterol exacerbates hepatic steatosis and inflammation in obese LDL receptor-deficient mice. J Lipid Res 52: 1626–1635.
40. Subramanian V, Ferrante AW (2009) Obesity, inflammation, and macrophages. Nestle Nutr Workshop Ser Pediatr Program 63: 151–159; discussion 159–162, 259–168.
41. Han CY, Subramanian S, Chan CK, Omer M, Chiba T, et al. (2007) Adipocyte-derived serum amyloid A3 and hyaluronan play a role in monocyte recruitment and adhesion. Diabetes 56: 2260–2273.
42. Denis GV, Obin MS (2013) ‘Metabolically healthy obesity’: origins and implications. Mol Aspects Med 34: 59–70.
43. Kramer CK, Zinman B, Retnakaran R (2013) Are metabolically healthy overweight and obesity benign conditions?: A systematic review and meta-analysis. Ann Intern Med 159: 758–769.
44. Alam I, Ng TP, Larbi A (2012) Does inflammation determine whether obesity is metabolically healthy or unhealthy? The aging perspective. Mediators Inflamm 2012: 456456.
45. Lee HY, Kim SD, Shim JW, Kim HJ, Yun J, et al. (2010) A pertussis toxin sensitive G-protein-independent pathway is involved in serum amyloid A-induced formyl peptide receptor 2-mediated CCL2 production. Exp Mol Med 42: 302–309.
46. Li Y, Cai L, Wang H, Wu P, Gu W, et al. (2011) Pleiotropic regulation of macrophage polarization and tumorigenesis by formyl peptide receptor-2. Oncogene 30: 3887–3899.
47. Lee HY, Kim SD, Shim JW, Lee SY, Lee H, et al. (2008) Serum amyloid A induces CCL2 production via formyl peptide receptor-like 1-mediated signaling in human monocytes. J Immunol 181: 4332–4339.
48. Liverton NJ, Butcher JW, Claiborne CF, Claremon DA, Libby BE, et al. (1999) Design and synthesis of potent, selective, and orally bioavailable tetrasubstituted imidazole inhibitors of p38 mitogen-activated protein kinase. J Med Chem 42: 2180–2190.
49. Hollenbach E, Neumann M, Vieth M, Roessner A, Malfertheiner P, et al. (2004) Inhibition of p38 MAP kinase- and RICK/NF-kappaB-signaling suppresses inflammatory bowel disease. FASEB J 18: 1550–1552.
50. Ando H, Kurita S, Takamura T (2004) The specific p38 mitogen-activated protein kinase pathway inhibitor FR167653 keeps insulitis benign in nonobese diabetic mice. Life Sci 74: 1817–1827.
51. Krementsov DN, Noubade R, Dragon JA, Otsu K, Rincon M, et al. (2014) Sex-specific control of central nervous system autoimmunity by p38 mitogen-activated protein kinase signaling in myeloid cells. Ann Neurol 75: 50–66. 52. Pettersson US, Walde´n TB, Carlsson PO, Jansson L, Phillipson M (2012) Female
mice are protected against high-fat diet induced metabolic syndrome and increase the regulatory T cell population in adipose tissue. PLoS One 7: e46057. 53. Davis KE, D Neinast M, Sun K, M Skiles W, D Bills J, et al. (2013) The sexually dimorphic role of adipose and adipocyte estrogen receptors in modulating adipose tissue expansion, inflammation, and fibrosis. Mol Metab 2: 227–242. 54. Register TC, Cann JA, Kaplan JR, Williams JK, Adams MR, et al. (2005)
Effects of soy isoflavones and conjugated equine estrogens on inflammatory markers in atherosclerotic, ovariectomized monkeys. J Clin Endocrinol Metab 90: 1734–1740.
55. Christodoulakos GE, Lambrinoudaki IV, Economou EV, Papadias C, Vitoratos N, et al. (2007) Circulating chemoattractants RANTES, negatively related to endogenous androgens, and MCP-1 are differentially suppressed by hormone therapy and raloxifene. Atherosclerosis 193: 142–150.
56. Sjo¨holm K, Lundgren M, Olsson M, Eriksson JW (2009) Association of serum amyloid A levels with adipocyte size and serum levels of adipokines: differences between men and women. Cytokine 48: 260–266.
57. Shoelson SE, Herrero L, Naaz A (2007) Obesity, inflammation, and insulin resistance. Gastroenterology 132: 2169–2180.
58. Montes VN, Turner MS, Subramanian S, Ding Y, Hayden-Ledbetter M, et al. (2013) T cell activation inhibitors reduce CD8+T cell and pro-inflammatory macrophage accumulation in adipose tissue of obese mice. PLoS One 8: e67709. 59. Ahlin S, Olsson M, Olsson B, Svensson PA, Sjo¨holm K (2013) No Evidence for a Role of Adipose Tissue-Derived Serum Amyloid A in the Development of Insulin Resistance or Obesity-Related Inflammation in hSAA1(+/2) Transgenic Mice. PLoS One 8: e72204.
60. Ahlin S, Olsson M, Wilhelmson AS, Ska˚le´n K, Bore´n J, et al. (2014) Adipose Tissue-Derived Human Serum Amyloid A Does Not Affect Atherosclerotic Lesion Area in hSAA1+/2/ApoE2/2Mice. PLoS One 9: e95468. 61. De Beer MC, Wroblewski JM, Noffsinger VP, Rateri DL, Howatt DA, et al.
(2014) Deficiency of endogenous acute phase serum amyloid A does not affect atherosclerotic lesions in apolipoprotein E-deficient mice. Arterioscler Thromb Vasc Biol 34: 255–261.
62. Ryan AS, Ge S, Blumenthal JB, Serra MC, Prior SJ, et al. (2014) Aerobic exercise and weight loss reduce vascular markers of inflammation and improve insulin sensitivity in obese women. J Am Geriatr Soc 62: 607–614.
63. Poitou C, Coussieu C, Rouault C, Coupaye M, Cancello R, et al. (2006) Serum amyloid A: a marker of adiposity-induced low-grade inflammation but not of metabolic status. Obesity (Silver Spring) 14: 309–318.