OSM-ORIENTED METHOD OF MULTIMODAL ROUTE PLANNING
Xueqiong Li*, Qiuyun Wu, Luo Chen, Wei Xiong, Ning Jing
Dept. of Electronic Science and Engineering, National University of Defence Technology, Changsha 410073, China - [email protected]
KEY WORDS: Multimodal, Route Planning, Model, Shortest Path
ABSTRACT:
With the increasing pervasiveness of basic facilitate of transportation and information, the need of multimodal route planning is becoming more essential in the fields of communication and transportation, urban planning, logistics management, etc. This article mainly described an OSM-oriented method of multimodal route planning. Firstly, it introduced how to extract the information we need from OSM data and build proper network model and storage model; then it analysed the accustomed cost standard adopted by most travellers; finally, we used shortest path algorithm to calculate the best route with multiple traffic means.
* Corresponding author
1. INTRODUCTION 1.1 General Instructions
Multimodal route planning refers to utilize a number of transportation ways synthetically in order to plan the best route to and realize a transportation purpose. “Multimodal” indicates that there are a lot of transportation modes are counted in our route planning, such as railway, waterway, highroad, walking, driving, bus and etc. With the consummating of the transportation and information infrastructure, it is becoming mature to actualize multimodal intelligent navigation service. The need of service with multimodal route planning functions is significantly increasing nowadays. It is essential to provide a route planning function in personal navigation and route guiding service.
Recent years, quantities of researchers from fields of geographic information and intelligent transportation are doing deep investigation on multimodal route planning and they have yielded substantial results. However, these studies mostly planned the route based on precise road network data set, and it has a high price to pay in order to obtain the accurate data they need. It limited the exploitation extension of multimodal route planning in some aspects.
We realized that VGI (Volunteered Geographic Information) is developing really fast as a collection way of geographic data which is quite different from traditional mapping and remote sensing recent years. VGI relies on a large quantity of volunteers who are willing to integrate and share the data through network. It reduced the cost of collecting geographic information significantly and reduces the time of updating and it is becoming a new trend of the way of gathering data. OSM (OpenStreetMap) is one of leading applications of VGI. It uses the collecting means of VGI. Volunteers upload and share the map data of all over the world on the internet through crowdsourcing. As the quantity of volunteers is quite large, the information provided are more abundant, so that OSM data is becoming more particular and accurate than data provided by map providers in some area, and it is better to process a multimodal route planning especially for those who always walk a lot. Therefore, facing the feature of OSM data, aiming at many kinds of traffic modes and cost standard, we came up with an OSM-oriented method of multimodal route planning.
2. OSM DATA 2.1 OSM Project
OSM is the abbreviation of OpenStreetMap. It is an online map cooperative project aiming at creating a world map with free content and everyone can edit it. OSM data is a set of public map database forming by users from all over the world, and now it is becoming one of the most accurate and impeccable vector geographical data set on a global scale.
OSM project gains geographical data through crowdsourcing. This project uses the users’ trajectory data of GPS devices and vector and grid data donated by institutions and companies, proving free data for users. It reduces the cost of obtaining data and map service of users.
2.2 Geographical Format of OSM Data
When publishing, OSM data use a file based on XML format with .osm as postfix. The geographical information of OSM data is described by data structure with topology feature. It has features of node, way and relation. The geographical information we need for routing analysis are mainly vertices and road elements. Vertices have information of longitude and latitude value, and roads are consisting of many vertices (2 to 2000).
To obtain OSM data, we are required to sign in OSM official website (osm.org) and download the map data of target area. The downloaded data are ought to transfer the spatial database. This progress can be done by a specific transferring tool--osm2pgsql.
3. BUILDING MULTIMODAL ROAD NETWORK
MODEL BASED ON OSM DATA
A multimodal route planning problem can be divided into two parts that are building the data modal and calculating the best route. Common route planning problems usually analysed only one road table, as for multimodal route planning, we should consider more complicated. This is because in the situation of ISPRS Annals of the Photogrammetry, Remote Sensing and Spatial Information Sciences, Volume II-4/W2, 2015
International Workshop on Spatiotemporal Computing, 13–15 July 2015, Fairfax, Virginia, USA
This contribution has been peer-reviewed. The double-blind peer-review was conducted on the basis of the full paper.
multimodal route planning problems, all kinds of traffic modes and road grades should be considered, so that we need transfer simple single mode road network into complex multimode road network.
3.1 Description of Multimodal Route Planning Problems A road network model can be described by a directed graph G = (V,E). V is a finite vertex set and E is set consists of even pairs of vertices (in order or out of order). The line which link a pair of vertices is called edge and E is a collection of edges. Each edge weighs (ei,j). In a multimodal route planning
problem, each network is a directed diagraph. As it involves a number of networks, we can see directed graph G as a collection of some sub-directed-graphs G1,G2,…,Gn, and
each sub-directed-graph can be described as Gi = (Vi,Ei).
Therefore, a multimodal route planning problem can be seen as figuring out the minimum of (ei,j) in a directed graph G =
(V,E).
3.2 Compound Road Network Model Supporting Multimodal Route Planning
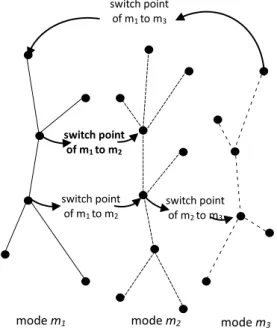
A network model can be described by a graph G = (V,E), while a multimodal network cannot simply use a single graph to describe. Besides the distinct graphs for different modes, link points are also needed to describe multimodal network model. In reality, there are a lot of facilities to link different transportation modes, for example, car parks, subway stations, bus stops, etc. All kinds of facilities allow people to change transportation modes conveniently. In the progress of building a model for multimodal transportation problem, we abstract this kind of facilities as a specific point, which are called “switch points”, so that people can switch to other transportation modes on switch points. By collecting and digitalizing switch points and gathering them to database, we make the database capable of calculating multimodal routing problems.
Therefore, we can use two kinds of data to store this specific composite network model, that is, the data of road network of all the transportation modes and switch points. The composite network model can be described by figure 1 as followed.
Figure 1. Model of multimodal route network
Mode mi represents the ith network model of transportation
mode and different modes mi and mj are linked by switch points.
For example, mi represents for walking mode and mj represents
for bus mode, then the switch points between mi and mj are the
facilities that allow people to take a bus from walk or get off the bus that is the bus stations. In a composite network model, any two models mi and mj can be linked by switch points, that is
to say, any two transportation modes can be transformed directly.
3.3 Storage Design Facing OSM Data
After we get the basic OSM data, we need to transfer the data to the specific format and store it. According to multimodal route planning algorithm, we store the data with five tables; they are tables of vertices, edges, modes, switch points and switch types. With these five tables, we can describe the information of transportation completely and clearly. The basic attributes and relations within these tables are showed as followed in figure 2.
switch_types
PK type_id
type_name
switch_points
PK switch_point_id
from_mode_id to_mode_id from_vertex_id to_vertex_id FK1 type_id
cost is_available FK2 mode_id
vertices
PK vertex_id
FK1 mode_id out_degree x y
edges
PK edge_id
FK1 mode_id from_id to_id cost FK2 vertex_id modes
PK mode_id
mode_name
Figure 2. Storage Mode of Data
3.3.1 Edge Table and Mode Table:
In multimodal route planning, we need to distinct different traffic mode that is to classify the road grades. In OSM data, there is a column named “highway” with attribute motorway, footway, and cycle way and so on. According to these attributes, we classify all the road grades into three categories; they are FOOT_WAY, BICYCLE_WAY and CAR_WAY. Each category includes road grades as follows:
FOOT_WAY = ('footway', 'steps')
BICYCLE_WAY=('primary', 'secondary', 'tertiary', 'unclassified', 'minor', 'cycleway', 'residential', 'track', 'service') CAR_WAY=('motorway', 'trunk', 'primary', 'secondary', 'tertiary', 'unclassified', 'minor', 'residential', 'service')
Besides, “subway” represents for underground line, and “bus” stands for bus line.
Therefore, we store all the categories in the mode table, and give each of them an id to distinct them. Then we build edge table by extracting road data we need from OSM data and giving them corresponding id number.
3.3.2 Vertices Table:
Vertices table contains all the information of vertices. Each mode has their vertices on their own. There should be information of which mode these vertices belong to (mode_id) and the value of longitude and latitude of vertices in the table.
3.3.3 Switch Points Table and Switch Point Type Table Switch points are the important data linking any two modes. We find information about bus station, subway station and switch point
of m1 to m3
mode m1 mode m2 mode m3 switch point
of m1 to m2
switch point of m1 to m2
switch point of m2 to m3
ISPRS Annals of the Photogrammetry, Remote Sensing and Spatial Information Sciences, Volume II-4/W2, 2015 International Workshop on Spatiotemporal Computing, 13–15 July 2015, Fairfax, Virginia, USA
This contribution has been peer-reviewed. The double-blind peer-review was conducted on the basis of the full paper.
other relative facilities in vertices table in OSM data. Each mode is given an id number to distinguish them. All of the information is stored in switch point type table. Then we extract corresponding information of switch points, and store them in the switch points table.
To speak of mentionable is that when reading OSM original data, some improper topology information are exist, such as the self-intersection of roads, isolated points and so on. We need to clear up all the improper data like that to increase data quality in case we cannot find a best route in route planning.
4. ALGORITHM OF MULTIMODAL ROUTE
PLANNING
4.1 The Cost Standard of Multimodal Route Planning In reality, people usually do not use the distance between original point and target point as the standard to estimate whether a route is the best one. For most of the travellers, single travelling standard cannot meet the requirement nowadays gradually. Problems of route planning with multi-standard are becoming a new study trend. Aiming at travellers with different transportation way, we analysed their standard of choosing a best route and found that the standard of distance, time and cost are used quite commonly.
4.1.1 Distance Standard
Using the length between vertices i and j as the weight (ei,j),
finding the best route from the original point i to destiny point j is to figure out how to get the target with the shortest distance. As the speed of traffic modes varies, it is not reasonable to use road length as the only cost standard to measure a route. Therefore, distance standard is often used in a route planning of single traffic mode, such as walking or driving a car.
4.1.2 Time Standard
Using the time between vertices i and j as the weight (ei,j),
finding the best route from the original point i to destiny point j is to figure out how to get the target with the shortest time. Time standard is the most common standard using by navigation system and some online map service with route planning functions nowadays. It can be used in not only single mode route planning, but also is adapted to multimodal route planning problems.
4.1.3 Cost Standard
Using the cost between vertices i and j as the weight (ei,j),
finding the best route from the original point i to destiny point j is to figure out how to get the target with the minimum cost. Cost standard is mainly used on public transportation mode. For example, taxi expense can be calculated according to the distance, bus expense depends on times of taking buses, and the cost of taking subway is figured out by the number of passing stations.
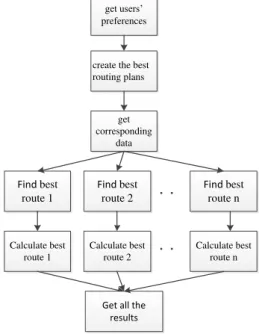
4.2 basic steps of multimodal route planning
After building five basic tables, there are four main steps to make best route based on topological relations:
4.2.1 Get Users’ Preferences
According to different situation users given, we would take different means of route planning. Taking time standard for example, we divide users into two kinds, ones who would like to take a public transportation and others who would like not take a one. In each group, we separate them into users with cars
and users without a car. Details of classification are showed in figure 3 as followed. PT stands for public transportation.
Shortest time
Without PT
With PT
Without car
With car
Without car
With cat
walking
Walking,driving, walking and driving
Walking,PT, Walking and PT
Walking, driving, PT, driving and PT, walking and driving, walking and driving and PT
Figure 3. Optimal Route Planning
4.2.2 Create the Best Routing Plans
Aiming at the users’ preferences, the corresponding best routing plans can be generated. For example, it will generate three kinds of routing plans of walking, driving and both walking and driving when users do not take public transportation and own a private car. Each routing plan need to be calculated further.
4.2.3 Get Corresponding Data
In order to reduce the time spending on calculate the route, we extract corresponding network data from database according to the best routing plan we have from last step. Take three plans above as example, the whole plans have two modes that is walking and driving. Firstly, we find the corresponding mode_id in the modes table, and get all the roads and vertices data from edges table and vertices table which have the same mode_id as we found in modes table. Meanwhile, we find the corresponding ID number from switch type table and extract the related switch points’ data.
4.2.4 Calculate the Best Route
Finally, we can calculate the best route using shortest path algorithm (such as Dijkstra, A star, Floyd and so on) based on every single routing plan. Also, we can use parallel algorithm to calculate the result synchronously to enhance the efficiency of the algorithm.
The specific flow of the whole algorithm is showed below:
get users’ preferences
create the best routing plans
get corresponding
data
Find best route 2
Find best route 1
Find best route n
Calculate best route 1
Calculate best route 2
Calculate best route n
Get all the results
Figure 4. Algorithm Flow Chart of Multimodal Route Planning ISPRS Annals of the Photogrammetry, Remote Sensing and Spatial Information Sciences, Volume II-4/W2, 2015
International Workshop on Spatiotemporal Computing, 13–15 July 2015, Fairfax, Virginia, USA
This contribution has been peer-reviewed. The double-blind peer-review was conducted on the basis of the full paper.
After we get the result of the best route, we can show it on the screen. By dint of high-performance geographical information system platform, we can draw the route result on the map. There is an example as followed.
The blue line stands for driving a car and the red one represents walking line.
Figure 5. Result of Multimodal Route Planning
5. CONCLUSION
This article introduced how to extract road information from OSM data facing its specific data feature, and by means of building multimodal road network modal, bring forward multimodal route planning based on OSM data considering different cost standard of kinds of transportation modes. During the process of researching, we realize that the problems talking below will be the important aspects in studying multimodal route planning.
5.1 OSM Data Quality
As OSM data has the ability of crowdsourcing, it brings the problem of data quality. In the experiments, we only dealt with some significant data quality problems (such as roads’ intersection and isolated points), but other problems are still existed that could result in unpredictable route. Therefore, in the next step, we could focus on research of exploring how to deal with OSM data further and how to give the uploaded data a criterion.
5.2 Dynamic Multimodal Route Planning
The road condition is changeful all the time. For example, traffic control often takes place during vacations and traffic jam would always happen during rush hours every day. These situations would definitely affect the selection of choosing the best route. Therefore, we can consider about time in our algorithm, and to plan the route dynamically.
REFERENCES
Moons, T., 1997. Report on the Joint ISPRS Commission
III/IV Workshop “3D Reconstruction and Modelling of
Topographic Objects”, Stuttgart, Germany
http://www.radig.informatik.tu-muenchen.de/ISPRS/WG-III4-IV2-Report.html (28 Sep. 1999).
Smith, J., 1987a. Close range photogrammetry for analyzing distressed trees. Photogrammetria, 42(1), pp. 47-56.
Smith, J., 1987b. Economic printing of color orthophotos. Report KRL-01234, Kennedy Research Laboratories, Arlington, VA, USA.
Smith, J., 1989. Space Data from Earth Sciences. Elsevier, Amsterdam, pp. 321-332.
Smith, J., 2000. Remote sensing to predict volcano outbursts. In: The International Archives of the Photogrammetry, Remote Sensing and Spatial Information Sciences, Kyoto, Japan, Vol. XXVII, Part B1, pp. 456-469.
ISPRS Annals of the Photogrammetry, Remote Sensing and Spatial Information Sciences, Volume II-4/W2, 2015 International Workshop on Spatiotemporal Computing, 13–15 July 2015, Fairfax, Virginia, USA
This contribution has been peer-reviewed. The double-blind peer-review was conducted on the basis of the full paper.