Vehicular traic as a method to
evaluate air pollution in large
cities
Tráfego veicular como método de
avaliação da exposição à poluição
atmosférica nas grandes metrópoles
Mateus Habermann
IAndrea Paula Peneluppi Medeiros
IINelson Gouveia
II Departamento de Medicina Preventiva da Faculdade de Medicina da
Universidade de São Paulo
IIDepartamento de Medicina da Universidade de Taubaté
Correspondence: Mateus Habermann. Departamento de Medicina Preventiva, Faculdade de Me-dicina – Universidade de São Paulo. Av. Dr. Arnaldo, 455, 2º andar, Cerqueira César, 01246-903 São Paulo, SP, Brasil. E-mail: mathab@usp.br
Abstract
Air pollution is a major concern for pu-blic health. Among the studies conducted to evaluate the association between air pollution and a wide variety of outcomes, some have used motor vehicle trafic data as a method for exposure assessment. This paper intends to revise and discuss some of the methodological aspects of studies that used this method, especially in areas where vehicles are the main generating source of pollutants. We performed a lite-rature search with keywords related to air pollution and vehicle trafic, and selected articles published between the years 2000 to 2009. We noted different approaches for assessing the exposure among the studies using vehicle trafic, with emphasis on the method named Distance Weighted Trafic Density, which considers the number of roads, the distance from the location of inte-rest and trafic itself. Moreover, we highlight the importance of using techniques such as geographic information systems (GIS) to measure this exposure.
Resumo
A poluição atmosférica é uma das maiores preocupações para a saúde pública. Entre os estudos conduzidos para testar a associação entre poluição do ar e os mais diversos des-fechos em saúde, alguns utilizaram dados viários e de tráfego veicular como avaliação da exposição. O presente trabalho pretende revisar e discutir alguns dos aspectos meto-dológicos dos estudos que utilizaram este método, principalmente em áreas onde a fonte veicular é uma grande geradora de poluentes. Realizou-se uma busca biblio-gráica com palavras-chave relacionadas à poluição atmosférica e tráfego veicular, e foram selecionados artigos publicados entre os anos de 2000 e 2009. Foram constatadas várias abordagens para avaliar a exposição, enfatizando-se o método da Densidade de Tráfego Ponderada pela Distância, que considera as vias e a distância das mesmas em relação ao local de interesse e o tráfego. Além disso, destaca-se a importância do uso de técnicas de sistemas de informação geográfica (SIG) como instrumento na construção de modelos para mensurar a exposição.
Palavras-chave: Poluição atmosférica. Tráfego veicular, Emissões de veículos. Ex-posição ambiental. Sistema de informação geográica.
Introduction
Several epidemiological studies have found an association between exposure to atmospheric pollutants and adverse health effects, such as the increase in the number of hospitalizations and mortality, and decrease in life expectancy1. These studies are usually performed in urban areas, where automo-tive vehicles are the main source of air pol-lution. According to a study that examined seven Brazilian cities, approximately 5% of the total number of deaths from respiratory causes between elderly individuals (aged
≥65 years) and children (aged ≤05 years) that occur every year can be attributed to atmo-spheric pollution, with a signiicant amount coming from automotive engine exhaust2.
In the last decades, a reduction in the emission of pollutants emitted by vehicles has been observed3. However, mobile sources are one of the main producers of atmospheric pollutants in urban areas. In Brazil, the three greatest metropolitan areas – São Paulo, Rio de Janeiro and Belo Hori-zonte – comprise 45% of the total number of vehicles in this country1.
The increase in the number of vehicles also causes trafic to low more slowly, lead-ing to longer times spent in congestions1 and, consequently, increasing fossil fuel burning and pollution.
Certain studies evaluate atmospheric pollution using a direct measure, such as data on the mean concentration of pollut-ants measured by air quality monitoring stations. However, the distribution of these stations in urban areas evaluates local pol-lutant concentration and they may not be suficiently dense to detect the spatial het-erogeneity of pollutants dispersed by mobile sources4, which could result in exposure classiication errors among individuals.
monitor-ing stations. Interest in the use of an indirect measure in certain studies is explained by the fact that this enables exposure of a spe-ciic location to be estimated.
The availability of data on vehicle low is a factor that promotes the performance of research that evaluates the association between this exposure and several health outcomes. Geographic information systems (GIS) are an important instrument applied in such studies, serving to map and outline environmental problems, polluted areas, and pollutant dispersion, among other things.
In view of the importance of this theme for public health, the present study aimed to review epidemiological studies that used vehicular traffic as an indirect measure of evaluation of exposure to atmospheric pollution.
Methodology
A literature search on atmospheric pol-lution and vehicular trafic was conducted on the PubMed database, using the terms
“air pollution”, “health, trafic”,” road trafic”, “vehicular trafic” or “trafic density”, with the following search parameters:
(“air pollution”[MeSH Terms] OR “air pollution”[All Fields]) AND “health”[All Fields] AND (“traffic”[Title/Abstract] OR “road traffic”[Title/Abstract] OR “vehic-ular traffic”[Title/Abstract] OR “Traffic density”[title/abstract])
The search for articles was limited to those published between 2000 and 2009 and these were subsequently separated, according to the types of methods to evalu-ate exposure that were used. The following articles were not considered: those that reported experiments in laboratory, those that evaluated exposure to atmospheric pollution without any association with health data, or those that only took into consideration the pollution of indoor en-vironments (indoor pollution). There was a previous selection by title, subsequently by abstract reading, and, whenever neces-sary, by complete article reading. Certain
studies on this theme were included, based on the bibliographical references of articles obtained in the previous search.
This review is part of a study approved by the Comissão de Ética para Análise de Pro-jetos de Pesquisa (Research Project Analysis Ethics Committee – CAPPesq) of the Dire-toria Clínica do Hospital das Clínicas da Faculdade de Medicina da Universidade de São Paulo (Clinical Management of the São Paulo University School of Medicine Clinical Hospital), under number 0662/09.
Results
Of all 513 articles identiied from the search parameter, 35 were eligible for re-view.
It could be observed that different in-dicators of vehicular trafic were used to characterize atmospheric pollution. Some studies, for example, analyzed the distances of certain locations as indicator, such as that from one’s residence or school to the streets, or the density of vehicles or length and density of streets in census tracts or buf-fers, while others used the low of vehicles on streets of interest, or used a combination of several indicators.
The outcomes evaluated in these studies varied between heart diseases5-9, respiratory diseases5,10-23, gestational outcomes24-28, al-lergies and changes in the immunological system29-31, thrombosis32, cancer and leuke-mia33-37, lead contamination38 and mortality in general39.
Studies on the exposure to vehicular traffic using distance as the only indicator
experienced by individuals. Certain studies only considered the nearest road7-9,11,12,25,32; others used the main road (arterial roads, collector streets) considered to have high traffic intensity6,18,20,26,28; yet others were based on the distance of both types of road – road or main road5,14,17,19,31,39.
Certain authors used the shortest dis-tance from the point of interest to a road to evaluate the exposure of individuals in their studies6,9,25,26,32. Other authors consid-ered individuals whose distance was lower than a certain value to be exposed, a value that ranged from 50 m5,12,39, 100 m5,18,20,31,39, 150 m18,19,23,31, 200 m7,20,28,31, 300 m17,19 up to 400 m11.
Some studies evaluated certain distanc-es according to road classiication: Hoek et al.5 and Finkelstein et al.39 considered individuals living as far as 100 m from a road or as far as 50 m from a main road (arterial or collector) to be exposed, whereas other authors adopted several values for distance, such as in the study conducted by Roselund et al.20, which was based on 100 m and 200 m, and by Williams et al.31, based on 100 m, 150 m and 200 m.
Kim et al.19 adopted, in their analyses, 150 and 300 m of distances of roads and, additionally, distinguished individuals into those who lived leeward and windward of roads, thus being able to analyze the inlu-ence of the predominant wind direction in their analyses.
Studies on the exposure to vehicular traffic using its intensity as the only indicator
Many studies used exposure to vehicular trafic intensity as their method to evaluate exposure, understood as the number of ve-hicles passing through a certain road, during a speciic period of time. The majority con-sidered the annual mean of daily trafic and only Wyler et al.30 and Furman and Laleli38 used car/hour counts to estimate exposure.
According to the objective proposed in each study, the following were considered: the trafic of the nearest main road29,30,35,38,
the trafic of the nearest road10,11 or the traf-ic of roads (main ones or not) included in distances (buffers) of up to 50 m25, 100 m8,9,25, 150 m/500 feet16,19,21,37 and 300 m9,19. The majority were based on vehicular trafic in relation to the homes of individuals. One study considered the place of work38 and another one, schools11.
The values of vehicle low were obtained by general count, not specifying the type of vehicle, except for the studies by Janssen et al.11 and Wyler et al.30, which distinguished the low of cars from that of trucks. A total of three studies applied questionnaires and obtained the self-reported trafic intensity on the street of residence15,20,22.
In another methodological approach, the measure of traffic was obtained by multiplying the length of roads close to the homes of the population studied by the daily mean of vehicle low on such roads16,21,35,37.
Studies on vehicular traffic exposure using only density of roads/vehicles as indicator
There were two studies, obtained in the review, that were not limited exclusively to data on the distance of roads or vehicular trafic to evaluate exposure, but they also calculated the density of roads and vehicles in the polygon that surrounded the home.
Based on the individual’s geocoded ad-dress and census data, Reynolds et al.36 cal-culated the density of vehicles, obtained by dividing the total number of vehicles of the census tract by its area (in square miles). The density of vehicles referred to the number of vehicle owners in a census tract, rather than its circulation on the roads of this area. The density of vehicles provides an es-timate of the potential of exposure to emis-sions from fuel evaporation when vehicles are parked at night, once such evaporation is an important source of organic volatile gases, such as benzene36.
of an additional frontier of 200 m around each census tract. According to authors, the increase in the frontier of census tracts pre-vented a discrepancy in the size of the area and roads of such sectors in the calculation of this measure.
In another study conducted by Reynolds et al.37, the length of the streets in a buffer of 150 m/500 feet around an individual’ geocoded address was added and this value was subsequently divided by the buffer area.
Utilization of more than one indirect measure of exposure to vehicular traffic in the same study
Many studies used the combination of several indicators of exposure to vehicular trafic to indirectly estimate atmospheric pollution. One methodology which was repeatedly observed is based on the com-bination of data on the flow of vehicles and the distance of roads around the point of interest (representing the dispersion of pollutants resulting from vehicles, from the street center). This model is known as Dis-tance Weighted Trafic Density – DWTD 13,17-19,24-27,33-35. In this model, it is assumed that
the dispersion of vehicle emissions on the roads is closer to a Gaussian (normal) dis-tribution and that 96% of pollutants emitted by vehicular trafic were dispersed as far as 500 feet/150 m of the center of the road33, as observed in Figure 1. The higher the low on the road, the greater the emission of vehicle pollutants, increasing the concentrations of such pollutants in the urban space, es-pecially in the homes close to busier roads.
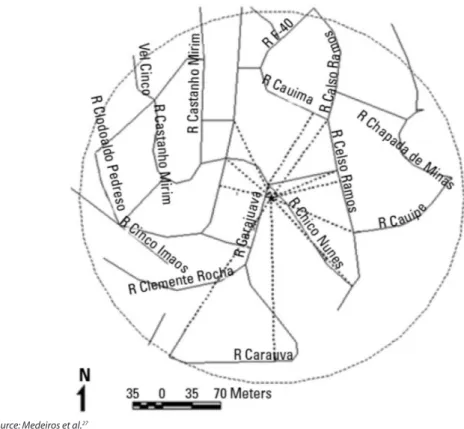
For each individual studied, the DWTD is calculated according to a varying distance around their home or another geocoded place of interest (Figure 2), where W is the buffer width and D is the shortest distance from one’s home to each road within the buffer. Y is the value used to weigh the vehicle low obtained for each road within this area.
Then, the vehicle flow of such street is divided by the Y value, generating an X
value. Next, the weighted values of trafic (X) of all roads included in the buffer (n) are added, thus obtaining the DWTD.
Adapted from Pearson et al.23
As the density and characteristics of constructions, predominant wind direction, altitude, and turbulence caused the low of vehicles to affect the dispersion of pol-lutants generated by trafic, various buffer widths could be assumed to calculate the DWTD. This reduces lack of accuracy in the measure of exposure.
Studies used buffers with a radius vary-ing from 300 m13,17,18, 750 feet (228.4 m)33,34, 165 m35, to 500 feet /150 m19,24-26,33.
Discussion
As observed in the literature search, the road network and its respective vehicle low is an important indicator of atmospheric pollution, once mobile sources are the main producers of emissions of such pollutants in urban areas.
However, when the distance of roads or the volume of trafic represent only the road that is closest to one’s home, the evaluation of exposure may have limitations, because a more distant road with heavy trafic could be important for the analysis. Thus, the weight-ing of vehicle low by the distance enables a more reliable evaluation, as it considers the set of roads that surround one’s home.
Only some studies were based on a single method of evaluation of exposure, the majority of authors sought to use several or to combine them. Despite this variety and combinations, few studies considered more detailed traffic information, such as the mean speed of vehicles38, the type of vehicle (cars or trucks) and what could characterize the fuel used40, and none considered the year the vehicle was manufactured. It was observed that only two reviewed studies included the discrimination between truck trafic and that of the remaining vehicles during data analysis11,30. All types of
auto-Source: Medeiros et al.27
motive vehicles produce pollutants that affect the quality of air; however, the type of fuel used by these vehicles determines a higher or lower concentration of different pollutants, which, in different ways, lead to adverse effects on health.
The majority of articles shown did not include the residential mobility variable in the analyses, nor the time spent by individu-als in their residence, place of work or when going from their residence to work. Time/ residential mobility and daily exposure situ-ations are important variables, because they use the measure of exposure at the moment when the study is conducted, and people often move or spend most of the day in a place other than their residence, thus caus-ing errors in the classiication of exposure. Residential mobility was analyzed by Hooven et al.26, in Rotterdam, Holland, in the period comprised by the seven months pre-ceding the date of birth and the 5th month of pregnancy. Of all the 7,339 pregnant women participating in this study, only 1,118 (15.2%) had not moved during this period. One limitation pointed out by Reynolds et al.37, in a study conducted in California, USA, was that the maternal residential address in the birth certiicate was different from that recorded in the cancer database in 50% of cases (in a period of up to ive years between birth and the diagnosis).
On the other hand, Miyake et al.28 found a low residential mobility in Neyagawa, Japan. A total of two interviews were con-ducted with the pregnant women, one in the prenatal period and the other between the 2nd and 9th months after birth. Of all women, 90.2% reported the same address in the interval of time between the irst and second interviews.
Shima et al.12 gathered information about the time of residence of the popula-tion studied in Shiba, Japan, only including individuals who had been living in such location for at least three years. Of all the 3,184 individuals who responded the irst questionnaire, 655 (20.6%) were excluded because they had not lived there during the established time.
In the Netherlands Cohort Study (NLCS), Hoek et al.5 also found a great percentage (89.8%) of participants living
≥10 years at the same address, with a mean time of residence of 35 years.
Another limitation in several reviewed articles is the temporal resolution of trafic data. Pearson et al.33 reported that the fact that vehicle counts are conducted every ten years and only for one speciic area of Denver, USA, was one of the limitations in the analysis of vehicular trafic. Thus, the es-timates could not correspond to the period before the diagnosis of cancer for each child, and these may have moved from their home during the period of study. Authors stated that this last fact could be conirmed in a previous study, which indicated that many children had in fact moved. Langholz et al.34 also observed a similar dificulty. The trafic count that was closest to the period of selec-tion of individuals (cases) occurred between 1990 and 1994, and the most etiologically relevant period for the study was before the date of diagnosis (exposure of children between 1978 and 1984, before the diagnosis of leukemia), i.e. data referred to a time of approximately 10 to 20 years after such date. Wilhelm and Ritz24 and Hooven et al.26 reported in their studies that they used the mean annual values of vehicle count of 24 hours, although the daily and monthly val-ues and seasonal luctuations were ignored. One advantage of the study performed in France by Zmirou et al.13, when compared to the others, was due to the inclusion of seasonal trafic variations, enabling better detailing of the level of exposure to atmo-spheric pollution in different periods of the year.
When road classiication (roads, arterial and collection roads) is the only factor taken into consideration to evaluate exposure, it is not possible to identify, for example, pos-sible variations in the same classiication, once estimated trafic values are standard-ized within ranges of values.
However, local roads were not so frequently included, and when such roads were ana-lyzed, the values of their vehicle lows were not observed in a more detailed way, with the adoption of a single value. In these cases, the variations that such roads could have in the area where they were included were not distinguished, as observed in two studies that attributed a low of 100 vehicles/day for local roads33,34.
Information about the proportion of local roads, when compared to others, is important, because it enables the identi-ication of the actual need for such roads to be analyzed or not, especially when it comes to a residential area. Only one study considered all types of roads, including the trafic of local roads27. Differently from other authors, who did not analyze local roads or attributed a single value to them all, Medeiros et al.27 estimated vehicle low on each of them by the total low of each polygon (used by the local trafic company), proportionately to each road, according to their length in the area.
The difference in concentration of pol-lutants inside and outside of a home could be questioned as a limiting factor of studies that estimate the exposure of the popula-tion, based on an indicator of vehicular trafic. However, Hoek et al.5 reported that a relevant part of the exposure to pollutants coming from an external environment prob-ably occur inside the homes. Cançado et al.41 observed that personal PM
10 monitors, placed inside and outside homes, detected the presence of such pollutant, showing that approximately 50% of particulate ma-terial in the homes come from the external environment and that the remaining 50% originate from tobacco combustion, gas stove or an unknown source. Another aspect that could be questioned is whether the type of road or even its vehicle low is an adequate indicator of the level of pollution in the area. In this sense, certain studies aimed to validate an indirect trafic measure with a speciic pollutant, identiied by the direct measure of its concentration. These studies are important, because authors
conirm and emphasize the fact that a mo-bile source plays a key role in affecting the quality of air and that this could serve as a point of reference to estimate the exposure of a population to atmospheric pollutants. Kramer et al. 29 used data on the concen-tration of NO2 and the density of trafic in three areas of a city of Germany and showed that the exposure to trafic was an important proxy for NO2 concentration (annual mean estimate).
The relationship between PM2,5, elemen-tal carbon and truck trafic in the Bronx, New York, USA, was analyzed by Lena et al.40. The results pointed out that the concentra-tion of elemental carbon varied according to truck trafic (an increase of 1.69 μg/m³ in elemental carbon for each 100 trucks/hour).
Reynolds et al.36 compared the values of density of vehicles, roads and trafic to data on the concentration of several pollut-ants (CO, NO2, PM10, benzene and 1,3-bu-tadiene). The density of trafic showed a statistically signiicant positive correlation with CO (r=0.70), benzene (r=0.69), 1,3 butadiene (r=0.57) and, to a lesser degree, NO2 (r=0.30). The density of roads showed a statistically signiicant positive correlation with CO (r=0.62) and, to a lesser degree, NO2 (r=0.32) and PM10 (r=0.31).
Zhu et al.4 measured particulate material and black carbon at distances of between 30 and 300 m from the sides of a highway in Los Angeles, USA. One of the sides of this highway was windward, the other, leeward. Measurements showed that the closer to the leeward side of a highway, the higher the concentration of ultraine particles. Only when the distance was longer than 300 m, did this concentration become equal on both sides of the highway, indicating the influence of such particles within such distance.
The relationship between the intensity of trafic close to homes and concentrations outside of such homes was signiicant and explained between 5% and 50% of the varia-tion in pollutants. The time spent in trafic and external environments significantly increased the exposure to soot and PM2,5.
Meteorological factors, such as wind direction and speed, were dealt with in only one study, which considered the predomi-nant wind direction19. The models devel-oped usually assume an isotropic dispersion of pollutants in space. Wind direction could be less important for streets (arterial and collection) than highways, once homes are usually surrounded by the former, whereas the latter are often found along one side of these homes. As a result, it could be sug-gested that the lack of information about wind direction does not signiicantly inlu-ence the results of studies that were based on data on arterial, collection and, in some cases, local roads.
Finally, another trend which is begin-ning to appear more frequently in the litera-ture on atmospheric pollution is the method known as Land Use Regression (LUR), used to evaluate exposure. This method predicts concentrations of pollution in a certain lo-cation, combining data on the road network or vehicular trafic with other factors that could inluence exposure, such as land use, topography and population characteris-tics43. However, the creation of models based on regression involves complex statistical tests and the availability of all data neces-sary to create such models could prevent its implementation.
Final Considerations
As the economic development and urbanization process grow in developing countries, a fast increase in the number of vehicles is observed. These vehicles are frequently in poor conditions, running on low quality fuels, and including precarious engines and gas ilter mechanisms, thus causing an increase in the levels of concen-tration of atmospheric pollution.
This article reviewed studies that used data on the road network and/or vehicular trafic as an indirect measure to evaluate atmospheric pollution in urban areas. These measures have been used more frequently in the international literature and applied to the investigation of several outcomes, thus having an important role in the con-text of environmental epidemiology. In addition, there is the unquestionable fact that procedures inherent to the analyses of such evaluations of exposure are facilitated and enriched by the use of the GIS to store, process and geocode data.
In summary, indicators of exposure based on vehicular trafic have been ap-plied in several studies, because they are relatively easy to interpret and they describe how exposed to vehicle emissions residents are, especially those living near busy roads. As observed, studies have shown that the concentrations of pollutants close to roads are well correlated to trafic, so that these indicators can be used as an indicator of exposure of the population to urban atmo-spheric pollutants.
Referências
1. Pan American Health Organization. An assessment of
health effects of ambient air pollution in Latin America and the Caribbean. Washington D.C: PAHO; 2005.
2. Marcilio I, Gouveia N. Quantifying the impact of air
pollution on the urban population of Brazil. Cad Saúde
Pública 2007; 23(S4): S529-36.
3. Companhia de Tecnologia e Saneamento Ambiental.
Relatório de qualidade do ar no estado de São Paulo. São Paulo: CETESB, 2007. Disponível em http://www.cetesb. sp.gov.br/Ar/ publicacoes.asp. [Acessado em 2 de março de 2009]
5. Hoek G, Brunekreef B, Goldbohm S, Fischer P, Van Den Brandt PA. Association between mortality and indicators of trafic-related air pollution in the Netherlands: a
cohort study. The Lancet 2002; 360(9341): 1203-09.
6. Maheswaran R, Elliott P. Stroke Mortality Associated With Living Near Main Roads in England and Wales: a
geographical study. Stroke 2003; 34: 2776-80.
7. Hoffmann B, Moebus S, Stang A, Beck EM, Dragano N, Mohlenkamp S et al. Residence close to high trafic and
prevalence of coronary heart disease. European Heart
Journal 2006; 27, 2696-702.
8. Tonne C, Melly S, Mittleman M, Coull B, Goldberg R, Schwartz J. A Case–Control Analysis of Exposure to
Trafic and Acute Myocardial Infarction. Environ Health
Perspect 2007; 115: 53–57.
9. Medina-Ramón M, Goldberg R, Melly S, Mittleman MA, Schwartz J. Residential Exposure to Trafic-Related
Air Pollution and Survival after Heart Failure. Environ
Health Perspect 2008; 116(4): 481-85.
10. Garshick E, Laden F, Hart JE, Caron A. Residence near a major road and respiratory symptoms in U.S. veterans.
Epidemiology 2003; 14(6): 728-36.
11. Janssen NAH, Brunekreef B, Van Vliet P, Aarts F, Meliefste K, Harssema H, Fischer P. The relationship between air pollution from heavy trafic and allergic sensitization, bronchial hyper responsiveness, and respiratory
symtoms in dutch schoolchildren. Environ Health
Perspect 2003; 111(12): 1512-18.
12. Shima M, Nitta Y, Adachi M. Trafic-Related air pollution and respiratory symptoms in children living along trunk
roads in Chiba Prefecture, Japan. J Epidemiol 2003;
13(2): 108-19.
13. Zmirou D, Gauvin S, Pin I, Momas I, Sahraoui F, Just J, et al. Trafic related air pollution and incidence of childhood asthma: results of the Vesta case-control
study (Research Report). J Epidemiol Community Health
2004; 58(1):1 8-23.
14. Bayer-Oglesby L, Schindler C, Arx MEH, Braun-Fahrlander C, Keidel D, Rapp R et al. Living near main
streets and respiratory symptoms in adults. Am J
Epidemiol 2006; 164:1190-8.
15. Kuehni CE, Strippoli MF, Zwahlen M, Silverman M. Association between reported exposure to road trafic and respiratory symptoms in children: evidence of bias.
Int J Epidemiol 2006; 35: 779–86.
16. Meng Y, Wilhelm M, Rull RP, English P, Ritz B. Trafic and outdoor air pollution levels near residences and
poorly controlled asthma in adults. Ann Allergy Asthma
Immunol 2007; 98: 455-63.
17. Chang J, Delino RJ, Gillen D, Tjoa T, Nickerson B,Cooper D. Repeated respiratory hospital encounters among children with asthma and residential proximity to trafic.
Occup Environ Med 2008; 66: 90-8.
18. Kan H, Heiss G, Rose KM, Whitsel EA, Lurmann F, London SJ. Prospective analysis of trafic exposure as a risk factor for incident coronary heart disease: The atherosclerosis risk in communities (ARIC) Study.
Environ Health Perspect.2008; 116(11): 1463-68.
19. Kim JK, Huen K, Adams S, Smorodinsky S, Hoats A, Malig B et al. Residential Trafic and Children’s
Respiratory Health. Environ Health Perspect 2008;
116(9): 1274-9.
20. Rosenlund M, Forastiere F, Porta D, Sario D, Badaloni C, Perucci CA. Trafic-related air pollution in relation to respiratory symptoms, allergic sensitisation and lung
function in schoolchildren. Thorax 2009; 64: 573–80.
21. Wilhelm M, Meng Y, Rull RP, English P, Balmes J, Ritz B. Environmental Public Health Tracking of Childhood Asthma Using California Health Interview Survey,
Trafic, and Outdoor Air Pollution Data. Environ Health
Perspect 2008; 116(8): 1254-60.
22. Migliore E, Berti G, Galassi C, Pearce N, Forastiere F, Calabrese R. Respiratory symptoms in children living near busy roads and their relationship to vehicular trafic: results of an Italian multicenter study (SIDRIA 2).
Environmental Health 2009; 8: 27-43.
23. Pujades-Rodríguez M, Lewis S, Mckeever T, Britton J, Venn A, Effect of living close to a main road on asthma, allergy, lung function and chronic obstructive pulmonary
disease. Occup Environ Med 2009; 66: 679-84.
24. Wilhelm M, Ritz B. Residential proximity to trafic and adverse birth outcomes in Los Angeles County,
California, 1994-1996. Environ Health Perspect 2003;
111(2): 207-15.
25. Green RS, Malig B, Windham GC, Fenster L, Ostro B, Swan S. Residential exposure to trafic and spontaneous
abortion. Environ Health Perspect 2009; 117(12):
1939-44.
26. Hooven EH, Jaddoe VWV, Kluizenaar Y, Hofman A, Mackenbach J, Steegers EAP et al. Residential trafic exposure and pregnancy-related outcomes: a
prospective birth cohort study. Environ Health 2009; 8:
59-70.
27. Medeiros APP, Gouveia N, Machado RPP, Souza MR, Alencar GP, Novaes HMD et al. Trafic-related air pollution and perinatal mortality: A case-control study.
Environ Health Perspect 2009; 117(1): 127-32.
28. Miyake Y, Tanaka K, Fujiwara H, Mitani Y, Ikemi H, Sasaki S et al. Residential proximity to a main roads during pregnancy and the risk of allergic disorders in Japanese infants: The Osaka Maternal and Child Health
Study. Pediatr Allergy Immunol 2009 [in press].
29. Kramer U, Koch T, Ranft U, Ring J, Behrendt H. Trafic-related air pollution is associated with atopy in children
30. Wyler C, Beraun-Fahrlande B, Kiinzli N, Schindler C, Ackermann-Liebric U, Perruchoud AP et al. Exposure to Motor Vehicle Trafic and Allergic Sensitization.
Epidemiology 2000; 11(4): 450-56.
31. Williams LA, Ulrich CM, Larson T, Wener MH, Wood B, Campbell PT et al. Proximity to Trafic, Inlammation, and Immune Function among Women in the Seattle,
Washington, Area. Environ Health Perspect 2009;
117(3):373-78.
32. Baccarelli A, Martinelli I, Pegoraro V, Stat B, Melly S, Grillo P et al. Living Near Major Trafic Roads and Risk of
Deep Vein Thrombosis. Circulation 2009; 119: 3118-24
33. Pearson RL, Wachtel H, Ebi KL. Distance-weighted trafic density in proximity to a home is a risk factor for
leukemia and other childhood cancers. Air Waste Manag
Assoc 2000; 50: 175-80.
34. Langholz B, Ebi KL, Thomas DC, Peters JM, London SJ. Trafic density and the risk of childhood leukemia in a
Los Angeles case-control study. Ann Epidemiol 2002;
12(7): 482-7.
35. Reynolds P, Elkin E, Scalf R, Behren JV, Neutra RR. A case-control pilot study of trafic exposures and early childhood leukemia using a geographic information
system. Bioeletromagnetics 2001; S5: 58-68.
36. Reynolds P, Behren JV, Gunier RB, Goldberg DE, Hertz A, Smith D. Trafic patterns and childhood cancer
incidence rates in California, United States. Cancer
Causes and Control 2002; 13:665-73.
37. Reynolds P, Behren Jv, Gunier Rb, Goldberg De, Hertz A. Residential exposure to trafic in California and
childhood cancer. Epidemiology 2004; 15(1): 6-12.
38. Furman A, Laleli M. Semi-occupational exposure to lead: a case study of child and adolescent street vendors
in Istanbul. Environ Res 2000; 83(1): 41-5.
39. Finkelstein MM, Jerrett M, SEARS MR. Trafic air
pollution and mortality rate advancement periods. Am J
Epidemiol 2004; 160: 173-7.
40. Lena TS, Ochieng V, Carter M, Holguin-Veras I, Kinney
PL. Elemental carbon and PM2,5 levels in an urban
community heavily impacted by truck trafic. Environ
Health Perspect 2002; 110(10): 1009-15.
41. Cançado JED, Braga A, Pereira LAA, Arbex MA, Saldiva PHN, Santos UP. Repercussões clínicas da exposição à
poluição atmosférica. J Bras Pneumol 2006; 32(S2): 23-9.
42. Roosbroeck Sv, Hoek G, Meliefste K, Janssen Nah, Brunekreef B. Validity of residential trafic intensity as an estimate of long-term personal exposure to
trafic-related air pollution among adults. Environ Sci Technol
2008; 42: 1337-44.
43. Su JG, Jerret M, Beckerman B, Wilhelm M, Ghosh Jk, Ritz B. Predicting trafic-related air pollution in Los Angeles using a distance decay regression selection strategy.
Environ Health 2009; 109: 657-70.