Heterozygous
KIT
Mutations Suggest Distinct Oncogenic
Pathways: A Study in NIH3T3 Cell Lines and GIST
Samples
Jean-Baptiste Bachet1,2,3., Se´verine Tabone-Eglinger4,8,9,10., Sophie Dessaux4,8,9,10 ,
Anthony Besse4,8,9,10, Sabrina Brahimi-Adouane1,5, Jean-Franc¸ois Emile1,5, Jean-Yves Blay4,6, Laurent Alberti4,7*
1EA4340 ‘Epide´miologie et Oncoge´ne`se des tumeurs digestives’, Faculte´ de me´decine PIFO, UVSQ, Guyancourt, France,2Hepato-Gastroenterology Department, Groupe Hospitalier Pitie´ Salpeˆtrie`re, APHP, Paris, France,3Faculte´ de me´decine Pierre et Marie Curie, UFR Paris VI, Paris, France,4Universite´ de Lyon, Lyon, France,5Pathology Department, Hoˆpital Ambroise Pare´, APHP, Boulogne, France,6Oncology Department, Centre Le´on Be´rard, Lyon, France,7Biopathology Department Centre Le´on Be´rard, Lyon, France,8Universite´ Lyon 1, ISPB, Lyon, France,9INSERM U1052, Centre de Recherche en Cance´rologie de Lyon, Lyon, France,10CNRS UMR5286, Centre de Recherche en Cance´rologie de Lyon, Lyon, France
Abstract
Objective:Most gain of function mutations of tyrosine kinase receptors in human tumours are hemizygous. Gastrointestinal stromal tumours (GIST) with homozygous mutations have a worse prognosis. We aimed to identify genes differentially regulated by hemizygous and heterozygousKITmutations.
Materials and Methods:Expression of 94 genes and 384 miRNA was analysed with low density arrays in five NIH3T3 cell lines expressing the full-length humanKITcDNA wild-type (WT), hemizygousKITmutation with del557-558 (D6) or del564-581 (D54) and heterozygous WT/D6 or WT/D54. Expression of 5 of these genes and 384 miRNA was then analysed in GISTs samples.
Results:Unsupervised and supervised hierarchical clustering of the mRNA and miRNA profiles showed that heterozygous mutants clustered with KIT WT expressing cells while hemizygous mutants were distinct. Among hemizygous cells, D6 and D54 expressing cells clustered separately. Most deregulated genes have been reported as potentially implicated in cancer and severals, as ANXA8 and FBN1, are highlighted by both, mRNA and miRNA analyses. MiRNA and mRNA analyses in GISTs samples confirmed that their expressions varied according to the mutation of the alleles. Interestingly, RGS16, a membrane protein of the regulator of G protein family, correlate with the subcellular localization of KIT mutants and might be responsible for regulation of the PI3K/AKT signalling pathway.
Conclusion:Patterns of mRNA and miRNA expression in cells and tumours depend on heterozygous/hemizygous status of
KITmutations, and deletion/presence of TYR568 & TYR570 residues. Thus each mutation ofKITmay drive specific oncogenic pathways.
Citation:Bachet J-B, Tabone-Eglinger S, Dessaux S, Besse A, Brahimi-Adouane S, et al. (2013) Gene Expression Patterns of Hemizygous and HeterozygousKIT Mutations Suggest Distinct Oncogenic Pathways: A Study in NIH3T3 Cell Lines and GIST Samples. PLoS ONE 8(4): e61103. doi:10.1371/journal.pone.0061103
Editor:Swati Palit Deb, Virginia Commonwealth University, United States of America
ReceivedNovember 14, 2012;AcceptedMarch 5, 2013;PublishedApril 12, 2013
Copyright:ß2013 Bachet et al. This is an open-access article distributed under the terms of the Creative Commons Attribution License, which permits unrestricted use, distribution, and reproduction in any medium, provided the original author and source are credited.
Funding:This work was supported in part by Conticanet (FP6-018806, INCA) and non profit organism AREP. The funders had no role in study design, data collection and analysis, decision to publish, or preparation of the manuscript. No additional external funding was received for this study.
Competing Interests:The authors have declared that no competing interests exist. * E-mail: [email protected]
.These authors contributed equally to this work.
Introduction
Gastrointestinal stromal tumors (GISTs) are the most frequent sarcomas [1], and are thought to be derived from intestinal cells of Cajal or precursors. Gain of function mutations of
proto-oncogenesKITorplatelet-derived growth factor receptor alpha(PDGFRA)
play a critical role in GIST pathogenesis [2], [3].KITmutations
are found in 85% of GISTs, and 5–10% forPDGFRAmutations;
both are mutually exclusive [4]. Most of the KIT mutations are
within the exon 11 (60%) with more than 90 different mutations described [4], [5], [6], [7]. Among them, the most frequent one is a short deletion in the proximal part of exon 11, delWK557-558,
accounting for 8% to 25% ofKITexon 11 mutations [5]. Imatinib
mesylate (GlivecH, GleevecH, Novartis, Basel), a KIT and
PDGFRA tyrosine kinase inhibitor, is the first-line reference treatment in advanced GISTs and in adjuvant setting [8], [9],
[10]. The mutational status ofKITorPDGFRAis highly predictive
mutations have a significant longer progression free survival and
overall survival than patients withKITexon 9 mutations or
wild-type GIST [11], [12]. Most of the GISTs have heterozygous mutations but homozygous mutations have also been reported accounting from 5% to 15% and seems to be associated with a worse outcome [13], [14], [15].
The KIT gene is a type III receptor tyrosine kinase whose
activation follows the binding of its specific ligand, the stem cell factor (SCF). Kinase activation of KIT results in a cascade of phosphorylation promoting cell growth and survival [16].
Inter-estingly, KIT exon 11 encodes an intra-cytoplasmic
juxtamem-brane domain which has an autoinhibitory function [17]. More particularly, two tyrosine residues (Tyr568 and Tyr570) in the juxtamembrane segment are the first to be phosphorylated and are implicated in activation of different signaling pathways as of the Src family kinases [18].
In GISTs, as in cellular models, normal trafficking of the KIT protein results in the predominant expression of the fully glycosylated 145 kDa form, which is expressed at cell surface. The 125 kDa precursor form is also observed at a weaker level and it is retained in the intracellular compartment due to its incomplete glycosylation [19], [20]. Extracellular binding of the SCF induces
phosphorylation of the mature form. In contrast, KITactivating
mutations are associated with a constitutive phosphorylation of the immature form in the intracellular compartment [19,20]. How-ever distinct signaling pathways were recently reported to be activated according to the subcellular location of heterozygous or homozygous KIT mutations [21]. While most of the patients have heterozygous mutations [6], [19], [20], [21], [22], we have developed one of the rare model of GIST with NIH3T3 cell lines containing heterozygous mutations. We took advantage of this model to perform a large scale analysis of GISTs signaling pathways according to allelic status of two of the most frequent exon 11 mutations.
In the present work, we combined several high throughput
analyses on hemi- or heterozygousKITmutated cell lines as well as
on GISTs samples. We demonstrated that the status of zygosity as well as the type of exon 11 mutation, in cell lines or in GISTs samples, possessed distinct gene expression and miRNA profiles. Interestingly, the heterozygous cell lines clustered more likely with wild-type cells than with hemizygous ones, thus decreasing importance of the mutated allele when coexpressed with the wild-type.
Materials and Methods
Reagents and Antibodies
Recombinant human SCF (rhSCF) used for the assays was purchased from R&D Systems and CHO-SCF, used for the culture, was a kind gift from P. Dubreuil. Imatinib mesylate was kindly provided from Novartis. The rabbit polyclonal anti-KIT antibody (clone A4502) was used for western blot, and the phycoerythrin-conjugated mouse monoclonal anti-KIT antibody (clone1045D2) for flow cytometry analysis (both from Dako, Trappes, France). The anti-phosphotyrosine 703 of KIT, used for western-blot and immunocytofluorescence analysis, were pur-chased from Clinisciences (Montrouge, France). Secondary-HRP antibodies (Dako) were used in western-blotting experiments.
Production of Recombinant Viruses and NIH3T3 Infection
NIH3T3 cell lines (ATCC NuCRL-1658) expressing the
full-length humanKITcDNA (GNNK isoform) wild-type (WT) or with
either homozygous mutations (del557-558 = D6, or del564-581 = D54 mutation), or heterozygous mutations (WT/D6 or WT/D54) were previously described [19], [21]. Briefly, WT or
mutated KIT were inserted in oncological vector pLNCX
(ClontechH) and MigR1, respectively [23]; both retroviral vectors
including the same cytomegalovirus promoter.
The plasmids containing WT and/or mutated KIT were
transfected in 293T cells. The media containing virus was then harvested and used to infect NIH3T3 cells (multiplicity of infection of 0.5). NIH3T3 cells with the pLCNX vector were selected with geneticin for 7 to 10 days before being isolated and amplified. NIH3T3 cells with the MIGR1 vector were amplified for 48 h after infection and green fluorescent protein-positive cells were sorted.
A NIH3T3 cell line expressing the empty MigR1 vector was produce as control and was called MIGR.
Cell Culture and Proliferation Study
NIH3T3-infected cells were cultivated in DMEM with 10%
newborn calf serum (Life TechnologiesH), 2%
penicillin/strepto-mycin, and 50 ng/ml of CHO-SCF so that the growths of wild-type and mutant forms were equivalent. CHO-SCF was removed during starvation performed before the assays. Recombinant human SCF (rhSCF) used for the assays was purchased from R&D
SystemsH.
High Density Arrays (CodelinkH)
CodelinkH Whole Mouse Genome Bioarrays (GE/Amersham)
of one sample of WT, D6, D54, WT/D6, WT/D54 and MIGR
NIH3T3 cells cultivated in the three different conditions SCF+,
SCF2and imatinib were used for the analysis of differential gene
expression. These microarrays contain 3.36104 single-stranded
30-mer oligonucleotide probes for mouse genes and transcribed sequences.
For the experiment, the various NIH3T3 KIT expressing cell lines were seed at 1 million per 6 cm plate in complete medium without SCF and keep in this condition during one night (16 hours). Then, the cells were incubated for 24 hours with or without rhSCF and/or imatinib as indicated.
Before RNA extraction, cells were detached following a classical
trypsine protocol (InvitrogenH), washed two times in cold PBS
(InvitrogenH) and finally freezed at280uC without supernatant.
Total RNA of NIH3T3 cells were extracted according to the
manufacturer’s protocol using TRIzolH method (InvitrogenH,
Carlsbad, CA). RNA quality was controlled by spectophotometry
using ND-1000 NanodropH and by microchips on Agilent
Table 1.mRNA analysis in GIST samples: details of selected genes.
Gene name Assay reference Specific primers sequences (59-.39)
18S Hs99999901_s1 GCCCGCTCCCAAGATCCAACTACGA
ANXA8 Hs00179940_m1 GCGATCTGCTGCCGCTGCGT
ETV6 Hs01045742_m1 AACTCATTTTCAGCCCACTT
FBN1 Hs00171191_m1 TGACCAGATGGGCAAGTGCA
GALNTL4 Hs00289325_m1 GCACTGCAGCTGTTTCCTGA
MFAP5 Hs00185803_m1 CGATGCACAGAGTAGAGCCT
RABEP1 Hs00388983_m1 GCTGCTGTTGTGCACGTAAA
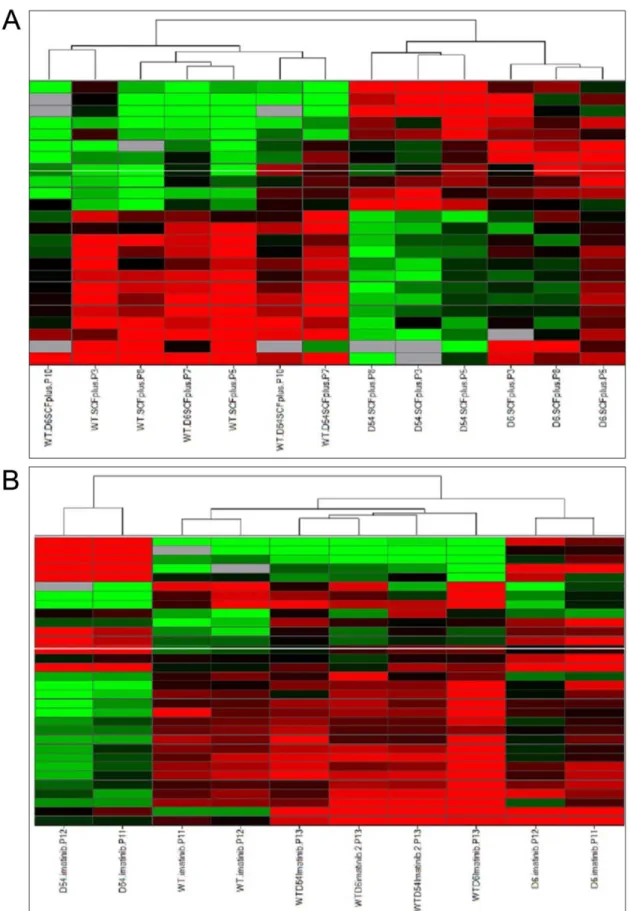
Figure 1. Unsupervised Hierarchical clustering of mRNA expressions in cell lines.A/upon SCF treatment, or B/with imatinib treatment. Each row represents the relative levels of expression of each mRNA and each columm shows the expression levels for each sample. The red or green color indicates relatively high or low expression, respectively, while grey squares indicate absent data points (WT, wild-typeKIT; D6, D6KIT; D54, D54 KIT; WT/D6, WTKITand D6KIT; WT/D54, WTKITand D54KIT).
Figure 2. Supervised Hierarchical clustering of mRNA expressions in cell lines following an ANOVA.A/upon SCF treatment or B/with imatinib treatment. Each row represents the relative levels of expression of each mRNA and each columm shows the expression levels for each sample. The red or green color indicates relatively high or low expression, respectively, while grey squares indicate absent data points (WT, wild-type KIT; D6, D6KIT; D54, D54KIT; WT/D6, WTKITand D6KIT; WT/D54, WTKITand D54KIT).
Figure 3. Principal component analysis (PCA) diagram of the 23 selected genes.A/upon SCF treatment or B/with imatinib treatment. PCA of mRNA selected genes in NIH3T3-infected cell lines as a tool to determine their capabilities to distinguish the different cell lines (WT, wild-typeKIT; D6, D6KIT; D54, D54KIT; WT/D6, WTKITand D6KIT; WT/D54, WTKITand D54KIT).
Figure 4. Unsupervised hierarchical clustering of miRNA expressions in cell lines.A/upon SCF treatment or B/with imatinib treatment. Each row represents the relative levels of expression of each miRNA and each columm shows the expression levels for each sample. The red or green color indicates relatively high or low expression, respectively, while grey squares indicate absent data points (WT, wild-typeKIT; D6, D6KIT; D54, D54 KIT; WT/D6, WTKITand D6KIT; WT/D54, WTKITand D54KIT).
Figure 5. Supervised hierarchical clustering of miRNA expressions in cell lines following an ANOVA.A/upon SCF treatment or B/with imatinib treatment. Each row represents the relative levels of expression of each miRNA and each columm shows the expression levels for each sample. The red or green color indicates relatively high or low expression, respectively, while grey squares indicate absent data points (WT, wild-type KIT; D6, D6KIT; D54, D54KIT; WT/D6, WTKITand D6KIT; WT/D54, WTKITand D54KIT).
Table 2.Characteristics of GISTs included in miRNA and mRNA analyses.
Tumor reference Anatomic site
Risk of
relapse* Sex Age (years)
KITExon 9 mutation
KITExon 11 mutation
PDGFRAExon 18 mutation
PDGFRAExon 10 mutation
F1511Nm rectum high M 70 WT WT WT wt
F1521Nm stomach moderate M 69 WT WT WT 2
F1522Nm small intestine moderate M 42 WT WT WT wt
F1529m small intestine moderate F 75 WT WT WT 2
F1507Nm peritoneum high M 53 WT WT D842V 2
F1508m 2 high M 67 WT WT D842V 2
F1525Nm peritoneum high F 69 WT WT D842V 2
F1526Nm stomach moderate F 86 WT WT D842V 2
F1527N 2 2 F 71 WT WT D842V 2
F1528N stomach low M 80 WT WT D842V 2
F1524Nm stomach low M 70 WT WT WT poly
F1535N small intestine high M 67 mutated WT WT 2
F1537Nm small intestine moderate F 69 mutated WT WT 2
F1538Nm small intestine low M 83 mutated WT 2 2
F1539m small intestine low F 65 mutated WT WT 2
F1540m mesentery high F 65 mutated WT WT 2
F1541Nm 2 2 M 80 mutated WT WT 2
F1550N stomach low F 51 WT W557R WT 2
F1551N stomach low F 48 WT Del557-560 WT 2
F1552N stomach low M 68 WT Dupl575-588 WT 2
F1553N stomach moderate M 75 WT Dupl578 WT 2
F1554N stomach low F 84 WT Dupl571-579 WT 2
F1555N stomach low F 65 WT V559D WT 2
F1556N stomach low M 83 WT V559D WT 2
F1512m small intestine high F 62 WT V559A WT 2
F1513m stomach moderate F 80 WT V560D WT 2
F1725& stomach high M 72 WT 567_569delinsC WT 2
F1726& stomach very low M 76 WT 570_576del WT 2
F1727& duodenum moderate F 42 WT 570_576del WT 2
F1728& other 2 M 73 WT 557_558del WT 2
F1729& other 2 M 88 WT 550_558del WT 2
F1730& small intestine high M 49 WT 557_558del WT 2
F1731& stomach moderate F 72 WT 557_558del WT 2
F1733& 2 2 M 72 WT 557_558del WT 2
F1734& small intestine moderate F 72 WT 559_573del WT 2
F1735& duodenum moderate F 73 WT 557_558del WT 2
F1736& small intestine moderate M 39 WT 556_571del WT 2
F1741& stomach moderate M 39 WT 567-576SdelinSCV WT 2
F1744& 2 2 M 2 WT 557_558del WT 2
F1745& small intestine high F 72 WT 556-570delinsH WT 2
F1746& small intestine moderate F 62 WT 536_572del WT 2
F1747& small intestine high M 68 WT 560_576del WT 2
F1748& rectum very low M 67 WT 550_558del WT 2
F1749& small intestine very low F 40 WT 560_576del WT 2
F1750& duodenum moderate F 59 WT 563_573delinsME WT 2
GISTs included in mRNAmanalysis, firstNand second&miRNA analyses.
*Risk of relapse was assessed using the Miettinen and Lasota classification which comprises the mitotic count, the maximal tumor diameter and the anatomic site. Abbreviations: M, male; F, female; poly, polymorphism ofPDGFRAexon 10;2, unknown data; Dupl, duplication.
bioanalyzer 2100 (AgilentH Technologies, Palo Alto, CA, USA). Then, for high density microarrays, total RNA (100 ng) were amplified and biotin-labeled by in vitro transcription (IVT) with a
MessageAmpTM II-Bacteria RNA Amplification Kit (Ambion/
Applied BiosystemH). Before amplification, spikes of synthetic
mRNA at different concentrations were added to all samples; these positive controls were used to ascertain the quality of the process. Ten micrograms of biotinylated cRNA was fragmented and
hybridized onto CodelinkH Whole Mouse Genome Bioarrays
(GE/Amersham) for 18 hours at 37uC at 300 rpm in an incubator.
The slides were washed and stained with streptavidin-cy5 (GE Healthcare) according to the manufacturer’s protocol. The slides
were scanned using a GenepixH 4000B scanner (Axon, Union
City, USA) and GenepixHsoftware, with the laser set at 635 mm,
the laser power at 100%, and the photomultiplier tube voltage at 60%.
The scanned image files were analyzed using CodeLinkH
expression software, version 4.2 (GE Healthcare), which produces both a raw and normalized hybridization signal for each spot on the array. The relative intensity of the raw hybridization signal on
arrays varies in different experiments. CodeLinkH software was
therefore used to normalize the raw hybridization signal on each array to the median of the array (median intensity is 1 after normalization) for better cross-array comparison. The threshold of detection was calculated using the normalized signal intensity of the 100 negative control samples in the array; spots with signal intensities below this threshold are referred to as ‘‘absent’’. The complete set of raw and normalized data is available at the GEO database under accession number GSE33968.
Selections of genes were performed by comparisons between group1 and group2 or group1 and group3 … Each sample from one group was compared with each sample from others groups,
and only genes showing a variation of average fold change$2
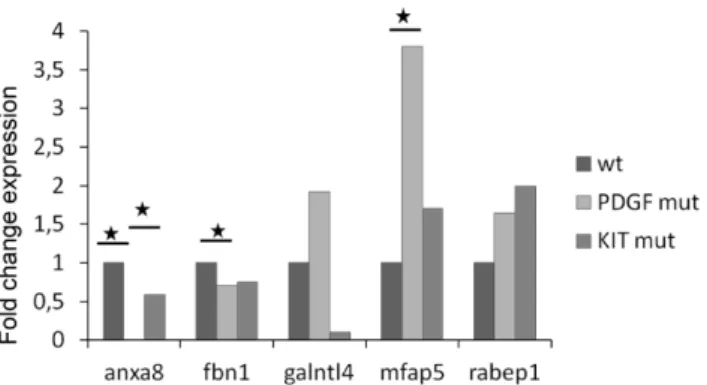
were retained. A gene was considered only if it met the above Figure 6. mRNA expressions of selected genes in GISTs
according to their mutational status.mRNA expressions of five selected genes were analyzed in 16 GISTs:Anxa8,Fbn1,Galntl4,Mfap5 andRabep1. Among the 16 GISTs, 4 GISTs were WTKITandPDGFRA, 5 harboured aPDGFRAmutation and 7 aKITmutation. Results of mRNA expression levels inPDGFRAorKITmutated GISTs are reported as N-fold differences in gene expression relative to the mRNA expression in WT GISTs. Mann Whitney test was used to assess significant difference. doi:10.1371/journal.pone.0061103.g006
Figure 7. Unsupervised hierarchical clustering of miRNA expressions in 20 GIST samples.The four main groups of the dendogram are gathered by mutation type: group 1, WTKITGIST; group 2,KITexon 11 orPRGFRAexon 18 mutation; group 3,KITexon 9 mutation and one tumor withKITexon 11 mutation.
criteria in all comparisons and if the detected signal was above the background for at least one of the compared tumor groups, thereby carrying a statistically significant absolute call ‘present’ or ‘marginal’ in all samples. The retained genes of interest were listed and classified according to their biological functions on the basis of
the Gene Ontology Consortium using IngenuityH Pathway
Analysis (Mountain View, CA).
TaqmanHLow Density Arrays Gene Expression
For low density arrays, RNA was extracted as for high density
array. Then, 5mg of RNA was submitted to reverse transcriptase
using High-capacity cDNA Archive kit (Applied BiosystemsH). As
control, screening of WT and/or D6 or D54 KIT exon 11 was
performed by length analysis of polymerase chain reaction products in all cell lines (MIGR, WT, D6, D54, WT/D6, WT/ D54 NIH3T3) [24].
The 94 genes of interest and one stable mRNA (MYH9) were
chosen after analysis of high density arrays. Microfluidic cards
Table 3.Relationship between clinical data and the homozygous/heterozygous status.
Factors
Univariate logistic regression
pvalue Fisher’s exact test pvalue
Age (years) ,60 0,327 0,673
$60 0,657
Gender Female 0,327 0,661
Male 0,593
Tumor Size (cm) ,6 0,147 0,665
$6 0,973
Mitosis (/5 mm2) ,2 0,083 1
$2 0,973
Necrosis No 0,637
,50 0,484
.50 0,995
Risk of relapse High 1
Moderate 0,184
Very Low 0,997
Histology type Epithelioid 0,997
Fusiform 0,997
Mixt 0,997
Non Gist 1
Pleomorphic 0,997
Primitive location duodenum 0,341
stomach 0,779
small intestine 0,779
jejunum-illeum 0,997
mesocolon 0,999
pelvis 0,999
perianal 0,999
rectum 0,999
Kit Immunohistochemistry + 1
++ 0,501
+++ 0,404
0 0,994
Kit intracellular locations
Golgi No 0,079 0,635
Yes 0,413
Membrane No 0,484 0,631
Yes 0,481
Cytoplasm No 0,996 0,526
Yes 0,996
Figure 8. Hierarchical clustering of miRNA expressions in 19 GIST samples with exon 11 mutation (homozygous vs heterozygous).
A/Unsupervised hierarchical clustering of miRNA expressions in 19 GIST samples. GIST samples were not classified according to their homozygous or heterozygous status in this unsupervised analysis. B/Supervised hierarchical clustering of GISTs using the 13 miRNA significantly deregulated (Anova test p,0.05). Homozygous and heterozygous tumors clustered separately except two heterozygous GISTs which were grouped with the homozygous.
performing high-throughput TaqmanH-based PCR assays, called
TaqmanHLow Density Arrays (TLDA), of these 95 selected genes
were obtained from AppleraH, Courtaboeuf. Each RNA sample
was independently obtained after cells culture in specific condition,
total RNA extraction with TRIzolH, and cDNA production. In
condition SCF+, three complete replicates of WT, D6 and D54
NIH3T3, and two complete replicates of WT/D6 and WT/D54
NIH3T3 were obtained. In condition imatinib (rhSCF +1mM
imatinib), two complete replicates of WT, D6, D54, WT/D6 and WT/D54 NIH3T3 were produced. For MIGR NIH3T3, two
complete replicates in condition SCF+, SCF2and imatinib were
obtained. Real-time quantitative PCR on TLDA were done with
the Abi PrismH7900HT sequence detection system.
Analysis of miRNA Using TLDA
Total RNA was extracted from pelleted cell lines using TRIzolH
method, according to the manufacturer’s instructions (InvitrogenH,
Carlsbad, CA). 500 ng of total RNA were subjected to the
microfluidic PCR technology performed by AppliedHBiosystems.
We obtained cDNAs complementary to 384 identified miRNAs using a pool of looped miRNA-specific RT primers, according to
the MegaplexH RT reaction protocol. PCR quantification was
performed using a TaqManH MicroRNA Array (TLDA human
pool A array) allowing the independent amplification of these 384 miRNA. Q-PCR was performed using a 7900 Sequence Detection System, which calculated the threshold cycle, or Ct (plate by plate manual Ct analysis with a threshold at 0.25, and automatic baseline).
TDLA Data Normalisation, mRNA and miRNA Analyses
For mRNA analysis, results, expressed as N-fold differences in target gene expression relative to the normalization gene, and
termed "Ntarget", were determined as Ntarget = 2DCtsample
, where
the DCt
value of the sample was determined by subtracting the average Ct value of the target gene from the average Ct value of the normalization gene (plate by plate manual Ct analysis with a threshold at 0.25 and automatic baselines). We tested different
methods of normalization since the ‘‘pseudo’’ stable MYH9gene
plotted in each card was not stably expressed in our different samples. Normalisation with the four most stable mRNAs
identified in GeNorm (Smc1a, Usp33,Nsmaf andRabep1) was not
optimal too. Finally, a global normalization by the median was chosen for its reliability over experiments. Distribution of normalized data was checked with box plots and correlation plots. For each mRNA, the threshold cycle (Ct) was calculated with the
RQ Manager 1.2 software (Applied BiosystemsH). Data
manipula-tions were done using R scripts and automated Excel sheets. A cut-off at 35 Ct was applied to discard late Ct values. For each TLDA, quality controls were performed on the raw data by checking internal controls and using box plot and scatter plot diagrams. Samples with any kind of problems were discarded so they would not introduce bias during the global normalization procedures. The following formula was used to correct Ct values of every card:
½CtNormalized~Ct ½mean of medians
=½median of the card
Through this approach, the new median value shared by all samples can be considered as a sort of perfect ‘‘virtual
housekeeping gene’’. Therefore the standard DDCt method can
be used to determine the relative quantities as follows:
DCt~½CtNormalized{½New shared median
For theDDCt calculation, as described previously [25], it was
more relevant for the statistical analyses to use the mean of allDCt
obtained across samples for each mRNA, instead of using theDCt
of a reference sample:
DDCt~DCt{mean½DCt across samplesmRNA
RQ~2{(DDCt)
The same methodology was used for miRNA analysis. For statistical analysis, normalized relative quantities data were
directly input into the TIBCO SpotfireH DecisionSite for
Functional Genomics analysis software. Data of interest were then used as variables in a two dimensional principal component analysis (PCA) performed with R 2.9.0 package to demonstrate their capabilities to distinguish the different cell lines. PCA supplies a simplified two-dimensional picture to our multivariate dataset of mRNA RQ values. By mathematical combination of values according to their strength, two principal components are created that represent as much as possible the variability of the data.
GISTs miRNA and mRNA Analyses
For mRNA analysis, we quantified 5 mRNA (ANXA8, FBN1,
GALNTL4,MFAP5and RABEP1)of the highlighted genes in the gene expression analysis of our cell lines in 4 WT-GIST, 5
PDGFRA mutants and 7 KIT mutants. Samples were formalin-fixed paraffin-embedded tumors. 100 ng of total tumoral RNA were used for each single qPCR reaction. Reverse transcription was performed using the high capacity cDNA reverse transcription
kit (Applied BiosystemsH) according to the manufacturer’s
instruction. To verify the efficacy of provided random primers, specific reverse transcription was simultaneously performed with
gene’s specific primers at a final concentration of 0.5mM. qPCR
reactions were performed using custom 96-well plates TaqManH
Gene Expression Assay following the program of heating to 95uC
for 10 minutes and 40 cycles of 15 seconds at 95uC and 1 minute
at 60uC. Assays are summarized in table 1.
Data normalization: A cut-off of 37 was applied to discard late
Ct values. As the recommended18Snormalization gene was found
very variable in our experiments (standard deviation of 5.5 Ct),
normalization was performed using the ETV6 gene (standard
deviation of 1.5 Ct) shown as stable on cell lines’ experiments. We calculated the mean Ct for ETV6 on all our experiments and used this value to determine tumor-specific correcting factors F, with i genes and j patients:
Fi,j~
1= N|P
N
j~1 CtETV6,j
CtETV6,j
Ct values were then corrected for each tumor andDCt values
were calculated as follows:
DCti,j~Norm(Cti,j){1
N| XN
j~1 CtETV6,j
For miRNA analysis, 20 patients diagnosed with GIST were included in this study. Groups were formed regarding to the kind of mutations harbored, regardless to any other variable. However,
as no homozygousKITmutated sample was available in this first
mRNA analysis, we performed a second analysis of miRNA profiling on a new serie of GISTs; all are mutated on the exon 11 with 6 of homozygous and 13 heterozygous. Groups were formed regarding to the homozygous or heterozygous status of exon 11
KITmutation, regardless to any other variable. Both histological
and molecular analyses were performed at the Centre Le´on Be´rard in Lyon. Samples were formalin-fixed paraffin-embedded tumors. For tumor fragments, two phenol/chloroform extractions were performed with a DNAse step in between. miRNA profiling was performed using the TLDA platform and the human 384-microfluidic card A. As described for miRNA analysis form cell
lines, the same method was used for theDDCt calculation and the
statistical analysis [25].
Statistical Analyzes
We performed univariate and multivariate logistic regression analyses to examine the relationship between the clinical data and the homozygous/heterozygous status. We studied multiple factors: age, gender, tumor size, mitosis, necrosis, risk of relapse, histology type, primitive location, kit immunohistochemistry and kit intracellular locations (Golgi, membrane, cytoplasm). Quantitative variables (age, tumor size, mitosis) were categorized. The different cutoffs used to create two groups for each factor were: 60 years (age), 6 cm (tumor size), 2 (mitosis). Furthermore, Fisher’s exact test was used for the 2-categorical variables (age, gender, tumor size, mitosis, kit intracellular locations).
Ethics Statement
Patients with GISTs of this study were included in the MolecGIST study which is a prospective population-based study of GISTs. Participants in MolecGIST provide their verbal informed consent to participate in this study after reading an information note.
Patients were informed that molecular analyses from the tumor would be conducted within the framework of the study. These analyzes relate only to the resected tumor sample in the context of routine care and no additional sample was collected in this study. In the absence of germline analysis on the patient himself, a written consent was not requested by the French ethical committee.
The process of information and oral consent was not documented, because it was not required by the ethical committee. Details concerning the study are publicly available on http://
www.gist-france.org/tumeur.html#tumeur since April 6th2006.
MolecGIST was approved by French ethical committee: "Comite´ pour la Protection des Personnes se preˆtant a` des Recherches Biome´dicales" (CPPRB, Committee for the Protection of Persons suitable for Biomedical Research) Saint Germain en
Laye#06029, April 24th 2006.
Informed consent was obtained from all patients.
Results
High Density Arrays (CodelinkH)
The gene expression profiles of the cell lines were first performed to a high density. The aim of this analysis was to identify the most relevant genes that characterized the different c-kit cell lines and then to validate them by TLDA analysis. From the complete set of raw (GEO database GSE33968), we selected genes differentially expressed between WT and hemizygous
samples grown in the SCF+ condition, whose fold change was
superior or equal to 2 and whose expression for at least one of the sample was greater than 1.3 (commonly admitted threshold for low density arrays). We then selected 83 and 126 genes more, that were differentially expressed between D6 and D54 cell lines (fold
change $2; gene amplification .1.3), in SCF+ or SCF2
condition, respectively. Finally we obtained a list of 235 genes of
which 94 were available for TaqmanH low density array
(AppliedH).
TLDA and Gene Expression Profiles
The mRNA expression profiles of the various cell lines were performed using low density array on the 94 selected genes. Firstly, to eliminate possible non specific mRNA, we performed unsuper-vised hierarchical clustering of MIGR NIH3T3 samples cultivated
in the three different conditions (SCF+, SCF2, imatinib). Using
ANOVA tests with p-values of 0.05, mRNAs which were
statistically differentially expressed in MIGR NIH3T3 samples were considered non specific of KIT pathways and were excluded for further analysis. Then, we performed unsupervised hierarchical clustering to classify WT, D6, D54, WT/D6, WT/D54 NIH3T3 samples by groups. The selection of mRNAs useful to differentiate
cell line samples under SCF+ or imatinib conditions was
statistically realized using ANOVA tests withp-values of 0.05 at
least. Upon SCF treatment, an unsupervised hierarchical cluster-ing based on Euclidian distance revealed that heterozygous mutants clustered together with WT cells, whereas hemizygous mutants were distinct from WT cells and heterozygous mutants
(Figure 1A). In the presence of 1mM imatinib, an unsupervised
hierarchical clustering also shown that heterozygous mutants clustered together with WT cells. By contrast, D6 and D54 hemizygous mutants were clustered distinctly from each other and segregated also differently from heterozygous mutants and WT cells (Figure 1B).
Thereafter, we performed a supervised hierarchical clustering
following an ANOVA (p,0.04) between the five transfected cell
lines. The clustering confirmed proximity of WT and heterozygous mutants’ profiles upon SCF stimulation, while hemizygous mutants were still distinct (Figure 2A). Again, in the presence of
1mM imatinib, hemizygous mutants were clustered separately and
distinct from WT cells and heterozygous mutants, but heterozy-gous mutants were slightly distinct from WT cells (Figure 2B).
Using a statistical analysis based on principal composant analysis, we selected 23 genes which were frequently deregulated
between WT cellsvsheterozygousvshemizygous mutants:Anxa8,
Farp2, Fbn1, Galntl4, Gpr149, Ifi47, Mfap5, Ncam1, Nf1, Olfr30, Ptx3, Rabep1, Rgs16, Riok1, Runx1t1, Slit3, Thsb1, Trim66, Ulk1, Upp1, Usp33, Wisp1, Wisp2. This mathematical procedure assigned for each contributory mRNA in transfected cell lines a new coordinate system, composed of two coordinates, which allow to study the variability between a set of variables. The results were consistent with those of unsupervised and supervised hierarchical clustering.
In the SCF+condition, heterozygous mutants and WT cells were
imatinib, four different groups of cell lines were clearly individ-ualized: WT cells, heterozygous mutants, D6 and D54 mutants (Figure 3B).
miRNA Expression on KIT-expressing NIH3T3 Cells Classify Samples According to the Mutation Type and to the Presence of an Additional Wild-type Allele
We then performed miRNA profiling on theKIT expressing
WT, D6, D54, WT/D6 and WT/D54 cell lines. We first eliminated unspecific miRNA by identifying deregulated miRNA upon transfection. Hence, 61 miRNAs were differentially expressed in NIH3T3 and MIGR cell lines (ANOVA test
p,0.01). Among the 384 tested miRNA, 184 were deregulated
by KIT expression in these cell lines. Finally, although a moderate significance of the ANOVA test between WT and mutant cell lines
(p,0.07) due to the high background of NIH3T3 cell lines, 11
miRNA were specifically related to the presence of a hemizygous
or heterozygous KIT mutation: miR-19b, miR-26a, miR-26b,
miR-28-3p, miR-29a, miR-29b, miR-100, miR-192, miR-218, miR-222, and miR-708.
An unsupervised hierarchical clustering revealed that upon SCF stimulation WT cells were branched to the heterozygous mutants group (Figure 4A). Hemizygous cell lines clustered separately, which is consistent with our previous gene expression analysis. Upon imatinib treatment, the miRNA profile of D6 cells get together with the WT/D6 mutant. WT cells were still branched to the heterozygous cell lines, while D54 cells remained separated (Figure 4B).
Supervised hierarchical clusterings were then performed using an ANOVA test at 5% between hemizygous and heterozygous cell lines. As a supervised analysis required groups, the WT cell line was added following the ANOVA test. We observed that untreated WT cells clustered with heterozygous cells while hemizygous cell lines clustered separately, leading to a clustering similar to Figure 5A. After imatinib treatment, hemizygous appeared as a define group (Figure 5B). WT and WT/D6 cells were enclosed together, while WT/D54 cells were separated.
miRNA and mRNA Expression Patterns of GIST Classify Tumors Mainly According to their Mutational Status
To confirm the relevance of the molecular signatures found in our vitro model we analyzed the profiles of GIST samples whose clinical and molecular characteristics are detailed in Table 2.
For the mRNA analysis in GIST samples, we focused on ANXA8, FBN1, GALNTL4, MFAP5 and RABEP1. We observed the upregulation of MFAP5 in the mutated GISTs when compared to the WT tumors (Figure 6). This gene seemed
particularly affected inPDGFRAmutated GIST (U testp= 0.02).
Anxa8 was differentially expressed between WT and PDGFRA
mutants (U testp= 0.01), and betweenKITmutants andPDGFRA
mutated tumors (U test p= 0.03). FBN1 was significantly less
expressed in PDGFRA mutants than in WT tumors (U test
p= 0.02). Interestingly, by separating exon 9 and exon 11 mutated
tumors standard deviation forGALNTL4expression was reduced,
so that a significant difference in its expression was found between
PDGFRAmutants andKITexon 9 mutated GIST (U testp= 0.03). Twenty GISTs were included in the first miRNA analysis: three were WT, while the others harbored heterozygous mutations
involving eitherPDGFRA D842Vmutations (n = 6) orKIT(n = 11).
Unsupervised hierarchical clusterings of these tumors were performed (Figure 7). It highlighted three distinct groups of tumors, mainly consistent with their mutational status. Group 1
was exclusively composed of WTKITtumors; group 2 contained
both PDGFRA and KIT exon 11 mutated GIST. KIT exon 9 mutated tumors were localized in group 3.
In the second miRNA analysis, 19 GIST samples with
homozygous or heterozygous exon 11 KIT mutation were
included. Thirteen mRNA were specifically related to
homozy-gous/heterozygous status of KIT mutation: miR-518f, miR-331,
miR-628, miR-145, miR-139, miR-335, miR-526b, miR-190, miR-548c, miR-202, miR-339, miR-203, and miR-301b (Anova
test p,0.05). MiR-222 was the only common miRNA found
between the cell lines and GIST samples analysis but was not statistically significant. Six genes deregulated between cell lines are targeted by miR-548c, miR-145, miR-301b, and miR-628-5p:
Anxa8, Fbn1, Ptx3, Upp1, and Usp33. Unsupervised hierarchical clusterings of these 19 tumors were performed and did not classify the tumors according to their homozygous/heterozygous status (Figure 8A). Supervised hierarchical clusterings were then performed using the 13 miRNA significantly deregulated between the homozygous and heterozygous tumors with Anova test. With this methodology, homozygous and heterozygous tumors clustered separately except two heterozygous GISTs which were grouped with the homozygous (Figure 8B). Using a 5% threshold for the p-values, the regression analyses and the Fisher’s exact tests revealed no significant relation between the clinical data and the homozygous/heterozygous status (Table 3).
Discussion
The discovery and the characterization ofKIT/PDGFRArole in
GISTs pathogenesis has led to a better identification of GIST among others gastrointestinal stromal tumors and to the develop-ment of targeted therapies in this disease. The KIT
immuno-staining, as well as the molecular analysis of theKIT and PDGFRA
genes became major diagnostic tools [26]. The KIT inhibitor, imatinib mesylate, showed dramatic antitumor effects and is representing now the standard treatment in advanced GIST, as well as in adjuvant setting [9], [11]. Typically, GIST are
heterozygous, but loss of the remaining WTKITallele occurs in
approximately 5% to 15% of tumors and homozygous GISTs seem to associate with a malignant behavior in 90% of cases [13], [14], [15]. This worsened prognosis could be explained by at least two opposite hypotheses. One the one hand, homozygous status with the loss of the wild-type allele may have a highly intrinsic oncogenic effect, possibly by loss of regulatory mechanisms of KIT. On the other hand, homozygous status may be only a marker of late-stage tumors that have undergone multiple genetic events without specific oncogenic effect.
These data led us to develop an adequate cellular model
expressing hemizygous or heterozygousKITmutation in the aim
to better understand the molecular implications of the hemi/ heterozygous status. Previous work on our NIH3T3 cellular model
allowed us to characterize hemizygous humanKITmutants called
D6 (D557–558) and D54 (D564–581) [19], as well as heterozygous ones [21]. In the present work, we completed these observations by analyzing these different cell lines, using high throughput tools and validation with GIST samples. Both mRNA and miRNA analyses demonstrated the close relationship between
heterozy-gous mutants and WT samples, the distance with hemizyheterozy-gousKIT
samples according to the type of mutation (WT,KITexon 11, 9 or
PDGFRA). This suggests that, while the heterozygous/homozygous status have a real impact on the tumor expression profile, it may be weaker than the type of mutation.
Interestingly, while epidemiologic data [13], [14], [15], and mouse experiments reported clinic-pathologic and phenotypic differences between homozygous and heterozygous KIT activating mutations [27], [28], this study is among the rare in vitro studies evaluating the biological significance of that. Indeed, we recently shown in the same in vitro model that glycosylation, membrane expression and signal transduction of KIT are different in mutant and WT [19], and are also different in hemizygous and homozygous conditions [21].
We showed in the present study, that some genes were differentially expressed in hemizygous cell lines comparing to the cell lines containing the WT allele. The membrane protein RGS16 was found differentially down-regulated in hemizygous or heterozygous mutants when stimulated with SCF. In contrast, upon kinase inhibition, it was keep deregulated only in hemizygous mutants. Interestingly, RGS16, which is a member of the regulator of G protein family, was reported to negatively regulate the PI3K/
AKT activity by competitively prevent the binding of p85awith
the tyrosine kinase receptor adaptor Gab1 [29]. Consistently, we previously reported that AKT was less phosphorylated in hemizygous cell lines than in WT and heterozygous cell lines in presence of SCF, and that the inhibition of KIT membrane expression was associated with a major decrease of phosphorylated AKT in WT and heterozygous cell lines [21].
Furthermore most of the genes we found differentially regulated in hetero- homozygous conditions were already shown to be implicated in cancers, and several studies supported their biological significance. Loss of RGS16 was thus proposed to promote tumors by increasing proliferation and evasion from tyrosine kinase inhibitors treatment [29], [30]. The gene Mfap5, or Magp2, was also particularly upregulated in hemizygous mutants while heterozygous showed expression level very closed to the WT. It encodes a microfibril-associated glycoprotein implicated in Notch signaling pathway, and its overexpression has been reported as a poor prognostic biomarker in ovarian and head and neck cancers, probably through a proangiogenic effect [31], [32]. In GIST, the Notch pathway has been described recently as implicated in negative regulation of KIT expression,
and high expression ofHES1 (hairy and hencer of split 1), one of the
targeted genes of the Notch pathway, was associated with a better prognosis in patients with GIST [33]. Interestingly, Mfap5 was reported as able to promote angiogenesis by antagonizing Notch signaling pathways in endothelial cells [34]. Thus, the interactions between KIT, HES1 and Mfap5 may be implicated in GIST pathogenesis and malignancy.
Most of the 23 others genes differently regulated in WT cells, heterozygous and hemizygous mutants are involved in cancers. A first group is implicated in cell trafficking and endocytosis, such as the golgi protein Galntl4, Rabep1 (or rabaptin), implicated in endocytosis [35], [36], annexin A8 (Anxa 8) which directly regulates organization and function of the late endosome [37], [38], and the deubiquitinase USP33 which inhibits the lysosomal trafficking [39], [40]. A second group of genes encodes for proteins which are implicated in cell-to-cell interactions and cell-matrix interactions: Farp2, Fbn1, Ncam1 and Thbs1. Fbn1 encodes the extracellular matrix protein fibrillin-1, and its mutation results in the dominant connective tissue disease Marfan syndrome. Quantitative methylation analyses have recently reported that the promoter of Fbn1 was hypermethylated in colorectal and prostate cancers in comparison to normal tissues, suggesting that
this gene could play a role in oncogenesis [41], [42]. Slit3 is a secreted protein whose family is known to regulate migration of neural cells, and its downregulation seems implicate in progression of various cancers [43], [44]. A third group of proteins is involved in cell signaling or gene regulation: Wisp 1, Wisp2, Nf1, Ulk1, Runx1t1. Wisp1 and Wisp2 are members of the Wnt inducible signalling pathway (WISP) protein subfamily and have been described as deregulated in several cancers [45], [46], [47], [48], [49]. Activation of Wnt signaling results in the inhibition of a
degradation complex which targets b-catenin for proteosomal
degradation. The accumulation ofb-catenin in the cytoplasm then
its translocation to the nucleus and its binding to T-cell specific transcription factor/lymphoid-enhancer binding factor (TCF/ LEF) complex led to the modulation of target genes implicated in cell cycle regulation [50]. Recently, upregulation of the Wnt signaling through autocrine activation has been reported in sarcoma cell lines and in human sarcomas [51]. In these tumors, Wnt activation resulted in cell proliferation via upregulation of the
TCF/b-catenin target geneCDC25Awhich plays a nonredondant
role in regulating cell cycle [51]. Nf1 which is a negative regulator of the ras signal transduction pathway, mutated in neurofibroma-tosis type 1, also confers an increased risk of developing WT GISTs [52]. Ulk1, which plays an essential role in autophagosome formation through activation or regulation of the AMP activated protein kinase and mTOR, is overexpressed in esophagus squamous cell carcinoma [53]. Runx1t1 encodes a member of the myeloid translocation gene family and recruit a range of corepressors to facilitate transcriptional repression. Chromosomal
translocations involving Runx1t1 are well-documented and have
been associated with several types of leukemia [54].
The presence or absence of the two tyrosine residues Tyr568 and Tyr570, may be associated with various effects in KIT regulation and/or signaling pathways activations. Phosphorylated Tyr568 serves as a docking site for the Src-like kinase Fyn which activate the Rac1/JNK pathway, for the adapter protein Shc which activate the Ras/MAP kinase pathway, and for the adapter protein APS and the ubiquitin E3 ligase Cbl which may play a role in the degradation of KIT [55], [56], [57], [58], [59]. The Csk homologous kinase (CHK) and the Src kinase Lyn bind to phosphorylated Tyr568 and Tyr570 [60], [61]. SHP-1 and SHP-2 tyrosine phosphatases bind to non-phosphorylated Tyr570 and Tyr568, respectively, and may negatively regulate KIT activation [62]. Consequently, a deletion of both Tyr568 and Tyr570 could disturb the autoinhibition conformation of exon 11 but also alter some protein-protein interactions and signaling pathway activa-tions. Consistently, we demonstrated different mRNA and miRNA
expression profiles in D6 and D54 cells. Thus, the loss of bothKIT
exon 11 tyrosine residues was associated with specific modifica-tions in gene expression. For example, Wisp2 was overexpressed in D54 cells in comparison to D6 cells whereas Wisp1 was expressed at similar level in both cell lines. Others genes differentially expressed between D6 and D54 cells (more than 3 times) in all conditions (without SCF, with SCF, with IM) were: Galntl4, Prelp, Ptx3 were overexpressed in D54 cells whereas Gpr149, Ifi47, Ncam1, Upp1 were overexpressed in D6 cells.
In tumor samples gene expression analysis showed no significant
variation between WT and heterozygous KIT mutated tumors,
with a high inner variability inANXA8,FBN1,GALNTL4,MFAP5
andRABEP1expression, which was partly reduced by separating exon 9 and exon 11 mutated tumors. While this absence of variation is globally quite consistent with the closed profiles we observed between WT and heterozygous cell lines, the inner
variability of mutation type in theKIT mutant group might also
participate to this result. For the future we will need to significantly increase the number of the cohort to validate our hypothesis. On
the contrary, our results on the 5PDGFRAmutated tumors were
very stable. The striking stability of our gene expression results on
PDGFRA mutated tumors could be explained by the D842V mutation found on 4/5 samples. The fifth tumor exhibited an exon 10 polymorphism and had expression values in the range of exon 18 mutated tumors. The response to targeted therapies, such as imatinib and sunitinib, is also dependent of the type of mutation [11], [12], [64]. Interestingly, miRNA and mRNA profiles also suggested that the two mutations do not respond in the same way to imatinib treatment as their profile that clustered initially were
then segregated under treatment (Figures 3Avs3B).
In conclusion, our results shown that heterozygous/hemizygous
status, as well as the presence or not of the two KIT exon 11
tyrosine residues, were associated with specific modifications in gene expression of both mRNA and miRNA. These results suggest
that deletion of the WT allele of KIT or deletion of the two
tyrosines Tyr568 and Tyr570 may be associated with specific
biological effects. Interestingly, most of the gene found frequently deregulated between cell lines encoded proteins which have been reported as deregulated in cancer. These results demonstrate the relevance of our cellular model and may allow to better understand other molecular events associated with GIST patho-genesis and malignancy. We have also clearly shown that both mRNA and miRNA profiling allowed the gathering of some tumors according to their mutational status, giving complementary results. A more complete mRNA and miRNA screening should be performed and followed by an integrative analysis of the results, including clinical follow-up information for each patient. Such search strategy could allow to identify new molecular targets and/ or signaling pathways driven GIST pathogenesis, and to define new GIST subgroups.
Acknowledgments
The authors would like to thank Dr Fre´de´ric Subra, for purchasing cell lines.
Author Contributions
Conceived and designed the experiments: JBB STE JFE JYB LA. Performed the experiments: JBB STE SD AB SBA LA. Analyzed the data: JBB STE SD AB SBA JFE JYB LA. Contributed reagents/materials/ analysis tools: JBB STE SD AB SBA JFE JYB LA. Wrote the paper: JBB STE JFE JYB LA.
References
1. Cassier PA, Ducimetie`re F, Lurkin A, Ranche`re-Vince D, Scoazec JY, et al. (2010) A prospective epidemiological study of new incident GISTs during two consecutive years in Rhoˆne Alpes region: incidence and molecular distribution of GIST in a European region. Br J Cancer 13: 165–170.
2. Heinrich MC, Corless CL, Duensing A, McGreevey L, Chen CJ, et al. (2003)
PDGFRAactivating mutations in gastrointestinal stromal tumors. Science 299: 708–710.
3. Hirota S, Isozaki K, Moriyama Y, Hashimoto K, Nishida T, et al. (1998) Gain-of-function mutations of c-kit in human gastrointestinal stromal tumors. Science 279: 577–580.
4. Rubin BP, Heinrich MC, Corless CL (2007) Gastrointestinal stromal tumour. Lancet 369: 1731–1741.
5. Bachet JB, Hostein I, Le Cesne A, Brahimi S, Beauchet A, et al. (2009) Prognosis and predictive value of KIT exon 11 deletion in GISTs. Br J Cancer 101: 7–11. 6. Corless CL, Fletcher JA, Heinrich MC (2004) Biology of gastrointestinal tumors.
J Clin Oncol 22: 3813–3825.
7. Emile JF, The´ou N, Tabone S, Cortez A, Terrier P, et al. (2004) Clinicopathologic, phenotypic, and genotypic characteristics of gastrointestinal mesenchymal tumors. Clin Gastroenterol Hepatol 2: 597–605.
8. Blanke CD, Rankin C, Demetri GD, Ryan CW, von Mehren M, et al. (2008) Phase III randomized, intergroup trial assessing imatinib mesylate at two dose levels in patients with unresectable or metastatic gastrointestinal stromal tumors expressing the kit receptor tyrosine kinase: S0033. J Clin Oncol 26: 626–632. 9. DeMatteo RP, Ballman KV, Antonescu CR, Maki RG, Pisters PW, et al. (2009)
Adjuvant imatinib mesylate after resection of localised, primary gastrointestinal stromal tumour: a randomised, double-blind, placebo-controlled trial. Lancet 373: 1097–1104.
10. Verweij J, Casali PG, Zalcberg J, LeCesne A, Reichardt P, et al. (2004) Progression-free survival in gastrointestinal stromal tumours with high-dose imatinib: randomised trial. Lancet 364: 1127–1134.
11. Debiec-Rychter M, Sciot R, Le Cesne A, Schlemmer M, Hohenberger P, et al. (2006) KIT mutations and dose selection for imatinib in patients with advanced gastrointestinal stromal tumours. Eur J Cancer 42: 1093–1103.
12. Heinrich MC, Corless CL, Demetri GD, Blanke CD, von Mehren M, et al. (2003) Kinase mutations and imatinib response in patients with metastatic gastrointestinal stromal tumor. J Clin Oncol 21: 4342–4349.
13. Emile JF, Bachet JB, Tabone-Eglinger S, Terrier P, Vignault JM (2008) GIST with homozygous KIT exon 11 mutations. Lab Invest 88: 456–457. 14. Lasota J, vel Dobosz AJ, Wasag B, Wozniak A, Kraszewska E, et al. (2007)
Presence of homozygous KIT exon 11 mutations is strongly associated with malignant clinical behavior in gastrointestinal stromal tumors. Lab Invest 87: 1029–1041.
15. Wallander ML, Willmore-Payne C, Layfield LJ (2011) C-KIT and PDGFRA zygosity in gastrointestinal stromal tumors: Correlation with tumor site, tumor
size, exon, and CD117 immunohistochemistry. Appl Immunohistochem Mol Morphol 19: 21–27.
16. Blume-Jensen P, Claesson-Welsh L, Siegbahn A, Zsebo KM, Westermark B, et al. (1991) Activation of the human c-kit product by ligand-induced dimerization mediates circular actin reorganization and chemotaxis. EMBO J 10: 4121–4128. 17. Mol CD, Dougan DR, Schneider TR, Skene RJ, Kraus ML, et al. (2004) Structural basis for the autoinhibition and STI-571 inhibition of c-Kit tyrosine kinase. J Biol Chem 279: 31655–31663.
18. Roskoski R (2005) Structure and regulation of Kit protein-tyrosine kinase – the stem cell factor receptor. Biochem Biophys Res Commun 338: 1307–1315. 19. Tabone-Eglinger S, Subra F, El Sayadi H, Alberti L, Tabone E, et al. (2008)
KIT mutations induce intracellular retention and activation of an immature form of the KIT protein in gastrointestinal stromal tumors. Clin Cancer Res 14: 2285–2294.
20. Xiang Z, Kreisel F, Cain J, Colson A, Tomasson MH (2007) Neoplasia driven mutant c-KIT is mediated by intracellular, not plasma membrane, receptor signaling. Mol Cell Biol 27: 267–282.
21. Brahimi-Adouane S, Bachet JB, Tabone-Eglinger S, Subra F, Capron C, et al. (2012) Effects of endoplasmic reticulum stressors on maturation and signaling of hemizygous and heterozygous wild type and mutants forms of KIT. Mol Oncol (in press).
22. Casteran N, De Sepulveda P, Beslu N, Aoubala M, Letard S, et al. (2003) Signal transduction by several KIT juxtamembrane domain mutations. Oncogene 22: 4710–4722.
23. Pear WS, Miller JP, Xu L, Pui JC, Soffer B, et al. (1998) Efficient and rapid induction of a chronic myelogenous leukemia-like myeloproliferative disease in mice receiving P210 bcr/abl-transduced bone marrow. Blood 92: 3780–4003. 24. Emile JF, Lemoine A, Bienfait N, Terrier P, Azoulay D, et al. (2002) Length
analysis of polymerase chain reaction products: a sensitive and reliable technique for the detection of mutations in KIT exon 11 in gastrointestinal stromal tumors. Diagn Mol Pathol 11: 107–112.
25. Gougelet A, Perez J, Pissaloux D, Besse A, Duc A, et al. (2011) miRNA Profiling: How to bypass the current difficulties in the diagnosis and treatment of sarcomas. Sarcoma 13: ID 460650.
26. Casali PG, Jost L, Reichardt P, Schlemmer M, Blay JY (2008) Gastrointestinal stromal tumors: ESMO clinical recommendations for diagnosis, treatment and follow-up. Ann Oncol (Suppl. 2): ii35–8.
27. Rubin BP, Antonescu CR, Scott-Browne JP, Comstock ML, Gu Y, et al. (2005) A knock-in mouse model of gastrointestinal stromal tumor harboring kit K641E. Cancer Res 2005 65: 6631–6639.
29. Liang G, Bansal G, Xie Z, Druey KM (2009) RGS16 inhibits breast cancer cell growth by mitigating phosphatidylinositol 3-kinase signaling. J Biol Chem 284: 21719–21727.
30. Kim JH, Lee JY, Lee KT, Lee JK, Lee KH, et al. (2010) RGS16 and FosB underexpressed in pancreatic cancer with lymph node metastasis promote tumor progression. Tumour Biol 31: 541–548.
31. Ceder R, Haig Y, Merne M, Hansson A, Zheng X, et al. (2012) Differentiation-promoting culture of competent and noncompetent keratinocytes identifies biomarkers for head and neck cancer. Am J Pathol 180: 457–472.
32. Mok SC, Bonome T, Vathipadiekal V, Bell A, Johnson ME, et al. (2009) A gene signature predictive for outcome in advanced ovarian cancer identifies a survival factor: microfibril-associated glycoprotein 2. Cancer Cell 16: 521–532. 33. Dumont AG, Yang Y, Reynoso D, Katz D, Trent JC, et al. (2012) Anti-tumor
effects of the Notch pathway in gastrointestinal stromal tumors. Carcinogenesis 33: 1674–1683.
34. Albig AR, Becenti DJ, Roy TG, Schiemann WP (2008) Microfibril-associate glycoprotein-2 (MAGP-2) promotes angiogenic cell sprouting by blocking notch signaling in endothelial cells. Microvasc Res 76: 7–14.
35. de Renzis S, So¨nnichsen B, Zerial M (2002) Divalent Rab effectors regulate the sub-compartmental organization and sorting of early endosomes. Nat Cell Biol 4: 124–133.
36. Yan GR, Xu SH, Tan ZL, Liu L, He QY (2011) Global identification of miR-373-regulated genes in breast cancer by quantitative proteomics. Proteomics 11: 912–920.
37. Goebeler V, Poeter M, Zeuschner D, Gerke V, Rescher U (2008) Annexin A8 regulates late endosome organization and function. Mol Biol Cell 19: 5267– 5278.
38. Karanjawala ZE, Illei PB, Ashfaq R, Infante JR, Murphy K, et al. (2008) New markers of pancreatic cancer identified through differential gene expression analyses: claudin 18 and annexin A8. Am J Surg Pathol 32: 188–196. 39. Berthouze M, Venkataramanan V, Li Y, Shenoy SK (2009) The deubiquitinases
USP33 and USP20 coordinate beta2 adrenergic receptor recycling and resensitization. EMBO J 28: 1684–1696.
40. Buus R, Faronato M, Hammond DE, Urbe´ S, Claque MJ (2009) Deubiquitinase activities required for hepatocyte growth factor-induced scattering of epithelial cells. Curr Biol 19: 1463–1466.
41. Lind GE, Danielsen SA, Ahlquist T, Merok MA, Andresen K, et al. (2011) Identification of an epigenetic biomarker with high sensitivity and specificity for colorectal cancer and adenomas. Mol Cancer 10: 85.
42. Wang Y, Yu Q, Cho AH, Rondeau G, Welsh J, et al. (2005) Survey of differentially methylated promoters in prostate cancer cell lines. Neoplasia 7: 748–760.
43. Davidson MR, Larsen JE, Yang IA, Hayward NK, Clarke BE, et al. (2010) MicroRNA-218 is deleted and downregulated in lung squamous cell carcinoma. PloS One 5: e12560.
44. Denk AE, Braig S, Schubert T, Bosserhoff AK (2011) Slit3 inhibits activator protein 1-mediated migration of malignant melanoma cells. Int J Mol Med 28: 721–726.
45. Banerjee S, Dhar G, Haque I, Kambhampati S, Mehta S, et al. (2008) CCN5/ WISP-2 expression in breast adenocarcinoma is associated with less frequent progression of the disease and suppresses the invasive phenotypes of tumor cells. Cancer Res 68: 7606–7612.
46. Davies SR, Davies ML, Sanders A, Parr C, Torkington J, et al. (2010) Differential expression of the CCN family member 1, 2 and WISP-3 in human colorectal cancer and the prognostic implications. Int J Oncol WISP-36: 1129–1136.
47. Haydon RC, Deyrup A, Ishikawa A, Heck R, Jiang W, et al. (2002) Cytoplasmic and/or nuclear accumulation of the beta-catenin protein is a frequent event in human osteosarcoma. Int J Cancer 102: 338–342.
48. Hou CH, Chiang YC, Fong YC, Tang CH (2011) Tang CH. WISP-1 increases MMP-2 expression and cell motility in human chondrosarcoma cells. Biochem Pharmacol 81: 1286–1295.
49. Nagai Y, Watanabe M, Ishikawa S, Karashima R, Kurashige J, et al. (2011) Clinical significance of Wnt-induced secreted protein-1 (WISP-1/CCN4) in esophageal squamous cell carcinoma. Anticancer Res 31: 991–997.
50. Clevers H (2006) Wnt/beta-catenin signaling in development and disease. Cell 127: 469–480.
51. Vijayakumar S, Liu G, Rus IA, Yao S, Chen Y, et al. (2011) High frequency cano nical Wnt activation in multiple sarcoma subtypes drives proliferation through a TCF/b-catenin target gene,CDC25A.Cancer Cell 19: 601–612. 52. Bachet JB, Emile JF (2010) Diagnostic criteria, specific mutations, and genetic
predisposition in gastrointestinal stromal tumors. The Application Of Clinical Genetics 3: 85–101.
53. Jiang S, Li Y, Zhu YH, Wu XQ, Tanq J, et al. (2011) Intensive expression of UNC-51-like kinase 1 is a novel biomarker of poor prognosis in patients with esophageal squamous cell carcinoma. Cancer Sci 102: 1568–1575.
54. Haferlach C, Bacher U, Haferlach T, Dicker F, Alpermann T, et al. (2011) The inv(3)(q21q26)/t(3;3)(q21;q26) is frequently accompanied by alterations of the RUNX1, KRAS and NRAS and NF1 genes and mediates adverse prognosis both in MDS and in AML: a study in 39 cases of MDS or AML. Leukemia 25: 874–877.
55. Lennartsson J, Blume-Jensen P, Hermanson M, Ponte´n E, Carlberg M, et al. (1999) Phosphorylation of Shc by Src family kinases is necessary for stem cell factor receptor/c-kitmediated activation of the Ras/MAP kinase pathway and
c-fosinduction. Oncogene 18: 5546–5553.
56. Masson K, Heiss E, Band H, Ro¨nnstrand L (2006) Direct binding of Cbl to Tyr568and Tyr936of the stem cell factor receptor/c-KIT is required for ligand-induced ubiquination, internalization and degradation. Biochem J 399: 59–67. 57. Price DJ, Rivnay B, Fu Y, Jiang S, Avraham S, et al. (1997) Direct association of
Csk homologous kinase (CHK) with the diphosphorylated site Tyr568/570 of the activated c-KIT in Megakaryocytes. J Biol Chem 272: 5915–5920. 58. Timokhina I, Kissel H, Stella G, Besmer P (1998) Kit signaling through
PI3-kinase and Src PI3-kinase pathways: an essential role for Rac1 and JNK activation in mast cell proliferation. EBMO J 17: 6250–6262.
59. Wollberg P, Lennartsson J, Gottfridsson E, Yoshimura A, Ro¨nnstrand L (2003) The adapter protein APS associates with the multifunctional docking sites Tyr-568 and Tyr-936 in c-Kit. Biochem J 370: 1033–1038.
60. Kozlowski M, Larose L, Lee F, Le DM, Rottapel R, et al. (1998) SHP-1 binds and negatively modulates the c-Kit receptor by interaction with Tyrosine 569 in the c-Kit juxtamembrane domain. Mol Cell Biol 18: 2089–2099.
61. Shivakrupa R, Linnekin D (2005) Lyn contributes to regulation of multiple Kit-dependent signaling pathways in murine bone marrow mast cells. Cell Signal 17: 103–109.
62. Scholl S, Kirsch C, Bo¨hmer FD, Klinger R (2004) Signal transduction of c-Kit receptor tyrosine kinase in CHRF myeloid leukemia cells. J Cancer Res Clin Oncol 130: 711–718.
63. Emile JF, Stock N, Corless CL, Sciot R, Schildhaus HU, et al. (2009) Dotlike or Golgi-like KIT and PDGFRA Staining in GISTs. Am J Surg Pathol 33: 157– 158.