www.hydrol-earth-syst-sci.net/13/1201/2009/ © Author(s) 2009. This work is distributed under the Creative Commons Attribution 3.0 License.
Earth System
Sciences
The significance and lag-time of deep through flow: an example
from a small, ephemeral catchment with contrasting soil types in the
Adelaide Hills, South Australia
E. Bestland1, S. Milgate1, D. Chittleborough2, J. VanLeeuwen3, M. Pichler1, and L. Soloninka1 1Earth Sciences, SoCPES, Flinders University, 5001, South Australia
2School of Earth and Environmental Science, University of Adelaide, South Australia 3School of Natural and Built Environments, University of South Australia, South Australia
Received: 30 January 2009 – Published in Hydrol. Earth Syst. Sci. Discuss.: 24 March 2009 Revised: 7 July 2009 – Accepted: 8 July 2009 – Published: 16 July 2009
Abstract.The importance of deep soil-regolith through flow in a small (3.4 km2) ephemeral catchment in the Adelaide Hills of South Australia was investigated by detailed hy-drochemical analysis of soil water and stream flow during autumn and early winter rains. In this Mediterranean cli-mate with strong summer moisture deficits, several signifi-cant rainfalls are required to generate soil through flow and stream flow [in ephemeral streams]. During autumn 2007, a large (127 mm) drought-breaking rain occurred in April fol-lowed by significant May rains; most of this April and May precipitation occurred prior to the initiation of stream flow in late May. These early events, especially the 127 mm April event, had low stable water isotope values compared with later rains during June and July and average winter precipi-tation. Thus, this large early autumn rain event with low iso-topic values (δ18O,δD) provided an excellent natural tracer. During later June and July rainfall events, daily stream and soil water samples were collected and analysed. Results from major and trace elements, water isotopes (δ18O, δD), and dissolved organic carbon analysis clearly demonstrate that a large component of this early April and May rain was stored and later pushed out of deep soil and regolith zones. This pre-event water was identified in the stream as well as iden-tified in deep soil horizons due to its different isotopic signa-ture which contrasted sharply with the June–July event wa-ter. Based on this data, the soil-regolith hydrologic system for this catchment has been re-thought. The catchment area consists of about 60% sandy and 40% clayey soils. Regolith
Correspondence to:E. Bestland (erick.bestland@flinders.edu.au)
flow in the sandy soil system and not the clayey soil sys-tem is now thought to dominate the deep subsurface flow in this catchment. The clayey texture contrast soils had rapid response to rain events and saturation excess overland flow. The sandy soils had delayed soil through flow and infiltration excess overland flow. A pulse of macropore through flow was observed in the sandy soils three days after the rainfall event largely ended. The macropore water was a mixture of pre-event and pre-event water, demonstrating the lag-time and mix-ing of the water masses in the sandy soil system. By contrast, the clayey soil horizons were not dominated by pre-event wa-ter, demonstrating the quicker response and shallow through flow of the clayey soil system. Thus, the sandy terrain has a greater vadose zone storage and greater lag time of through flow than the clayey terrain.
1 Introduction
South Australia
Scott Creek Catchment
Clayey duplex soils
Sandy siliceous soils
Plateau podzol soils
MC-1 MC-2
SB
1 km
N
Alluvial deposits
Gauging station
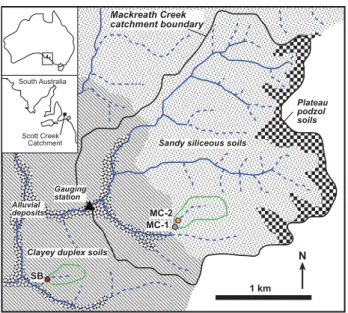
Mackreath Creek catchment boundary
Fig. 1. Location map of the Mackreath Creek catchment showing surface drainages, the distribution of sandy and clayey soils, soil water collection sites (MC1, MC2, SB), and gauging station.
components of stream flow are identified through utilization of techniques and methods of soil and water hydrogeochem-istry (Sklash and Farvolden, 1979, 1982; Kennedy et al., 1986; Land et al., 2000). These studies have highlighted a number of complications that arise in the study of even the most simple catchments: soil and bedrock heterogene-ity, groundwater or baseflow input, seasonal changes to the system in terms of hydrogeochemical (and biogeochemical) inputs, and anthropogenic disturbances such as airborne pol-lutants and agricultural amendments. It is clear that progress toward a comprehensive understanding of the diverse range of catchments requires detailed hydrogeochemical studies of soil, regolith, groundwater, and surface water. The study pre-sented here is based on extensive analysis of soil water, over-land flow, stream water, and precipitation during a moderate sized precipitation event in a small ephemeral catchment in a strongly Mediterranean climate. In this study a catchment was selected that had minimal saturated groundwater inputs which allowed the focus to be on the unsaturated and perched soil and regolith systems.
One complicating parameter in the catchment studies cited above is the presence of permanent groundwater and its con-tribution to stream flow. Thus in such catchments, ground-water input into stream and soil ground-water needs to be separated from unsaturated and perched flow pathways through soil and regolith. Evaluating the groundwater component has led to assumptions about the homogeneity of groundwater as well as assumptions concerning vadose soil water being a negligible source to stream flow (Sklash and Farvolden, 1982). Later studies by McDonnell et al. (1991), McGlynn et al. (2002) and others established the importance of vadose
zone water in stream flow generation, although in the very humid Maimai catchment of New Zealand that they studied, groundwater dominated over soil water.
In the study presented here, a gauged ephemeral stream (Mackreath Creek) of 3.4 km2 catchment area in the Ade-laide Hills of South Australia was investigated with the aim of characterising through flow pathways and identifying their contribution in the resulting stream flow (Fig. 1). In humid climate settings, differentiating flow paths may be important in terms of flood response, soil erosion, contaminant trans-port, and hydropedology (Lin, 2003). These concerns are also valid in the strongly Mediterranean climate of the Ade-laide region. Important in the sub-humid to semi-arid cli-matic setting of much of Australia, with its highly variable rainfall, is the understanding of soil-regolith flow paths. The amount of precipitation necessary to generate deep, sustained soil-regolith through flow is critical to predicting landscape response to climate change. Groundwater recharge estimates also rely on assumptions regarding duration and extent of soil-regolith saturation.
Our original hypothesis regarding the sources and timing of stream flow generation during a precipitation event was based on assumptions of slow Darcian flow in the clayey soil-regolith system compared to more rapid subsurface flow in the sandy soil-regolith system. In this original concep-tual model, macropores were thought to be important in both sandy and clayey systems; however at the hill slope scale macropores would largely be hydraulically disconnected. Thus the overall grainsize distribution of the soil-regolith and its resultant hydraulic properties would determine the rapid-ity of the hydraulic response to precipitation.
2 Background
Mechanisms of stream flow generation in ephemeral streams are dominated by through flow, overland flow, and perched zones of saturated soil and regolith water. Through flow or lateral subsurface flow has been shown to be an im-portant flow pathway in hilly Mediterranean climate catch-ments (Kennedy et al., 1986). In humid settings with thick soils through flow has been shown to be the predominant mechanism of stream flow generation (Pearce et al., 1986; Sklash et al., 1976). In the Adelaide Hills or Mount Lofty Ranges (MLR) of South Australia, Cox et al. (2002) identi-fied through flow to be the most important transport pathway for contaminants during years of average or below average rainfall. Mixing between through flow and overland flow on hill slopes in the MLR has been observed by Chittleborough et al. (1992) to produce similar hydrochemical signatures be-tween flow paths.
matrix generally obtains a signature similar, although dilute, to that of the exchange pool of the soil (Cox et al., 2002), while macropores primarily act as a physical conduit for wa-ter to flow through and consequently the exchange pool has a lesser effect on the chemistry of water (Newman et al., 1998). Down-slope mixing of matrix flow and macropore flow can homogenise the hydrochemistry of these two path-ways (Chittleborough et al., 1992).
An important aspect of tracing flow paths in catchment systems is the evaluation of pre-event water (Pinder and Jones, 1969; Genereux and Hooper, 1998; Buttle, 1998; Brown et al., 1999; Shanley et al., 2002). Such evaluation commonly entails an analysis of the groundwater input into the stream. In an ephemeral system such as Mackreath Creek where the surface water is disconnected from the water table (Fig. 2), an evaluation of pre-event water held in the vadose zone can be made by an analysis of the precipitation, in this case autumn and winter rainfall leading up to the analysed event.
3 Study catchment
The Scott Creek area, which includes the Mackreath Creek study site, experiences a Mediterranean climate with cool moist winters and warm dry summers. Average daily temper-atures range from 14–27◦C in summer to 8–14◦C in winter.
The MLR receives strong seasonal rainfall, with 85% of rain-fall in winter between May and September (BOM, 2007). A yearly rainfall average of 804 mm/yr has been collected at the site (Scott Bottom rainfall collector) at an elevation of 210 m, which has been in operation since 1991 (James-Smith and Harrington, 2002). Evaporation of 1555 mm/yr is measured at the nearest Class A evaporation pan at Mt. Bold; evapora-tion exceeds rainfall from October to May (spring, summer and autumn).
Mackreath Creek is ephemeral with winter flows of a few weeks duration during drought years and 4–6 months dura-tion in average and above average precipitadura-tion years. Flows range from 1.2 l/s–5.8 l/s for winter non-storm flows, 12– 116 l/s for typical winter storm flows, and 232–347 l/s for two year peak flows.
South Australia was in a drought during 2006, with nearly 50% less rainfall than average (BOM, 2007). In 2006, stream flows at Mackreath Creek gauging station lasted only 2 days! In 2006 there was one significant storm event of 40 mm (over 4 days) which produced the only flow in Mackreath Creek, compared to six events of greater than 40 mm in 2005 which caused the creek to flow for four months.
The Mackreath Creek study site is a sub-catchment of Scott Creek Catchment and is typical of MLR catchments having 100–300 m of relief, moderately steep slopes in many areas and narrow riparian-floodplain zones. The study area, as is most of the MLR, is underlain by metamor-phosed late Precambrian sedimentary rocks consisting of
A Horizons
B & C Horizons Sandy Regolith
Clayey Regolith MC 2
MC 1
SB Xanthorea
Sandy Terrain: H i g h i n f i l t r a t i o n r a t e s ; m i n i m a l o v e r l a n d f l o w
C l a y e y T e r r a i n : Low Infiltration rates, sh a l l o w t h r o u g h f l o w a n d o v e r l a n d f l o w
W a t e r T a b l e
seasonal seeps Q u a r t z i t e
B e d r o c k
M e t a - S h a l e B e d r o c k
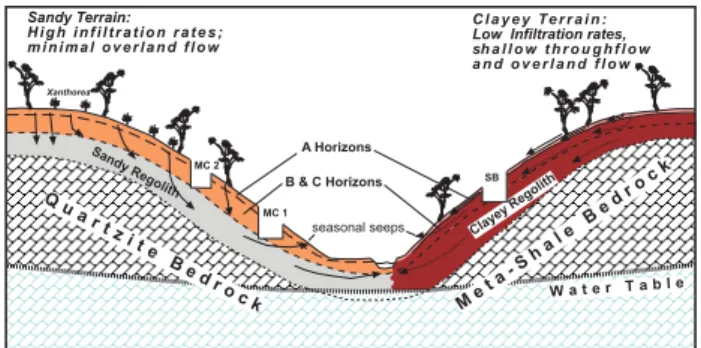
Fig. 2.Schematic cross-section of the Mackreath Creek catchment. The catchment consists of sandy soils over quartzite bedrock and clayey duplex soils over meta-shale bedrock. The sandy soils have high infiltration rates where as the clayey soil system, except for the A horizon, has low infiltration rates.
meta shales, sandstone-quartzite, and minor carbonate units (Priess, 1987). The hydrogeology of the area is that of a fractured rock aquifer (FRA) with large variations in both hydraulic conductivity and groundwater salinity (Barnett et al., 2002; Harrington, 2004a, b). The disconnection be-tween Mackreath Creek surface water and the FRA is demon-strated by the hydraulic head of the FRA at the Mackreath Creek gauging station being lower than the stream bed by 2 to 3 m. At this gauging station there are three piezometers with depths of 16 m, 11 m and 5 m. The logs of these bores have established the fractured rock-regolith boundary at 11 m depth (Fig. 2).
Phase I Phase II Phase III 800
700
600
500
400
300
200
100
0
Flow V
olumn & Salinity (EC)
kL/hr &
m
S/cm
10 minute avg. EC
Hourly avg. flow vol.
2
4
6
8
10 Precipit
ation (mm/hr)
29/6 1/7 3/7 5/7 7/7 9/7 11/7 13/7 15/7 17/7 19/7 21/7 Day/Month
Hourly avg. precipitation
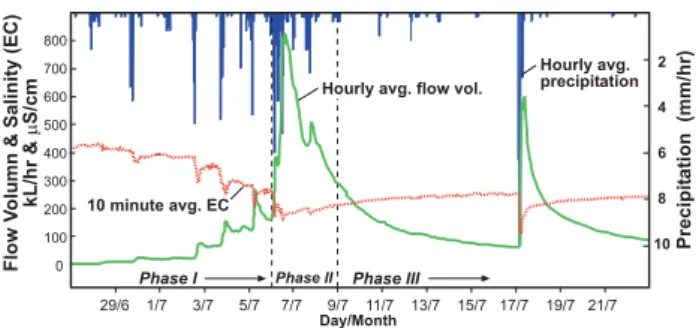
Fig. 3. Hydrograph of stream flow and rainfall of the late June-early July 2007 precipitation event. Electrical conductivity from automatic logger is also shown. Phase I refers to the rising limb of the hydrograph with a duration of about 7 days. Phase II refers to peak precipitation and stream flow with duration of 3 days. Phase III refers to the falling limb and has a duration of 8 days until the precipitation event of 17 June.
and MC2 are positioned to collect water flowing through sandy soil horizons (Fig. 2). Scott Bottom site (SB) repre-sents flow through a texturally contrasting clayey soil. This site is just outside Mackreath Creek sub-catchment and is as-sumed to have soil water and overland flow hydrochemical signatures that are much the same as water flowing through the texture contrast soils at Mackreath Creek. The Scott Bot-tom (SB) site is underlain by the same meta shale geologic formation. Clayey texture contrast soils in Mackreath creek occur on slopes lacking either 0-order catchments or large areas of homogenous meta-shale and clayey texture contrast soil substrate.
Mackreath Creek catchment is predominately comprised of native vegetation; however, substantial human impacts have occurred and consist of land clearance on lower gra-dient slopes with clayey texture contrast soils, a few farm dams, and bulldozed fire tracks on most ridge tops. Native vegetation in this area consists of eucalyptus trees with lesser acacia trees. Most clayey soil sites have been cleared to some extent, and are now being replanted with native trees and shrubs. These areas are presently a mix of thick grass and large eucalyptus trees (up to 30 m) comprising a savannah landscape. Most sandy soil sites have not been cleared and consist of shorter trees (5–10 m) and an understory of shrubs, heath and scattered grasses comprising an open woodland to woodland. Deep sandy soils have areas of bracken fern. Rocky sandy soils have xanthorrhoea (grass trees) and ca-suarinaceae (sheoaks) in addition to eucalypts.
4 Methods
The three soil water collector sites, MC1, MC2, and SB were instrumented with one overland flow collector and two inter-flow collectors. Overland inter-flow collectors consisted of 20 m by 20 cm metal sheeting arranged into a V-shape to funnel
water downhill. The metal sheets were inserted 5cm into the ground surface and were held in place by stakes every 2 m. Polyethylene tubing was attached to the lowest point to chan-nel water down slope and into a 25 L sample container.
To collect soil through flow, three meter deep trenches were dug at each site by a backhoe (long axis of trench was downhill) and access to the trenches was gained from the downhill side. Channels were dug to drain water from each trench. Trenches were covered with plastic tarpaulins to prevent direct contact of rainfall with the side walls of the trench, which could cause erosion and contaminate through flow samples. A low levee of dirt surrounded the upper parts of the trench so that overland flow would be diverted. The face of each trench (uphill side) was instrumented with two fibreglass wick through flow collectors with 0.16 m2area of soil contact at the A/B and B/C horizons.
Soil through flow collectors consist of a 1 m length of fi-breglass wick with 10 cm of frayed wick at one end. This was used to spread across a base plate which acted as a con-tact with soil water. The rest of the wick ran through PVC tubing to an outlet where a 25 L container was connected to collect soil water. Garden weed mat was used to cover the base plate to pre-filter soil water and prevent soil entering the collector. Chiselling and digging tools were used to undercut a 50 by 50 cm cavern in the face of the trench so collectors could be installed. The roof of the undercut was made as flat as possible and soil from the roof of the undercut was mixed with water to create a slurry of soil which was put on top of each collector. Each collector was propped in position using two car jacks and pieces of wood to equalise the force (one on each side of the base plate).
At A and B horizons at MC2 and A horizons at both MC1 and SB, through flow collectors were connected to containers directly by 45 mm holes drilled through the lid of the 25 L containers. High water levels in the trenches at SB and MC1 required tubing to be connected to the PVC piping of the through flow collector and ran out of the trench downhill to a container.
An auto-logger installed in the stream provided a contin-uous record of electrical conductivity (EC) variations. The logged data from the stream was corrected with a hand-held and calibrated EC meter; corrected data is plotted in Figs. 3 and 4. In addition, total dissolved solids (TDS) were calcu-lated from major and trace element analysis by ICP MS (In-ductively Coupled Plasma Mass Spectrometry). A very good correlation ofR2 0.970 was observed between correspond-ing hand held EC measurements (converted to TDS uscorrespond-ing 0.66 EC) and total dissolved solids from ICP MS analyses.
acid (HNO3). Water samples were transferred the same day as sampling and stored in a 30 ml McCartney bottle for water isotope (2H/1H and18O/16O) analysis. Samples were kept cool during transport to prevent evaporation. To prevent ex-change of water vapour with the air, McCartney bottles were completely filled, electrical tape was used to seal the lid of the bottle and samples were stored upside-down until analy-sis.
In total 75 samples were selected for 72 element suite anal-ysis at Acme Analytical Laboratories, Canada, using ICP MS. Stable isotopes of oxygen and hydrogen were analysed at UC Davis Stable Isotope Facility, California using a Los Gatos Research Liquid Water Isotope Analyser. Standards were run every five samples to ensure correct calibration of equipment, which enabled an accuracy of 0.2‰ and 0.6‰ for18O/16O and2H/1H respectively.
5 Results
5.1 Electrical conductivity/salinity
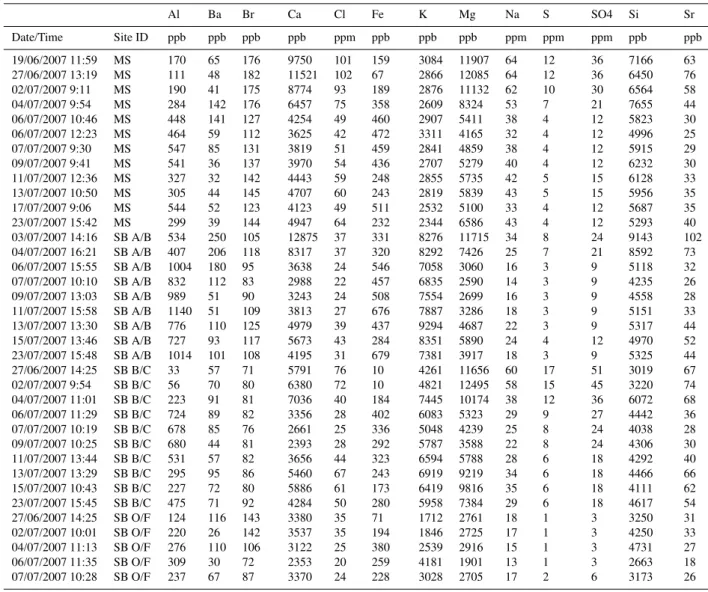
Electrical conductivity measurements were made of Mack-reath Creek at the gauging station, soil horizon through flow, and overland flow before, during and after the precipitation event of late June and early July (2007) (Figs. 3 and 4). This precipitation-stream flow event began approximately on 30 June (2007) with daily showers. These showers increased in frequency over the next 7 days culminating in a rainfall event on 6 July. This build-up of rainfall and rise in stream flow is termed phase I in this study (Fig. 3). The three day peak of stream flow following the rainfall of the 6 is termed phase II. And the falling limb of the hydrograph with a few late showers is phase III; this lasted for 8 days until the next significant precipitation event.
Due to low sample volume in the sandy soils during the lead-up to the precipitation event, and in fact during the first half of the event, EC measurements were not made of these samples; however, major and trace elemental analysis and oxygen and hydrogen isotope analyses were obtained from these low volume samples.
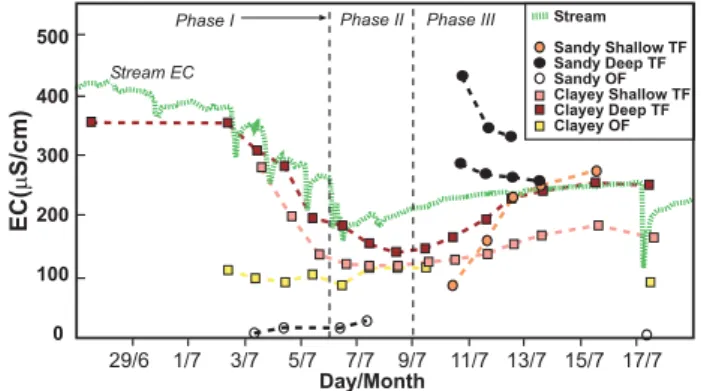
Clayey soil EC measurements show predictable decreases in salinity from B horizon to A horizon and to overland flow (Fig. 4). Overall, the A horizon salinity was 10% lower than the B horizon values. During the beginning of the event, overland flow was 70% lower than B horizon values. How-ever, dilution of soil horizon EC during peak precipitation decreased the difference to about 15%. During the waning stage of the event, overland flow EC reached parity with A horizon values.
An important point to make in regard to the clayey soil water EC values is that most of the stream EC measurements (except during peak flow dilution) are higher in EC (salinity) than temporally corresponding B horizon values. Thus in this small catchment, B horizon water of clayey soils from
grav-500
400
300
200
100
0
EC(
m
S/cm)
29/6 1/7 3/7 5/7 7/7 9/7 11/7 13/7 15/7 17/7
Day/Month
Stream EC
Phase II Phase III
Phase I Stream
Sandy Shallow TF Sandy Deep TF Sandy OF Clayey Shallow TF Clayey Deep TF Clayey OF
Fig. 4.Electrical conductivity of Mackreath Creek (corrected from automatic logger), deep and shallow through flow (TF) from the sandy soil system, deep and shallow through flow from the clayey soil system, and overland flow (OF) from both the clayey and sandy soil systems.
ity collectors and from the mid-slope position sampled, do not have higher EC (salinity) than the majority of the stream flow.
As stated previously, EC measurements for the sandy soil sites were incomplete due to small sample size during phase I and II of the event. Nonetheless, relatively high EC values and decreasing trends were measured for sandy deep through flow during phase III of the event (Fig. 4). Sandy shallow through flow had increasing EC during phase III reaching parity with the deep through flow, probably due to mixing of water masses during the event. Overland flow EC values were very low, the lowest of all the measurements, indicating the low exchange phase reservoir in the A horizon of these sandy soils. Low EC of sandy overland flow is also due to a lack of saturation excess overland flow in these high infiltra-tion sandy soils.
During phase III of the event, through flow water filled the two trenches at the sandy soil site. Through flow water did not fill the clayey trench. This rise in perched soil-regolith water lasted for three days and was a mix of observed macro-pore flow and matrix flow from the B horizon. Sandy soil macropore flow was sampled directly in the up-slope trench site (MC2) as actual macropore flow and included in the deep sandy through flow. The EC values from the perched soil-regolith water were higher than stream EC values, despite the mixing of macropore flow. EC values show dilution trends later during phase III. The perched soil-regolith water was higher in EC than the B horizon macropore flow.
5.2 Elemental concentrations
Table 1.Selected elemental concentrations from ICP analysis.
Al Ba Br Ca Cl Fe K Mg Na S SO4 Si Sr
Date/Time Site ID ppb ppb ppb ppb ppm ppb ppb ppb ppm ppm ppm ppb ppb
19/06/2007 11:59 MS 170 65 176 9750 101 159 3084 11907 64 12 36 7166 63 27/06/2007 13:19 MS 111 48 182 11521 102 67 2866 12085 64 12 36 6450 76 02/07/2007 9:11 MS 190 41 175 8774 93 189 2876 11132 62 10 30 6564 58 04/07/2007 9:54 MS 284 142 176 6457 75 358 2609 8324 53 7 21 7655 44 06/07/2007 10:46 MS 448 141 127 4254 49 460 2907 5411 38 4 12 5823 30 06/07/2007 12:23 MS 464 59 112 3625 42 472 3311 4165 32 4 12 4996 25 07/07/2007 9:30 MS 547 85 131 3819 51 459 2841 4859 38 4 12 5915 29 09/07/2007 9:41 MS 541 36 137 3970 54 436 2707 5279 40 4 12 6232 30 11/07/2007 12:36 MS 327 32 142 4443 59 248 2855 5735 42 5 15 6128 33 13/07/2007 10:50 MS 305 44 145 4707 60 243 2819 5839 43 5 15 5956 35 17/07/2007 9:06 MS 544 52 123 4123 49 511 2532 5100 33 4 12 5687 35 23/07/2007 15:42 MS 299 39 144 4947 64 232 2344 6586 43 4 12 5293 40 03/07/2007 14:16 SB A/B 534 250 105 12875 37 331 8276 11715 34 8 24 9143 102 04/07/2007 16:21 SB A/B 407 206 118 8317 37 320 8292 7426 25 7 21 8592 73 06/07/2007 15:55 SB A/B 1004 180 95 3638 24 546 7058 3060 16 3 9 5118 32 07/07/2007 10:10 SB A/B 832 112 83 2988 22 457 6835 2590 14 3 9 4235 26 09/07/2007 13:03 SB A/B 989 51 90 3243 24 508 7554 2699 16 3 9 4558 28 11/07/2007 15:58 SB A/B 1140 51 109 3813 27 676 7887 3286 18 3 9 5151 33 13/07/2007 13:30 SB A/B 776 110 125 4979 39 437 9294 4687 22 3 9 5317 44 15/07/2007 13:46 SB A/B 727 93 117 5673 43 284 8351 5890 24 4 12 4970 52 23/07/2007 15:48 SB A/B 1014 101 108 4195 31 679 7381 3917 18 3 9 5325 44 27/06/2007 14:25 SB B/C 33 57 71 5791 76 10 4261 11656 60 17 51 3019 67 02/07/2007 9:54 SB B/C 56 70 80 6380 72 10 4821 12495 58 15 45 3220 74 04/07/2007 11:01 SB B/C 223 91 81 7036 40 184 7445 10174 38 12 36 6072 68 06/07/2007 11:29 SB B/C 724 89 82 3356 28 402 6083 5323 29 9 27 4442 36 07/07/2007 10:19 SB B/C 678 85 76 2661 25 336 5048 4239 25 8 24 4038 28 09/07/2007 10:25 SB B/C 680 44 81 2393 28 292 5787 3588 22 8 24 4306 30 11/07/2007 13:44 SB B/C 531 57 82 3656 44 323 6594 5788 28 6 18 4292 40 13/07/2007 13:29 SB B/C 295 95 86 5460 67 243 6919 9219 34 6 18 4466 66 15/07/2007 10:43 SB B/C 227 72 80 5886 61 173 6419 9816 35 6 18 4111 62 23/07/2007 15:45 SB B/C 475 71 92 4284 50 280 5958 7384 29 6 18 4617 54 27/06/2007 14:25 SB O/F 124 116 143 3380 35 71 1712 2761 18 1 3 3250 31 02/07/2007 10:01 SB O/F 220 26 142 3537 35 194 1846 2725 17 1 3 4250 33 04/07/2007 11:13 SB O/F 276 110 106 3122 25 380 2539 2916 15 1 3 4731 27 06/07/2007 11:35 SB O/F 309 30 72 2353 20 259 4181 1901 13 1 3 2663 18 07/07/2007 10:28 SB O/F 237 67 87 3370 24 228 3028 2705 17 2 6 3173 26
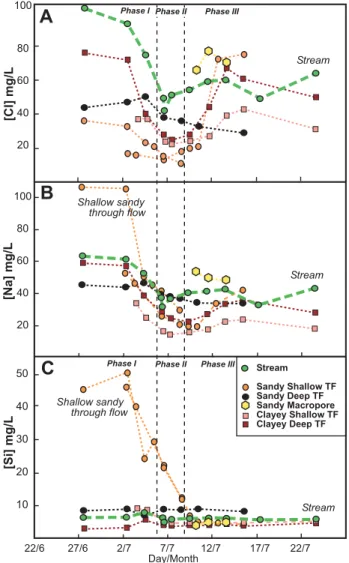
have higher concentrations in the stream than in most of the through flow samples (Fig. 5a, b, Table 1). Clayey soil through flow waters are relatively high in chloride compared to most of the sandy through flow. Sodium and silica con-centrations, however, are higher in most of the sandy through flow than in both the clayey through flow and stream water. For silica, higher concentrations in the sandy through flow in the first half of the event are striking (Fig. 5c). These values in the sandy shallow system through flow are in contrast to much lower values in the sandy deep through flow (site MC2, BC horizon contact).
The relationship between chloride and sodium in through flow and stream flow demonstrates differing water-soil inter-actions between the sandy and clayey systems (Fig. 6a). In addition, the low-flow stream sample (prior to the event) has the highest chloride of any of the water samples (soil and stream); these stream concentrations of conservative
chlo-ride indicate that there is a missing component of the system. There are no known salt deposits in this area of the Mt Lofty Ranges. In order to balance high salinity pre-event stream water, a higher salinity water mass is needed but has not been captured by the sampling in this study. Thus, mass bal-ance attempts with the current data base, using elements such as, silica, calcium, magnesium and potassium, which have many soil water samples with concentrations in excess of the stream values, have resulted in significant negative masses. These mass balance plots and calculations (Milgate, 2007) are not presented here.
Table 1.Continued.
Al Ba Br Ca Cl Fe K Mg Na S SO4 Si Sr
Date/Time Site ID ppb ppb ppb ppb ppm ppb ppb ppb ppm ppm ppm ppb ppb
09/07/2007 10:29 SB O/F 231 27 90 3421 25 205 2989 2659 17 2 6 3067 25 23/07/2007 16:18 SB O/F 435 56 109 4186 29 434 3073 3260 18 2 6 3379 35 02/07/2007 9:41 MC1 A/B 5707 249 71 7427 17 1858 2229 4164 53 3 9 45964 15 03/07/2007 9:41 MC1 A/B 1498 78 78 5992 16 747 2131 3020 47 3 9 40039 13 06/07/2007 11:26 MC1 A/B 3287 101 55 3631 13 1407 1921 2616 26 2 6 22071 8 08/07/2007 11:26 MC1 A/B 2461 100 44 2241 18 995 1952 2199 21 2 6 11891 6 09/07/2007 10:41 MC1 A/B 1654 100 34 1596 20 770 2161 2028 20 2 6 6919 6 10/07/2007 9:30 MC1 A/B 1749 258 37 1625 21 902 2210 2066 19 3 9 5168 11 12/07/2007 14:19 MC1 A/B 287 73 132 2602 72 125 7508 7479 34 4 12 4591 51 15/07/2007 13:50 MC1 A/B 375 135 168 2915 75 165 5487 9684 42 5 15 4429 58 27/06/2007 11:59 MC1 B/C 2117 102 83 3613 44 826 2381 4679 46 10 30 8493 27 02/07/2007 9:51 MC1 B/C 2285 61 85 2913 47 876 2212 4427 44 10 30 8923 26 04/07/2007 10:24 MC1 B/C 390 162 90 3036 50 217 2361 4086 47 13 39 7236 27 06/07/2007 11:36 MC1 B/C 3348 140 80 2465 38 1483 2675 3746 40 10 30 8981 26 08/07/2007 11:36 MC1 B/C 3562 96 80 2028 36 1652 2647 3587 37 10 30 8889 26 10/07/2007 10:30 MC1 B/C 3735 137 79 1731 33 1574 2558 3305 35 10 30 8873 24 15/07/2007 13:58 MC1 B/C 7977 142 77 2172 29 1503 2062 3826 34 12 36 8319 25 27/06/2007 11:59 MC2 B/C 4556 153 198 17703 36 3028 3845 13622 107 5 15 45303 60 02/07/2007 9:59 MC2 B/C 6217 103 202 18872 33 3402 4202 14010 105 4 12 50517 60 04/07/2007 10:34 MC2 B/C 483 217 176 8677 23 835 2092 5616 51 7 21 24437 28 05/07/2007 10:34 MC2 B/C 3763 159 191 7893 21 1881 2258 5536 45 6 18 29471 26 06/07/2007 11:46 MC2 B/C 2790 126 164 6241 15 1335 2230 3971 41 5 15 22240 20 08/07/2007 11:46 MC2 B/C 2073 108 153 3967 11 1122 1863 2831 30 5 15 11781 15
03/07/2007 9:51 MC2 O/F 27 112 7 487 4 31 223 371 2 0.5 1.5 311 6
05/07/2007 10:34 MC2 O/F 18 189 16 766 8 12 133 508 5 0.5 1.5 206 8
06/07/2007 11:04 MC2 O/F 10 67 8 220 3 12 127 265 3 0.5 1.5 90 2
07/07/2007 9:45 MC2 O/F 61 114 23 612 8 38 227 640 6 2 6 353 6
17/07/2007 9:27 MC2 O/F 27 38 <5 223 2 16 63 134 2 0.5 1.5 131 1 10/07/2007 17:07 MC2 DW 329 173 196 2869 64 123 2938 7647 50 3 9 4133 42 11/07/2007 16:05 MC2 DW 475 158 238 2719 79 153 3698 6809 46 4 12 5246 53 13/07/2007 13:34 MC2 DW 342 107 222 2530 68 100 3142 6836 46 3 9 4690 45 17/07/2007 10:26 MC1 DW 432 272 238 3274 78 193 2640 8826 57 6 18 5430 49
29/06/2007 14:25 P 53 6 15 1815 6 44 282 491 2 <1 1.5 125 9
05/07/2007 12:34 P 17 2 16 522 6 14 483 440 3 <1 1.5 41 4
07/07/2007 11:28 P 7 2 53 473 17 <10 440 1317 10 2 6 <40 7
17/07/2007 12:26 P 27 5 11 281 4 <10 132 366 2 1 3 62 2
chloride and higher sodium than clayey system through flow (Fig. 6a). Likewise, silica is much higher in these sandy shallow through flow samples (Fig. 6b). The sandy deep through flow show much the same behaviour as clayey sys-tem through flow samples (Figs. 5 and 6), although it does not have the potassium concentration of the clayey system (Fig. 6b).
5.3 Dissolved organic carbon, aluminium and iron
Dissolved organic carbon analyses were obtained from 34 samples of stream water and selected through flow and over-land flow samples (Table 2, Fig. 7a). The lowest concentra-tions are from sandy soil overland flow (1.7, 2.8 mg/L) and the highest concentration is from clayey soil A horizon from phase I of the event (31.2 mg/L). In Mackreath Creek, the concentrations of DOC, aluminium, and iron all rise and fall
Table 2.Dissolved organic carbon analyses.
Site ID; Date & Time DOC mg/L
MS (stream)
02/07/2007 9:11 13.4
03/07/2007 9:30 17.6
04/07/2007 9:54 22.3
05/07/2007 9:27 25.6
06/07/2007 10:46 25.7
06/07/2007 12:23 25
08/07/2007 8:19 21.8
11/07/2007 12:36 15.5
13/07/2007 10:50 15.2
15/07/2007 9:39 14.8
17/07/2007 9:06 24
SB OF
04/07/2007 11:13 20.6
06/07/2007 15:55 18.1
09/07/2007 13:03 19.4
SB AB
04/07/2007 16:21 31.2
06/07/2007 15:55 24.1
09/07/2007 13:03 22
11/07/2007 15:58 23.6
15/07/2007 13:46 14.2
SB BC
04/07/2007 11:01 22.6
06/07/2007 15:55 16.7
09/07/2007 13:03 13.2
11/07/2007 15:58 13.1
15/07/2007 13:46 11.9
MC1 AB
6/07/2007 9:30 23.1
11/07/2007 16:00 9.8
13/07/2007 13:28 10.2
15/07/2007 13:50 11.9
MC1 BC
15/07/2007 10:00 19.2
MC2 OF
04/07/2007 10:31 4.5
5/07/2007 10:30 2.8
06/07/2007 11:04 1.7
MC2 DW
11/07/2007 16:05 11.9
13/07/2007 13:34 11.3
100
80
60
40
20
22/6 27/6 2/7 7/7 12/7 17/7 22/7 Day/Month
Phase I Phase II Phase III Phase I Phase II Phase III
Stream
Sandy Shallow TF Sandy Deep TF Sandy Macropore Clayey Shallow TF Clayey Deep TF 50
40
30
20
10
[Si] mg/L
100
80
60
40
20
[Na] mg/L
[Cl] mg/L
Stream Stream
Stream Shallow sandy
through flow Shallow sandy through flow
A
B
C
Fig. 5. Time series elemental concentration of(A)chloride, (B)
sodium, and(C)silicon in stream waters and soil water through flow (TF) during the measured event. Note high concentrations of sodium and silicon during phase I. Also note generally higher con-centrations of chloride and sodium in stream water than in soil wa-ter.
5.4 Oxygen and hydrogen isotopes
Isotopes of oxygen (18/16O) and hydrogen (2/1H) were
120
100
80
60
40
20
0
Stream
Sandy Shallow TF Sandy Deep TF Sandy OF
Clayey Shallow TF Clayey Deep TF Clayey OF
Event Precipitation
Shallow sandy through flow Stream
Overland flow
0.0 1.0 2.0 3.0 4.0 5.0 6.0 7.0 8.0 9.0[K] mg/L
50
40
30
20
10
0
[Si] mg/L
Shallow sandy through flow Clayey through flow
Stream Overland
flow
0 20 40 60 80 100[Na] mg/L
[Cl] mg/L
A
B
Fig. 6. Scatter plots of(A)sodium and chloride and(B)silicon and potassium in stream waters, soil water through flow (TF) and overland flow (OF) during the measured event. The sandy shallow through flow is high in silicon and sodium compared to other com-ponents of the system.
in such a system lacking baseflow is difficult. Vadose zone water prior to the event will be a mix of infiltrated rainfall that has been subjected to different degrees of evaporation. In the case studied here, the previous long dry summer and previous drought year caused a massive soil moisture deficit that is difficult to quantify. In April 2007, following this long dry summer and previous winter drought, a large pre-cipitation event of between 130-150mm occurred over four days. Importantly, this large precipitation event had signif-icantly lower oxygen (δ18O of−7.43‰) and hydrogen (δD of−45.5‰) isotopes when compared to more typical winter precipitation events. May 2007 bulk rainfall is more typical of winter rainfall at this elevation in the MLR-Adelaide Hills withδ18O of−5.16‰ andδD of−28.2‰ (Kaylaap, 1999). Low water isotope values during heavy precipitation events result from decreased fractionation between vapour and con-densate as concon-densate fraction increases (Kendall & Doctor, 2007). June 2007 bulk rainfall however has higher isotopic values compared to more typical winter values withδ18O of −2.43‰ andδD of−5.2‰. These contrasting isotope val-ues in the lead up to the precipitation event sampled have produced a natural tracer test. Precipitation event water was sampled at three intervals. The first two samples represent the bulk of the event and have an average isotopic composi-tion ofδ18O of−3.36‰ andδD of−10.65‰. Important to
9.0
8.0
7.0 6.0
5.0
4.0
3.0
2.0
1.0 3.0
2.5
2.0
1.5
1.0
0.5
0.0
[Fe] mg/L
[K] mg/L
0.5
0.4
0.3
0.2
0.1
0.0
[Al & Fe] mg/L
30
25
20
15
10
[DOC] mg/L
5
0
DOC
Al
Fe
Stream
Sandy Shallow TF Sandy Deep TF Sandy Macropore Clayey Shallow TF Clayey Deep TF
27/6 1/7 5/7 9/7 13/7 17/7 21/7 Day/Month
27/6 1/7 5/7 9/7 13/7 17/7 21/7
Phase I Phase II Phase III
A
B
C
Fig. 7. Time series elemental concentrations of iron, aluminum, potassium, and dissolved organic matter in Mackreath Stream(A), and in soil water through flow (TF) (BandC).
note for the time series of oxygen isotopes (Fig. 8) and hy-drogen isotopes (not shown) is that the third sample is con-siderably lower compared to the first two (δ18O of -4.98 and
Stream Stream
-3.00
-4.00
-5.00
-6.00 -3.00
-4.00
-5.00
-6.00
Clayey Soils
Sandy Soils
17/6 22/6 27/6 02/7 07/7 12/7 17/7 22/7
Day/Month
d
18
O
d
18
O
Phase I Phase II Phase III
A
B
Stream
Clayey Shallow TF Clayey Deep TF Clayey OF
Precipitation
Stream
Sandy Shallow TF Sandy Deep TF Sandy OF
Precipitation
δ δ
Fig. 8. Times series of oxygen isotopes from clayey soils(A)and sandy soils(B)compared to stream water (TF – through flow; OF – overland flow). Sandy deep through flow has lowerδ18O andδD values. The first two precipitation samples record the vast majority of the event; last sample was of late showers.
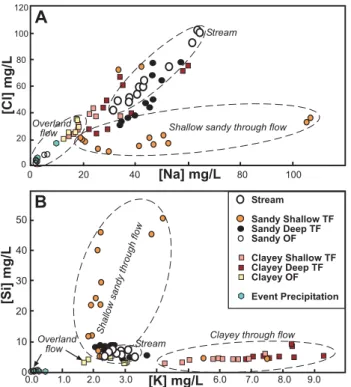
to the influx of higher isotopic values of the event water during phase I. However, during phase III, shallow soil wa-ter collectors from both sandy and clayey sites show a de-crease in isotopic values that is well below the first two event precipitation sample values. Clearly pre-event water that is lower in isotopic value compared to event water mixed into the through flow. Deep through flow collectors in both the clayey and sandy systems show dilution and an increase in isotopic values by event water during phase I followed by a decrease in isotopic values during phase III, again indicating mixing of pre-event water in the through flow system. This decrease in isotopic values in the through flow during phase III is most likely not due to the small volume of water from the late showers which have relatively low isotopic values.
The sandy deep through flow waters are noteworthy for the following reasons: 1) isotopic values are lower than the stream, 2) a depletion trend occurs from phase I to II, similar to the stream, 3) isotopic values do not show any significant increase in isotopic value during the event, indicating mini-mal mixing of event water with pre-event water.
The isotopic values of the various components of this sys-tem (sandy deep through flow, sandy shallow through flow, clayey through flow, event precipitation, and monthly bulked rainfall) are well illustrated by graphingδ18O andδD of both the averages of the different components of the system and individual data points (Fig. 9). The bulked rainfall samples of April, May, and June 2007 have a large range of values as has
Stream Avg.
May Bulked Precip.
June Bulked Precip.
April Bulked Precip. Sandy Deep TF Avg.
Sandy Shallow TF Avg. Clayey TF Avg.
Event Precip. Avg.
Stream Sandy Shallow TF Sandy Deep TF
Clayey TF, Shallow & Deep Event Precipitation
-8 -7 -6 -5 -4 -3 -2
-10
-20
-30
-40
-50
d
2 D
L M W L
d18O
δ δ
Fig. 9.Averaged isotopic composition (δD versusδ18O) of bulked monthly precipitation (April, May, and June, 2007), clayey soil through flow (TF) from both A and B horizons horizon (12 sam-ples), shallow sandy through flow (9 samsam-ples), and deep sand
through flow (7 samples). Volume averaged event
precipita-tion is also shown. Local meteoric water line (LMWL) from
Kayaalp (1999).
been described above. The low isotopic value of the sandy deep through flow and Mackreath Creek are obvious when compared to the event precipitation and other soil through flow samples and averages.
6 Discussion
Despite the best efforts of our event sampling, it is clear that the sampling program at Mackreath Creek was incomplete in terms of capturing all significant soil-regolith flow paths. There are important findings from the present study that are directing on-going research. Down-slope change in soil wa-ter due to increased residence time within the soil was largely undocumented in the present study but which is presently be-ing investigated. Emergent flow paths in lower slope settbe-ings as demonstrated by seasonal seeps present in the area were analysed at a reconnaissance level with field based measure-ments. It is clear from the range of elemental concentrations that large variations in soil water hydrochemistry are present and that some of these variations are not explained by event water dilution. Nonetheless, a number of interpretations can be made from the data collected.
Table 3.Stable isotopes of oxygen and hydrogen.
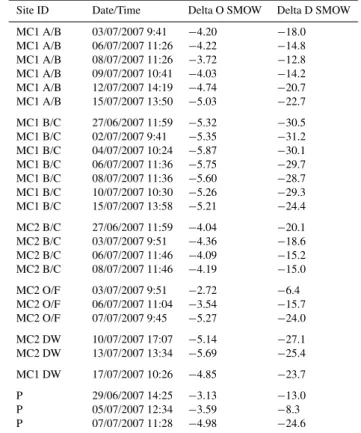
Site ID Date/Time Delta O SMOW Delta D SMOW
MS 19/06/2007 11:59 −5.04 −28.1
MS 27/06/2007 13:19 −4.87 −27.3
MS 02/07/2007 9:11 −5.16 −28.4
MS 04/07/2007 9:54 −5.38 −25.7
MS 06/07/2007 10:46 −5.08 −21.5
MS 06/07/2007 12:23 −4.99 −21.3
MS 07/07/2007 9:30 −4.45 −22.2
MS 09/07/2007 9:41 −4.93 −25.1
MS 11/07/2007 12:36 −5.15 −25.4
MS 15/07/2007 9:39 −4.86 −23.7
MS 17/07/2007 9:06 −5.02 −22.8
SB A/B 03/07/2007 14:16 −3.79 −13.6
SB A/B 06/07/2007 15:55 −4.09 −17.5
SB A/B 07/07/2007 10:10 −3.59 −18.2
SB A/B 09/07/2007 13:03 −4.64 −20.6
SB A/B 15/07/2007 13:46 −4.37 −19.0
SB B/C 27/06/2007 14:25 −4.23 −18.9
SB B/C 02/07/2007 9:54 −4.18 −18.6
SB B/C 05/07/2007 10:15 −4.41 −16.4
SB B/C 06/07/2007 11:29 −3.87 −16.1
SB B/C 07/07/2007 10:19 −3.52 −17.5
SB B/C 10/07/2007 10:02 −4.42 −20.3
SB B/C 13/07/2007 13:29 −4.70 −18.5
SB B/C 17/07/2007 9:52 −4.16 −19.4
SB O/F 02/07/2007 10:01 −4.71 −22.0
SB O/F 04/07/2007 11:13 −4.55 −17.1
SB O/F 06/07/2007 11:35 −4.03 −16.5
SB O/F 08/07/2007 9:20 −4.12 −18.3
The clayey soil system has clear dilution trends between event water and pre-event soil water. The pre-event soil wa-ter in the clayey soil horizons is closer to equilibrium with the soil exchange pool as demonstrated by higher concentra-tions of most elements in the clayey B horizon compared to A horizon and overland flow. Potassium is the notable excep-tion in which the A horizon concentraexcep-tions are higher than the clayey B horizon. Trends in potassium concentrations in these samples corresponds to DOC concentrations in terms of increases and decreases over time (Milgate, 2007) and most likely reflects release and transport of potassium as organic matter decomposes into DOC. High transient potassium con-centration is a typical pattern in forest soils in which rapid release of potassium from decomposing litter commonly ex-ceeds the capacity of the soil to retain it (Laskowski et al., 1995; Chang et al., 2007). Potassium may also be contained in colloidal sized plant material as was reported by Eyrolle et al. (1996).
The concentration peaks of DOC, iron and aluminium in the stream water during the event, as described above, are not in sync by two to three days. Thus, it appears that iron and aluminium are de-coupled from dissolved organic mat-ter, contrary to long-standing work showing these elements are closely linked to DOC and organic colloids (Perdue et al., 1976; Johnson et al., 1981; Tipping, 1981). Organic com-plex transport of iron and aluminium is especially noted in
Table 3.Continued.
Site ID Date/Time Delta O SMOW Delta D SMOW
MC1 A/B 03/07/2007 9:41 −4.20 −18.0
MC1 A/B 06/07/2007 11:26 −4.22 −14.8
MC1 A/B 08/07/2007 11:26 −3.72 −12.8
MC1 A/B 09/07/2007 10:41 −4.03 −14.2
MC1 A/B 12/07/2007 14:19 −4.74 −20.7
MC1 A/B 15/07/2007 13:50 −5.03 −22.7
MC1 B/C 27/06/2007 11:59 −5.32 −30.5
MC1 B/C 02/07/2007 9:41 −5.35 −31.2
MC1 B/C 04/07/2007 10:24 −5.87 −30.1
MC1 B/C 06/07/2007 11:36 −5.75 −29.7
MC1 B/C 08/07/2007 11:36 −5.60 −28.7
MC1 B/C 10/07/2007 10:30 −5.26 −29.3
MC1 B/C 15/07/2007 13:58 −5.21 −24.4
MC2 B/C 27/06/2007 11:59 −4.04 −20.1
MC2 B/C 03/07/2007 9:51 −4.36 −18.6
MC2 B/C 06/07/2007 11:46 −4.09 −15.2
MC2 B/C 08/07/2007 11:46 −4.19 −15.0
MC2 O/F 03/07/2007 9:51 −2.72 −6.4
MC2 O/F 06/07/2007 11:04 −3.54 −15.7
MC2 O/F 07/07/2007 9:45 −5.27 −24.0
MC2 DW 10/07/2007 17:07 −5.14 −27.1
MC2 DW 13/07/2007 13:34 −5.69 −25.4
MC1 DW 17/07/2007 10:26 −4.85 −23.7
P 29/06/2007 14:25 −3.13 −13.0
P 05/07/2007 12:34 −3.59 −8.3
P 07/07/2007 11:28 −4.98 −24.6
tropical settings (Gu et al., 1995; Depr´e et al., 1999). In-stead, due to a combination of the shift in the timing of the concentrations peaks of DOC, iron and aluminium and the lack of correlation between DOC and elevated iron and alu-minium concentrations in the through flow waters, colloidal iron oxyhydroxides and clay minerals flushed from some soil horizons may be a more likely explanation. Another possible source of colloids could be remobilised sediment from creek beds; however, in 2007 the previous flow of similar volume occurred two years prior, thus remobilisation is unlikely.
horizon samples were deficient in fine-grained colloids, pre-sumably due to translocation of these colloids through the soil profile.
The sandy shallow soil system through flow has elevated concentrations of silica and sodium, compared to the stream and clayey soil system. Mineral weathering (silicate hydrol-ysis) and release of silica and sodium and to a lesser extent calcium from quartz and feldspar is most likely the domi-nant factor controlling the high concentrations of these ele-ments in the sandy soil through flow. This mineral weath-ering is most likely the cause of the distinct hydrochemical trends evident for the sandy shallow through flow when com-pared to the stream water and clayey soil water (Fig. 6). The highest concentrations of silica, sodium, and calcium come from flushing of sandy A and B horizons during phase I of the event (Fig. 5). Weathering of silicate material, both from in situ soil and from dust, in the presence of soil acids and higher moister contents of the A horizon is probably the cause of these elevated concentrations.
Another factor that could explain the differing elemental concentrations in the various through flow samples is the res-idence time of soil water in the soil-regolith system. Longer residence time is indicated for the sandy deep through flow system by the dominance of pre-event water in this flow path as deduced from oxygen and hydrogen isotopes. The lowest
δ18O andδD water, and therefore the water that is the most strongly influence by pre-event water (sandy deep through flow; MC1-BC) has consistent hydrochemical trends for the seven isotopic and most elemental samples analysed. The narrow range of values for MC1-BC is intermediate between the high silica and sodium sandy shallow through flow wa-ters and the clayey through flow wawa-ters in terms of most el-emental concentrations (Fig. 6). Thus, although MC1-BC demonstrates the best case for longer residence time based on the presence of pre-event water, this flow path does not show elevated concentrations of silica, sodium, and calcium that would be expected from prolonged water-mineral inter-actions. However, MC1-BC does show very substantial in-creases in iron and aluminium during the second half of the event (Fig. 7), which is interpreted as a result of mixing of early (flushed) event water with pre-event water.
A through flow pulse of macropore water was identified in the sandy soil system based on field observations of trenches filling with water and active macropore flow. Samples of this through flow pulse have elevated chloride, sodium, magne-sium, and potassium concentrations but relatively lower sil-ica, iron and aluminium concentrations (Figs. 5 and 7, Mg and Al not shown). Thus, a possible scenario is that this pulse flushed dissolved solids from deep in the soil-regolith profile. Why this water was not elevated in silica, from sil-icate mineral hydrolysis, is not known. One possibility is that the pre-event water from the April event may have in-filtrated the soil without extensive flushing of exchangeable constituents due to the very dry nature of the landscape prior to this precipitation event.
A possible model to explain hydrochemical data is as fol-lows. Infiltration in the sandy soil system prior to the mea-sured event accumulates in the regolith above the bedrock-regolith boundary. This pre-event water has low values of
18O and 2H isotopes obtained from the large April event
and to a lesser degree from May precipitation. When com-pared to later through flow from the sandy soil system, this pre-event water is not exceedingly high in dissolved con-stituents. High concentrations of silica, iron, and aluminium, and other mineral-oxide related elements appear to originate from event flushing of sandy soil A and B horizons during phase I.
The clayey soil system by contrast has lower concentra-tions of18O and2H isotopes, especially early in the event (phase I). This demonstrates the higher saturation and shorter residence time of water in the clayey soil A and B hori-zons. That the B horizon has a lowering of isotopic val-ues as the event progresses, indicating that water, probably from deeper in the regolith and dominated by pre-event wa-ter (from April and May), was pushed out and subsequently mixed with higher isotopic ratio surface event water.
7 Conclusions
The small ephemeral Mackreath Creek catchment has a com-plicated hydraulic and hydrochemical response to winter pre-cipitation events. Following a long dry summer and a preced-ing drought year (2006), this hilly catchment did not generate stream flows until over 200 mm of precipitation fell during late autumn rains. This autumn drought breaking precipita-tion in April 2007 acted as a natural tracer test due to its low
δ18O andδD isotopic composition when compared to aver-age winter rains and later rains in May and June. Most of this April precipitation flowed through the clayey soil system and was replaced by water from the May and June events by the time the late June–early July event occurred. By contrast, the sandy soil system apparently stored a significant portion of this water which was then displaced by event water. This displacement caused the stream water during the event to be dominated by this pre-event water, although the clayey soil system was largely dominated by event water.
Soil water flow pathways (and overland flow) before, dur-ing and after the event have distinctive hydrochemical char-acteristics. The clayey soil system is predictable in that it ex-hibits dilution by event water and increase in concentrations of most elements from overland flow to the A horizons and to the B horizon. Potassium is the exception which is highest in the A horizon, most likely due to higher amounts of or-ganic matter and its decomposition and release of potassium. Overland flow from the sandy soil system has the lowest el-emental concentrations; this is due to high infiltration rates and lack of saturation excess overland flow.
Deep through flow in the sandy system was identified mainly on the basis of oxygen and hydrogen isotopes. Strongly contrasting oxygen and hydrogen isotopes of au-tumn and early winter precipitation combined with a severe soil moisture deficit prior to detailed measurement created a natural tracer experiment.
Acknowledgements. This project was funded by Flinders
Uni-versity Program Grant (2006–2009), and South Australia Water Corporation grant. Access to field sites was provided by SA Water and Department of Parks and Wildlife, SA.
Edited by: J. Seibert
References
Aberg, G., Jacks, G., and Hamilton, P. J.: Weathering rates and 87Sr/86Sr ratios: an isotopic approach, J. Hydrol., 109, 65–78, 1989.
Barnett, S. R., van den Akker, J., and Zulfic, D.: Mount Lofty Ranges Groundwater Assessment, Upper Onkaparinga Catch-ment, S. Aust. Dept. Water, Land and Biodiversity Conservation, Report, DWLBC 2002/29, 2002.
Brown, V. A., McDonnell, J. J., Burns, D. A., and Kendall, C.: The role of event water, a rapid shallow flow component, and
catchment size in a summer stormflow, J. Hydrol., 217, 171–190, 1999.
Buffle, J. and Van Leeuwen, H. P.: Environmental particles: 1. In Environmental Analytical and Physical Chemistry Series, Lewis Publishers, London, p. 554, 1992.
Bureau of Meteorology: Climate Statistics for Australian sites, on-line available: www.bom.gov.au, 2007.
Buttle, J. M.: Fundamentals of small catchment hydrology, In: Iso-tope Tracers in Catchment Hydrology, edited by: Kendall. C. and McDonnell, J. J., Elsevier, Amsterdam, 1–49, 1998.
Chang, S.-C., Wang, C.-P., Feng, C-M., Rainer Rees, R., Hell, U., and Matzner, E.: Soil fluxes of mineral elements and dissolved organic matter following manipulation of leaf litter input in a TaiwanChamaecyparisforest, Forest Ecol. Manag., 242, 133– 141, 2007.
Chittleborough, D. J., Smettem, K. R. J., Costaris, E., and Leaney, F. W.: Seasonal Changes in Pathways of Dissolved Organic Car-bon through a Hillslope Soil (Xeralf) with Contrasting Texture, Australian J. Soil Res., 30, 465–476, 1992.
Cox, J. W., Chittleborough, D. J., Brown, H. J., Pitman, A., and Varcoe, J. C. R.: Seasonal changes in hydrochemistry along a toposequence of texture-contrast soils, Australian J. Soil Res., 40, 581–604, 2002.
Dupr´e, B., Viers, J., Dandurand, J. L., Polv´e, M., B´en´ezeth, P., Vervier, P., and Braun, J. J.: Major and trace elements associ-ated with colloids in organic-rich river waters: ultrafiltration of natural and spiked solutions, Chem. Geol., 160, 63–80, 1999. Edmond, J. M., Palmer, M. R., Measures, C. I., Grant, B., and
Stallard, R. F.: The fluvial geochemistry and denudation rate of the Guayana Shield in Venezuela, Colombia and Brazil, Geochim.Cosmochim. Acta, 59, 3301–3325, 1995.
Eyrolle, F., Benedetti, M. F., Benaim, J.-Y., and Fevrier, D.: The distributions of colloidal and dissolved organic carbon, ma-jor elements and trace elements in small tropical catchments, Geochim. Cosmochim. Acta, 60, 3643–3656, 1996.
Genereux, D. P. and Hooper, R. P.: Oxygen and hydrogen isotopes in rainfall-runoff studies, in: Isotope Tracers in Catchment Hy-drology, edited by: Kendall, C. and McDonnell, J. J., Elsevier, Amsterdam, 319–346, 1998.
Gu, B., Schmitt, J., Chen, Z., Liang, L., and McCarthy, J. F.: Ad-sorption and deAd-sorption of different organic matter fractions on iron oxide, Geochim. Cosmochim. Acta, 59, 219–229, 1995. Harrington, G.: Hydrogeological Investigation of the Mount Lofty
Ranges, Progress Report 3: Borehole water and formation char-acteristics at the Scott Bottom research site, Scott Creek Catch-ment, Department of Water, Land and Biodiversity Conservation, Report DWLBC Adelaide Australia, 2004/03, 2004a.
Harrington, G.: Hydrogeological Investigation of the Mount Lofty Ranges, Progress Report 4: Groundwater – surface water inter-actions in the Scott Creek, Marne River and Tookayerta Creek Catchments, Department of Water, Land and Biodiversity Con-servation, Report DWLBC, Adelaide Australia, 2004/11, 2004b. James-Smith, J. M. and Harrington, G. A.: Hydrogeological In-vestigation of the Mount Lofty Ranges, Progress Report 1: hy-drogeology and drilling phase 1 for Scott Creek Catchment, De-partment of Water, Land and Biodiversity Conservation, Report DWLBC Adelaide Australia, 2002/17, 2002.
chemi-cal weathering at the Hubbard Brook Experimental Forest, New Hampshire, Geochim. Cosmoshim. Acta, 45, 1421–1437, 1981. Kayaalp, A. S.: Application of rainfall chemistry and isotope data in
hydrometeorological modelling, PhD Thesis, Flinders University of South Australia, 1999.
Kendall, C. and Doctor, D. H.: Stable isotope applications in hydro-logic studies; in Treatise on Geochemistry, Elsevier, Netherlands, 319–364, 2007.
Kennedy, V. C., Kendall, C., Zellweger, G. W., Wyerman, T. A., and Avanzino, R. J.: Determination of the components of stormflow using water chemistry and environmental isotopes, Mattole river basin, California, J. Hydrol., 84, 107–140, 1986.
Kump, L. R., Brantley, S. L., and Arthur, M. A.: Chemical weather-ing, atmospheric CO2and climate, Annual Reviews Earth Plan-etary Science, 28, 611–667, 2000.
Land, M., Ingri, J., Andersson, P. S., and Ohlander, B.: Ba/Sr, Ca/Sr and87Sr/86Sr ratios in soil water and groundwater: im-plications for relative contributions to stream water discharge, Appl. Geochem., 15, 311–325, 2000.
Laskowski, R., Berg, B., Johansson, M. B., and McClaugherty, C.: Release pattern for potassium from decomposing forest needle and leaf litter, Long term decomposition in a Scots pine forest , Canadian J. Botany, 73, 2019–2027, 1995.
Leaney, F. W., Smettem, K. R. J., and Chittleborough, D. J.: Esti-mating the contribution of preferential flow to subsurface runoff from a hillslope using deuterium and chloride, J. Hydrol., 143, 83–103, 1993.
Likens, G. E., Bormann, F. H., Pierce, R. S., Eaton, J. S., and John-son, N. M.: Biogeochemistry of a Forested Ecosystem, Springer, New York, 1977.
Likens, G. E., Driscoll, C. T., and Buso, D. C.: Long-term effects of acid rain: response and recovery of a forested ecosystem, Sci-ence, 272, 244–246, 1996.
Lin, H.: Hydropedology: Bridging Disciplines, scales and data, Va-dose Zone J., 2, 1–11, 2003.
McDonnell, J. J., Stewart, M. K., and Owens, I. F.: Efferts of catchment-scale subsurface watershed on stream isotopic re-sponse, Water Resour. Res., 26, 3065–3073, 1991.
McGlynn, B. L., McDonnel, J. J., and Brammer, D. D.: A review of the evolving perceptual model of hillslope flowpaths at the Maimai catchments, New Zealand, J. Hydrol., 257, 1–26, 2002. Milgate, S. A.: Hydrochemical investigation of flow pathways
through quartz-sand and duplex soils during a storm event: Mackreath Creek, Mount Lofty Ranges, Unpublished honours thesis, Flinders University of South Australia, Adelaide Aus-tralia, p. 50, 2007.
Newman, B. D., Campbell, A. R., and Wilcox, B. P.: Lateral subsur-face flow pathways in a semiarid ponderosa pine hillslope, Water Resour. Res., 34, 3485–3496, 1998.
Pearce, A. J., Stewart, M. K., and Sklash, M. G.: Storm runoff in humid headwater catchments 1. Where does the water come from?, Water Resour. Res., 22, 1263–1272, 1986.
Perdue, E. M., Beck, K. C., and Reuter, J. H.: Organic complexes of iron and aluminium in natural waters, Nature, 260, 418–420, 1976.
Pinder, G. F. and Jones, J. F.: Determination of the ground-water component of peak discharge from the chemistry of total runoff, Water Resour. Res., 5, 438–445, 1969.
Pokrovski, O. S. and Schott, J.: Iron colloids/organic matter associ-ated transport of major and trace elements in small boreal rivers and their estuaries (NW Russia), Chem. Geol., 190, 141–181, 2002.
Preiss, W. V.: The Adelaide Geosyncline: Late proterozoic stratig-raphy, sedimentation, palaeontology and tectonics, Bull. Geol. Surv. S. Australia, 53, p. 439, 1987.
Probst, A., Dambrine, E., Viville, D., and Fritz, B.: Influence of acid atmospheric inputs on surface water chemistry and mineral fluxes in a declining spruce stand within a small granitic catch-ment (Vosges massif, France), J. Hydrol., 116, 101–124, 1990. Ranville, J. F., Chittleborough, D. J., and Beckett, R.: Particle-Size
and Element Distributions of Soil Colloids: Implications for Col-loid Transport, Soil Science Soc. Amer. J., 69, 1173–1184, 2005. Shand, P., Darbyshire, D. P. F., Gooddy, D., and Haria, A. H.: 87Sr/86Sr as an indicator of flowpaths and weathering rates in the Plynlimon experimental catchments, Wales, UK, Chem. Geol., 236, 247–265, 2007.
Shanley, J. B., Kendall, C., Smith, T. E., Wolock, D. M., and Mc-Donnell, J. J.: Controls on old and new water contributions to stream flow at some nested catchments in Vermont, USA, Hy-drol. Processes, 16, 589–609, 2002.
Sklash, M. G. and Farvolden, R. N.: The role of ground water in storm runoff, J. Hydrol., 43, 45–65, 1979.
Sklash, M. G. and Farvolden, R. N.: The use of environmental iso-topes in the study of high-runoff episodes in streams, in: Isotope Studies of Hydrologic Processes, edited by: Perry Jr., E. C. and Montgomery, C. W., Northern Illinois University Press, DeKalb, Illinois, 65–73, 1982.
Sklash, M. G., Farvolden, R. N., and Fritz, P.: A conceptual model of watershed response to rainfall, developed through the use of oxygen-18 as a natural tracer, Can. J. Earth Sci., 13, 271–283, 1976.
Smettem, K. R. J., Chittleborough, J. J., Richards, B. G., and Leaney, F. W.: The influence of macropores on runoff genera-tion from a hillslope with a contrasting textural class, J. Hydrol., 122, 235–252, 1991.
Stevens, D. P., Cox, J. W., and Chittleborough, D. J.: Pathways of phosphorous, nitrogen, and carbon movement over and through texturally differentiated soils, South Australia, Australian J. Soil Res., 37, 679–693, 1999.
Stumm, W.: Aquatic colloids as chemical reactants: surface struc-ture and reactivity, Coll. Surf., A73, 1–18, 1993.
Taylor, J. K., Thomson, B. P., and Shepherd, R. G.: The soils and geology of the Adelaide Area, Bulletin 46 Geol. Survey S. Aust., p. 85, 1974.