ACPD
12, 14551–14589, 2012Complex refractive index of toluene-SOA
T. Nakayama et al.
Title Page
Abstract Introduction
Conclusions References
Tables Figures
◭ ◮
◭ ◮
Back Close
Full Screen / Esc
Printer-friendly Version Interactive Discussion
Discussion
P
a
per
|
Dis
cussion
P
a
per
|
Discussion
P
a
per
|
Discussio
n
P
a
per
|
Atmos. Chem. Phys. Discuss., 12, 14551–14589, 2012 www.atmos-chem-phys-discuss.net/12/14551/2012/ doi:10.5194/acpd-12-14551-2012
© Author(s) 2012. CC Attribution 3.0 License.
Atmospheric Chemistry and Physics Discussions
This discussion paper is/has been under review for the journal Atmospheric Chemistry and Physics (ACP). Please refer to the corresponding final paper in ACP if available.
Wavelength and NO
x
dependent complex
refractive index of SOAs generated from
the photooxidation of toluene
T. Nakayama1, K. Sato2, Y. Matsumi1, T. Imamura2, A. Yamazaki3, and A. Uchiyama3
1
Solar-Terrestrial Environment Laboratory and Graduate School of Science, Nagoya University, Furo-cho, Chikusa-ku, Nagoya 464-8601, Japan
2
National Institute for Environmental Studies, 16-2, Onogawa, Tsukuba 305-8506, Japan
3
Meteorological Research Institute, Japan Meteorological Agency, 1-1, Nagamine, Tsukuba 305-0052, Japan
Received: 6 April 2012 – Accepted: 23 May 2012 – Published: 8 June 2012 Correspondence to: T. Nakayama ([email protected])
ACPD
12, 14551–14589, 2012Complex refractive index of toluene-SOA
T. Nakayama et al.
Title Page
Abstract Introduction
Conclusions References
Tables Figures
◭ ◮
◭ ◮
Back Close
Full Screen / Esc
Printer-friendly Version Interactive Discussion
Discussion
P
a
per
|
Dis
cussion
P
a
per
|
Discussion
P
a
per
|
Discussio
n
P
a
per
|
Abstract
Recently, secondary organic aerosols (SOAs) generated from anthropogenic volatile organic compounds have been proposed as a possible source of lightabsorbing or-ganic compounds “brown carbon” in the urban atmosphere. However, the atmospheric importance of these SOAs remains unclear due to limited information about their opti-5
cal properties. In this study, the complex refractive index (RI,m=n−ki) values at 405, 532, and 781 nm of the SOAs generated during the photooxidation of toluene (toluene-SOAs) under a variety of initial nitrogen oxide (NOx=NO+NO2) conditions were exam-ined by photoacoustic spectroscopy (PAS) and cavity ring down spectroscopy (CRDS). The complex RI values obtained in the present study and reported in the literature 10
indicate that the k value, which represents the light absorption of the toluene-SOAs steeply increased to shorter wavelengths at<405 nm, while then value gradually in-creased to shorter wavelengths from 781 to 355 nm. The k values at 405 nm were found to increase from 1.8×10⁻³ to 7.2×10⁻³ with increasing initial NOx concentra-tion from 109 to 571 ppbv. The nitrate to organics ratio of the SOAs determined using 15
a highresolution time-of-flight aerosol mass spectrometer (H-ToF-AMS) also increased with increasing initial NOx concentration. The RI values of the SOAs generated dur-ing the photooxidation of 1,3,5-trimethylbenzene in the presence of NOx (1,3,5-TMB-SOAs) were also determined to investigate the influence of the chemical structure of the precursor on the optical properties of the SOAs, and it was found that the light 20
absorption of the 1,3,5-TMB-SOAs is negligible at all of the wavelengths investigated (405, 532, and 781 nm). These results can be reasonably explained by the hypothesis that nitro-aromatic compounds such as nitro-cresols are the major contributors to the light absorption of the toluene-SOAs. Using the obtained RI values, mass absorption cross sections of the toluene-SOAs at 405 and 532 nm were estimated to be 0.08–0.48 25
ACPD
12, 14551–14589, 2012Complex refractive index of toluene-SOA
T. Nakayama et al.
Title Page
Abstract Introduction
Conclusions References
Tables Figures
◭ ◮
◭ ◮
Back Close
Full Screen / Esc
Printer-friendly Version Interactive Discussion
Discussion
P
a
per
|
Dis
cussion
P
a
per
|
Discussion
P
a
per
|
Discussio
n
P
a
per
|
specifically when the mass concentrations of the anthropogenic SOAs are significant compared with those of black carbon particles.
1 Introduction
Atmospheric aerosol plays an important role in determining the visibility, health ef-fects, heterogeneous chemistry, and radiation balance of the atmosphere on a local 5
and a global scale (Seinfeld and Pandis, 2006; Finlayson-Pitts and Pitts, 2000). Re-cently, it has been suggested that the organic aerosols called “brown carbon” can absorb solar radiation, especially at ultraviolet (UV) and shorter visible wavelengths and contribute to the radiation balance and photochemical reactions in the atmosphere (Andreae and Gelencs ´er, 2006; Moosm ¨uller et al., 2009; Alexander et al., 2008 and 10
references therein). “Brown carbon” is operationally defined as a light absorbing car-bonaceous material with a wavelength dependent imaginary part (k) of the complex refractive index (RI),m=n−ki.
Sources of brown carbon have been reported to be the organic components gener-ated during the combustion of biomass such as wood (Kirchsteller et al., 2004; Chen 15
and Bond, 2010) corn stem (Schnaiter et al., 2005), and rice straw (Faves et al., 2009), as well as fossil fuels such as propane (Schnaiter et al., 2006) coal (Bond, 2001) and the organic components included in diesel exhaust (Adler et al., 2010). Humic-like sub-stances (HULIS) extracted from aerosols generated by biomass burning (Hoffer et al., 2006) and sampled in air pollution, rural forests, and fresh smoke conditions (Dinar 20
et al., 2008) was also reported to exhibit light absorption especially at UV and shorter visible wavelengths.
Secondary organic aerosols (SOAs) contain many different chemicals including high molecular weight products and thus may possibly act as “brown carbon” (Graber and Rudich, 2006; Hallquist et al., 2009). Jacobson (1999) suggested the possible influ-25
ACPD
12, 14551–14589, 2012Complex refractive index of toluene-SOA
T. Nakayama et al.
Title Page
Abstract Introduction
Conclusions References
Tables Figures
◭ ◮
◭ ◮
Back Close
Full Screen / Esc
Printer-friendly Version Interactive Discussion
Discussion
P
a
per
|
Dis
cussion
P
a
per
|
Discussion
P
a
per
|
Discussio
n
P
a
per
|
generated during the gasphase photooxidation of toluene in the presence of nitrogen oxides (NOx=NO+NO2) (Jaoui et al., 2008; Nakayama et al., 2010a; Zhong and Jang, 2011), the chemical aging of SOAs generated from the reaction ofd-limonene with O3 (Bones et al., 2010; Laskin et al., 2010) the irradiation of aqueous solutions containing H2O2and phenolic compounds (Chang and Thompson, 2010), and aqueous phase re-5
actions involving glyoxal and methyglyoxal (Shapiro et al., 2009; Galloway et al., 2009; Sareen et al., 2010; Trainic et al., 2011) were reported to exhibit light absorption at UV and/or shorter visible wavelengths.
The photooxidation of aromatic hydrocarbons such as toluene, xylene, and trimethyl-benzene (TMB) in the presence of NOxis known as a major source of anthropogenic 10
SOAs (Kleindienst et al., 2004; Ng et al., 2007; Henze et al., 2008); therefore, quanti-tative characterization of the optical properties of these SOAs is required to estimate the effect of anthropogenic SOAs on the atmospheric radiation balance. However, only a few experimental studies to determine the RI values of light absorbing SOAs have been reported. Kim et al. (2010) reported the real part of the RI at 670 nm for the 15
SOAs generated during the photooxidation of toluene in the presence of NOx(denoted by toluene-SOAs) under a variety of initial hydrocarbon ([HC]ini=1.71–3.75 ppmv) and NOx ([NOx]ini=820–3100 ppbv) conditions in the absence of seed particles and reported n values ranging from 1.4 to 1.6 using a polar nephelometer. Our group (Nakayama et al., 2010a) retrieved the real and imaginary parts of the RI values at 20
355 and 532 nm for the toluene-SOAs generated in the presence of [HC]ini=4.0 ppmv and [NOx]ini= 540 ppbv and absence of seed particles by measuring the extinction and scattering coefficients using a cavity ring-down spectrometer (CRDS) and a neph-elometer, respectively. The RI values ofm=(1.632+−0.0380.035)−(0.047+−0.0410.036)iat 355 nm and
m=(1.483+0.032−0.036)−(0.007+0.030−0.007)i at 532 nm were reported. A non-negligible k value 25
ACPD
12, 14551–14589, 2012Complex refractive index of toluene-SOA
T. Nakayama et al.
Title Page
Abstract Introduction
Conclusions References
Tables Figures
◭ ◮
◭ ◮
Back Close
Full Screen / Esc
Printer-friendly Version Interactive Discussion
Discussion
P
a
per
|
Dis
cussion
P
a
per
|
Discussion
P
a
per
|
Discussio
n
P
a
per
|
the absorption spectrum of toluene-SOAs that were generated with and without seed particles using a UV-visible spectrometer with an integrating sphere after collection on a filter. Based on the absorption spectrum, they reported the imaginary part of the RI value at 350 nm for the toluene-SOAs generated in the presence of [HC]ini=0.207 and 0.202 ppmv and [NOx]ini=62 and 70 ppbv and absence of seed particles to be 5
k=0.0214 and 0.0215. They also reported that the SOAs generated in the presence of (NH4)2SO4 or NH4HSO4+H2SO4(1 : 1 mixture molar mixture) seed particles have
k values that are 2–3 times larger at 350 nm than those generated in the absence of seed particles. Nitrated aromatics compounds such as nitro-cresols were consid-ered as plausible sources of the light absorption observed by Nakayama et al. (2010a) 10
and Zhong and Jang (2011). The production quantum yield of nitrated aromatic com-pounds may depend on [NOx]ini; however the k values were measured under limited [NOx]ini conditions: 540 ppbv (Nakayama et al., 2010a) and 62–70 ppbv (Zhong and Jang, 2011).
In this study, the wavelength and NOx dependence of the complex RI values of the 15
toluene-SOAs are investigated in detail. To determine the smallkvalue accurately, a 3λ
photoacoustic spectrometer (Droplet Measurement Technologies, PASS-3) was used to directly measure the light absorption of the SOAs suspended in air. In addition, the complex RI values of the SOAs generated during the photooxidation of the 1,3,5-TMB in the presence of NOx(denoted by 1,3,5-TMB-SOAs) were also determined to inves-20
tigate the influence of chemical structure on the optical properties of the SOAs from aromatic hydrocarbons. Using the obtained RI values, possible atmospheric implica-tions of the light absorption of the anthropogenic SOAs are also discussed.
2 Experimental
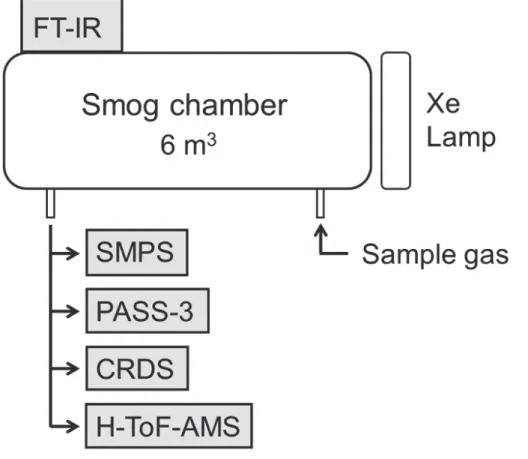
The experimental setup used in this study, which is shown in Fig. 1, is similar to that 25
ACPD
12, 14551–14589, 2012Complex refractive index of toluene-SOA
T. Nakayama et al.
Title Page
Abstract Introduction
Conclusions References
Tables Figures
◭ ◮
◭ ◮
Back Close
Full Screen / Esc
Printer-friendly Version Interactive Discussion
Discussion
P
a
per
|
Dis
cussion
P
a
per
|
Discussion
P
a
per
|
Discussio
n
P
a
per
|
1979; Sato et al., 2007). The toluene (or 1,3,5-TMB), NO, methyl nitrate, and purified air were mixed in the chamber and continuously irradiated by light from a xenon arc lamp (19 kW) through Pyrex filters. Methyl nitrite (∼0.01 ppmv) was used as the OH source. Toluene (Wako Chemicals, 99 %), 1,3,5-TMB (Tokyo Chemical Industry,>97 %), and nitrogen oxide (Takachiho Chemical Industrial Co., 99.9 %) were used without further 5
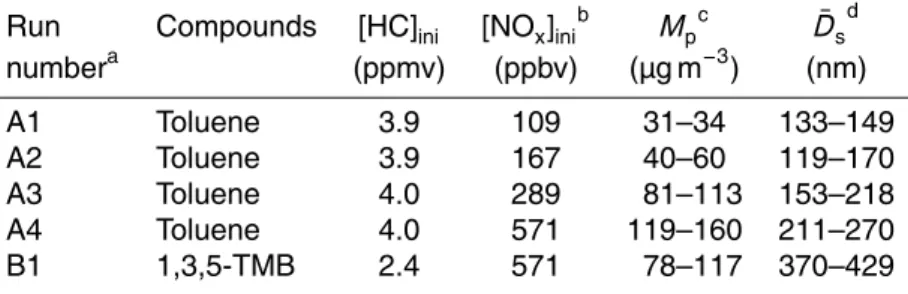
purification. No seed particles were added in the present study. The total pressure in the chamber was maintained at 1000–1030 hPa by adding a purified air during the measurements. All experiments were conducted under room temperature (298±3 K) and dry ([H2O]<1 ppmv) conditions. Four experiments (runs A1-A4) were conducted for the toluene-SOAs with different [NOx]ini conditions (109–571 ppbv) to examine the 10
NOxdependence of the RI values as shown in Table 1. In addition, one experiment (run B1) was conducted for the 1,3,5-TMB-SOAs with a high [NOx]ini condition (571 ppbv).
The concentrations of toluene, 1,3,5-TMB, NO, NO2, and O3 were monitored using a Fourier transform infrared spectrometer (FT-IR; Nicolet, Nexus 670) combined with a mirror system with a 221.5 m optical path. The particle size distribution was mea-15
sured every 6 min using a scanning mobility particle sizer (SMPS; TSI, 3934). Typical temporal profiles of the toluene, NO, NO2, O3, mass concentrations and the surface mean diameters of the toluene-SOAs during “run A4” are shown in Fig. 2. When the mass concentration of the SOAs began to increase, the SOAs were introduced into the PASS-3 and a custom-built cavity ring down spectrometer (CRDS).
20
The PASS-3 instrument was used to measure the absorption (babs(λ)) and scattering (bsca(λ)) coefficients at 405, 532, and 781 nm. Thebsca(λ) data were calibrated using monodisperse polystyrene latex (PSL) particles. Thebabs(405, 781 nm) data were cal-ibrated using polydisperse propane soot particles, while the babs(532 nm) data were calibrated with monodisperse nigrosin particles and gaseous NO2. These calibration 25
ACPD
12, 14551–14589, 2012Complex refractive index of toluene-SOA
T. Nakayama et al.
Title Page
Abstract Introduction
Conclusions References
Tables Figures
◭ ◮
◭ ◮
Back Close
Full Screen / Esc
Printer-friendly Version Interactive Discussion
Discussion
P
a
per
|
Dis
cussion
P
a
per
|
Discussion
P
a
per
|
Discussio
n
P
a
per
|
bsca(405 nm), andbsca(781 nm), respectively. For background interpolation, measure-ments of filtered air were conducted using a particulate filter (Balston) typically for 4 min every 12 min. The typical detection limits for the 12 min averaged data ofbabs(405 nm),
babs(532 nm),babs(781 nm),bsca(405 nm), andbsca(781 nm) were estimated to be 1.0, 0.9, 0.4, 0.2, and 0.2 M m−1, respectively, by taking the two standard deviations (2σ) of 5
each signal during the filtered air measurements. It should be noted that these detec-tion limits varied depending on the magnitude of the drift in each signal. Correcdetec-tions of babs for the gas phase absorption of NO2 were conducted using the mixing ratio measured by FT-IR, absorption cross section, and the transmission of NO2through the particulate filter. Overall uncertainties for the PASS-3 data were estimated by taking 10
into account the uncertainties in the calibration factors, in the background interpola-tions (estimated from the drift between neighboring filtered air measurements), and in the corrections of the gas phase absorption as well as detection limit values. The typical sampling flow rate of the PASS-3 was 1.0 lpm.
The CRDS instrument was used to measure the extinction coefficients at 532 nm 15
(bext(532 nm)). A detailed description of the CRDS instrument used in the present study is included in our previous papers (Nakayama et al., 2010a, b). Measurement of the ring-down time for the filtered air was conducted using a particulate filter (Pall), typi-cally for 4 min every 12 min. A typical detection limit for the 12 min averaged data for
bext(532 nm) during the experiments was estimated to be 0.6 M m−1 by taking the 2σ 20
of each signal during the filtered air measurements. The accuracy and precision of the CRDS instrument were checked using monodisperse PSL particles and the uncertain-ties in the determination ofbext(532 nm) was estimated to be<3 % (Nakayama et al., 2010a, b). The typical sampling flow rate of the CRDS was 0.6 lpm.
The chemical properties of the aerosols were also measured every 6 min using 25
ACPD
12, 14551–14589, 2012Complex refractive index of toluene-SOA
T. Nakayama et al.
Title Page
Abstract Introduction
Conclusions References
Tables Figures
◭ ◮
◭ ◮
Back Close
Full Screen / Esc
Printer-friendly Version Interactive Discussion
Discussion
P
a
per
|
Dis
cussion
P
a
per
|
Discussion
P
a
per
|
Discussio
n
P
a
per
|
with a mass resolution of∼2700. Data obtained by H-ToF-AMS were numerically an-alyzed using the ToF-AMS Analysis Toolkit program Version 1.48 combined with the ToF-AMS HR Analysis Program Version 1.07.
3 Results
The complex RI of the SOAs was determined using the same procedure that was 5
used in our previous study (Nakayama et al., 2010a). Assuming homogeneous spher-ical particles, the effective absorption, scattering, and extinction efficiencies of poly-disperse SOA particles with a surface mean diameter ¯Dsat wavelengthλ(=405, 532, or 781 nm),Qabs∗( ¯D
s,λ),Qsca∗( ¯Ds,λ), andQext∗( ¯Ds,λ) were calculated as follows:
Qabs,sca,ext∗( ¯D
s,λ)=babs,sca,ext(λ)/
Z
N(Dp)π 4D
2
pdDp (1)
10
whereDp is the geometrical particle diameter and N is the number concentration of particles in the size bin dDpwith a mean diameterDpper unit volume.
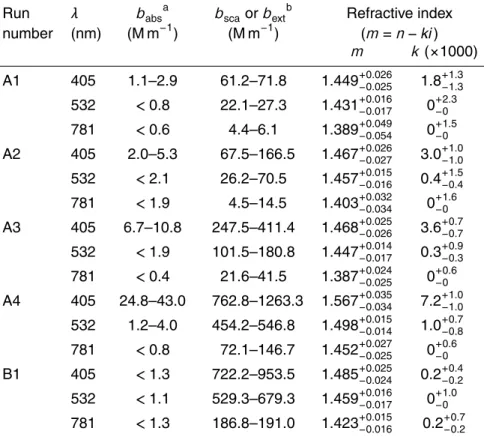
A 12-min average of thebabs(405, 532, 781 nm),bsca(405, 781 nm) andbext(532 nm) obtained by the PASS-3 and CRDS, and size distributions obtained by the SMPS were 15
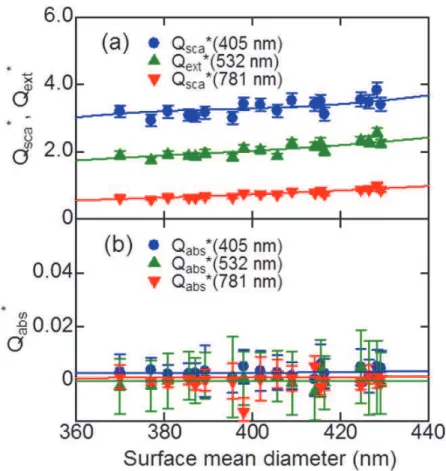
used for the analysis. The range ofbabs,bsca, and bext values used for the determi-nation of the RI values are listed in Table 2. Figures 3 and 4 show theQabs∗ at 405, 532, and 781 nm, the Qsca∗ at 405 and 781 nm, and the Q
ext at 532 nm for “run A4” (toluene–SOAs, high [NOx]ini condition) and “run B1” (1,3,5-TMB–SOA, high [NOx]ini condition), respectively, as a function of ¯Ds. Significant light absorption was found at 20
ACPD
12, 14551–14589, 2012Complex refractive index of toluene-SOA
T. Nakayama et al.
Title Page
Abstract Introduction
Conclusions References
Tables Figures
◭ ◮
◭ ◮
Back Close
Full Screen / Esc
Printer-friendly Version Interactive Discussion
Discussion
P
a
per
|
Dis
cussion
P
a
per
|
Discussion
P
a
per
|
Discussio
n
P
a
per
|
The effective absorption, scattering, and extinction efficiencies can also be calculated using the Mie theory as follows:
Qabs,sca,ext∗( ¯D s,λ)=
Z
f(Dp)Qabs,sca,ext(Dp,λ)dDp (2)
where f(Dp) is the normalized surface area weighted size distribution function. 5
Qabs,sca,ext(Dp,λ) represent the absorption, scattering, and extinction efficiencies, and are calculated based on the Mie theory using the BHMIE algorithm (Bohren and Huff -man, 1983).
In this study, the optimized RI values were determined using combinations of the data: (1)Qsca∗andQabs∗at 405 and 781 nm and (2)Qext∗andQabs∗at 532 nm. To min-10
imize the sum of the squared residual between theQ∗ values obtained using Eq. (1) and those obtained using Eq. (2), the optimized RI value was determined. Thenvalue was fixed between 1.2 and 1.7 and a positive value ofk was chosen during the fitting procedure. The complex RI value was determined for each experimental run by as-suming a constant RI value during the measurement. The results forQabs∗,Q
sca∗, and 15
Qext∗calculated using Eq. (2) with the optimized RI values for “run A4” and “run B1” are shown as solid lines in Figs. 3 and 4, respectively. The obtained RI values and their un-certainties, which were estimated from the 2σfor the differences between theQ∗( ¯D
s,λ) values obtained using Eqs. (1) and (2) and uncertainties in the measurements of the optical properties and size distributions of the SOAs, are summarized in Table 2. 20
4 Discussion
4.1 Wavelength dependence of the RI values for toluene-SOAs
Figure 5 shows the wavelength dependence of thenandkvalues for the toluene-SOAs obtained in the present study (nandk, runs A1–A4, filled circles) and reported in the literature, Nakayama et al. (2010a) (nand k, open circles), Kim et al. (2010) (n, open 25
ACPD
12, 14551–14589, 2012Complex refractive index of toluene-SOA
T. Nakayama et al.
Title Page
Abstract Introduction
Conclusions References
Tables Figures
◭ ◮
◭ ◮
Back Close
Full Screen / Esc
Printer-friendly Version Interactive Discussion
Discussion
P
a
per
|
Dis
cussion
P
a
per
|
Discussion
P
a
per
|
Discussio
n
P
a
per
|
The n values at 405, 532, and 781 nm obtained in the present study range be-tween 1.4 and 1.6 and show a gradual increase to shorter wavelengths. Then value of 1.498+0.015
−0.014 at 532 nm under high [NOx]ini condition ([NOx]ini=571 ppbv, run A4) is in good agreement with that obtained in our previous study (1.483+0.032−0.036) (Nakayama et al., 2010a) under high [NOx]ini condition ([NOx]ini=540 ppbv). Interpolation of all 5
of our results at 532 and 781 nm gives an nvalue of ∼1.43 at 670 nm, which lies in the lower part of the range between 1.4 and 1.6, reported by Kim et al. (2010) under a variety of [HC]ini and [NOx]ini conditions ([HC]ini=1.71–3.75 ppmv, [NOx]ini=820– 3100 ppbv). The results may be explained by their use of higher [NOx]ini conditions than those of the present study.
10
Significantk values at 405 nm, which range from (1.8+1.3−1.3)×10−3to (7.2+1.0−1.0)×10−3 are obtained for the toluene-SOAs in the present study. Thek value depends on the [NOx]ini as discussed in detail in the next section. At 532 nm, a non-negligiblek value (1.0+0.7−0.8×10⁻³) is also obtained under high [NOx]iniconditions (run A4), while the values for the other runs (A1, A2, and A3) are negligibly small within the experimental uncer-15
tainties. At 781 nm, thek values are found to be negligible for all runs. In our previous study (Nakayama et al., 2010a), the RI values were determined from the measure-ments of the extinction and scattering coefficients. Therefore, precise determination of a smallk value was difficult because of the large uncertainties (typically∼4×10⁻²) as shown by the larger error bars in Fig. 5b. In the present study, by directly measuring 20
the absorption coefficients using the PASS-3, the k values could be determined with a higher precision (typical uncertainties of∼1×10⁻³).
In contrast to the nvalues, which gradually increased to shorter wavelengths from 781 to 355 nm, thek values obtained in the present study and reported in the litera-ture (Nakayama et al., 2010a; Zhong and Jang, 2011) indicate that the light absorption 25
ACPD
12, 14551–14589, 2012Complex refractive index of toluene-SOA
T. Nakayama et al.
Title Page
Abstract Introduction
Conclusions References
Tables Figures
◭ ◮
◭ ◮
Back Close
Full Screen / Esc
Printer-friendly Version Interactive Discussion
Discussion
P
a
per
|
Dis
cussion
P
a
per
|
Discussion
P
a
per
|
Discussio
n
P
a
per
|
4.2 NOxdependence of the RI values for toluene-SOAs
Figure 6a, b shows the [NOx]ini dependence of the n and k values at 405 nm (filled circles) and 532 nm (open circles) for the toluene-SOAs obtained in the present study. The n values at 405 and 532 nm slightly increased from 1.45 to 1.57 and 1.43 to 1.50, respectively, with increasing [NOx]ini from 109 to 571 ppbv as shown in Fig. 6a. 5
The difference in the n values at 405 and 532 nm also increased from ∼0.02 to ∼ 0.07 with increasing [NOx]ini. These results are again consistent with the theoretically predicted features when the light absorption of a shorter resonant wavelength is taken into account (e.g. Moosm ¨uller et al., 2011), because the stronger light absorption under high [NOx]ini conditions would cause a larger increase in the n values on the long-10
wavelength side. It should be noted that a change in chemical properties, such as the O/C ratio, may also contribute to the observed [NOx]ini dependence of then values: a positive correlation has been reported for squalane and azelaic acid by Cappa et al. (2011).
Thekvalues at 405 nm increase from 1.8×10⁻³to 7.2×10⁻³with increasing [NOx]ini 15
from 107 to 571 ppbv as shown in Fig. 6b. Under the high [NOx]inicondition (571 ppbv), the non-negligible k value (1.0×10⁻³) was also observed at 532 nm. As a plausible source of light-absorption for the toluene-SOAs, nitro-aromatic compounds, particularly nitro-cresols, have been proposed (Nakayama et al., 2010a; Zhong and Jang, 2011) because nitro-cresols such as 4-nitro-o-cresol 4-nitro-m-cresol, 2-nitro-p-cresol, and 20
4,6-dinitro-o-cresol, which were identified as products of toluene-SOAs (Jang and Ka-mens, 2001; Sato et al., 2007), exhibit strong light absorption at>350 nm (Jacobson, 1999; Chen et al., 2011).
Figure 7 shows one of the significant reaction schemes for the formation of nitro-cresols during the photooxidation of toluene in the presence of NOx. There are two 25
ACPD
12, 14551–14589, 2012Complex refractive index of toluene-SOA
T. Nakayama et al.
Title Page
Abstract Introduction
Conclusions References
Tables Figures
◭ ◮
◭ ◮
Back Close
Full Screen / Esc
Printer-friendly Version Interactive Discussion
Discussion
P
a
per
|
Dis
cussion
P
a
per
|
Discussion
P
a
per
|
Discussio
n
P
a
per
|
Under our experimental conditions, most of the toluene-OH adduct reacts with O2, while only a few percent of the adduct reacts with NO2 (Koch et al., 2007 and refer-ences therein). Although cresols (o-,m-,p-cresol) can be generated from both of the reactions, the cresols are considered to be mainly generated from the reaction of the toluene-OH adduct with O2, because the yields of o- ,m-, andp-cresol are reported 5
to be∼0.12,∼0.03, and∼0.03, respectively, and do not strongly depend on the initial NOx conditions (Smith et al., 1998; Klotz et al., 1998). The H atom abstraction from cresols by OH leads to the formation of methyl phenoxy radicals. Nitro-cresols are con-sidered to be mainly generated from the reactions of methyl phenoxy radicals with NO2, as shown in Fig. 7 (Forstner et al., 1997; Sato et al., 2007).
10
The reaction of the cresol-OH adducts with NO2possibly contributes to the formation of nitro-cresols. However, the contribution should be small because most of the cresol-OH adducts react with O2rather than NO2(Koch et al., 2007). The fact that the yields of nitro-cresols in the OH-induced oxidation of cresols are similar to the calculated fraction of the reaction proceeding via H atom abstraction from the OH group indicates that the 15
nitro-cresols are mainly generated through methyl phenoxy radicals (Atkinson et al., 1992; Olariu et al., 2002; Coeur-Tourneur et al., 2006). It should also be noted that nitrotoluenes, such as 3-nitrotoluene, are generated through the reaction of toluene-OH adducts with NO2, particularly at high [NOx]ini conditions (typically,>1 ppm) (Forstner et al., 1997; Smith et al., 1998; Sato et al., 2007). The contributions of nitrotoluenes to 20
the light absorption of the toluene-SOAs should be minimal, however, because both the yield and absorption cross section of nitrotoluenes have been estimated to be smaller than those of nitro-cresols under our experimental conditions (Forstner et al., 1997; Smith et al., 1998; Sato et al., 2007; Shama, 1991; Chen et al., 2011).
The observed [NOx]ini dependence of the k values may be explained by competi-25
tion reactions of the methyl phenoxy radicals with NO2 and other oxidants, as shown in Fig. 7. Although the rate constants for the reactions of the methyl phenoxy radials with NO2and other oxidants are not available, those for the reactions of phenoxy radi-cal (C6H5O) with NO2, NO, and O3were reported to bekNO
2=2.1×10 −12
ACPD
12, 14551–14589, 2012Complex refractive index of toluene-SOA
T. Nakayama et al.
Title Page
Abstract Introduction
Conclusions References
Tables Figures
◭ ◮
◭ ◮
Back Close
Full Screen / Esc
Printer-friendly Version Interactive Discussion
Discussion
P
a
per
|
Dis
cussion
P
a
per
|
Discussion
P
a
per
|
Discussio
n
P
a
per
|
1998),kNO=1.88×10⁻¹²(Platz et al., 1998), andk
O3=2.86×10
−13(Tao and Li, 1999),
cm3molecule−1s−1at room temperature (296–298 K), respectively. The reaction of the phenoxy radical with O2 was reported to be negligible (Platz et al., 1998). Although possible contributions of the reactions of the phenoxy radical with HO2and alkylperoxy (RO2) radical cannot be ruled out, the rate constants for these reactions are not avail-5
able. Assuming that the rate constants for methyl phenoxy radicals are similar to those for the phenoxy radical and that the reactions with HO2 and RO2 are negligible, the effective yield of the reaction of methyl phenoxy radicals with NO2(YNO2) is estimated by the following equation
YNO
2=
kNO2[NO2]eff
kNO2[NO2]eff+kNO[NO]eff+kO3[O3]eff (3)
10
where [NO2]eff, [NO]eff, and [O3]eff are the effective concentrations of NO2, NO, and O3, respectively, during the formation of the SOAs. The [NO2]eff, [NO]eff, and [O3]eff are calculated by the following equation,
[X]eff=
Rtmax
t0 [X]t∆Mtdt Rtmax
t0 ∆Mtdt
(X=NO2, NO, O3), (4)
15
wheretandtmaxare the time when the irradiation began and when the volume (mass) concentration of the SOAs, which was measured by the SMPS, reached a maximum, respectively; [X]tare the concentrations of X at timet; and∆Mtis the change in mass
concentration of the SOAs during the time dt. The [X]eff is identical to the average 20
ACPD
12, 14551–14589, 2012Complex refractive index of toluene-SOA
T. Nakayama et al.
Title Page
Abstract Introduction
Conclusions References
Tables Figures
◭ ◮
◭ ◮
Back Close
Full Screen / Esc
Printer-friendly Version Interactive Discussion
Discussion
P
a
per
|
Dis
cussion
P
a
per
|
Discussion
P
a
per
|
Discussio
n
P
a
per
|
mechanism described above, are the main contributors to the light absorption of the SOAs.
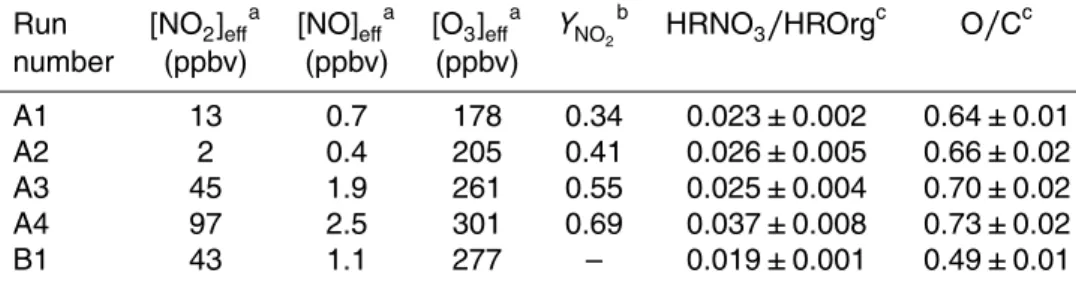
The observed [NOx]inidependence of the RI values was compared with the chemical properties of the SOAs, which were simultaneously measured by the H-TOF-AMS. The ratio averages (±1σ) of the nitrate to the organics (HRNO3/HROrg) and the oxygen 5
atoms to the carbon atoms (O/C) calculated from the H-ToF-AMS data for the same pe-riod used for determinations of the RI values are listed in Table 3. The HRNO3/HROrg ratio increases with an increase in the [NOx]ini from 0.023 to 0.037 as shown in Fig. 6c with the open triangles. Particulate nitro-aromatic compounds are known to be detected as nitrate by AMS (Bahreni et al., 2005; Sato et al., 2010, 2012). It should be noted 10
that the mass concentration of the SOAs may also contribute to the HRNO3/HROrg ratio since the mass concentration increases with an increase in the [NOx]iniunder the present experimental conditions with a constant [HC]ini, as shown in Table 1. However, Sato et al. (2012) reported that the HRNO3/HROrg ratio for the SOAs generated from photooxidation of toluene in the presence of NOx(denoted by toluene-SOAs) was not 15
dependent on the mass loading, but closely dependent on the [NOx]ini. Therefore, the AMS data reinforce the hypothesis that the nitro-aromatics including nitro-cresols con-tribute to the observed light absorption. The average of the O/C ratio was also found to increase with increasing [NOx]ini from 0.64 to 0.73 as shown in Fig. 6c with the filled triangles. This suggests that the oxidation processes of the precursors may also 20
contribute to the enhancement of the light absorption of the toluene-SOAs.
4.3 RI values of 1,3,5-TMB-SOAs
The RI values of 1,3,5-TMB-SOAs were also determined to investigate the influence of the chemical structure of the aromatic hydrocarbons on the optical properties of the SOAs. The RI values of the 1,3,5-TMB-SOAs at 405, 532, and 781 nm were de-25
termined to be 1.485+0.025−0.024−0.2+0.4−0.2i, 1.459+0.016−0.017−0 +1.0
−0 i, and 1.423 +0.015 −0.016−0.2
ACPD
12, 14551–14589, 2012Complex refractive index of toluene-SOA
T. Nakayama et al.
Title Page
Abstract Introduction
Conclusions References
Tables Figures
◭ ◮
◭ ◮
Back Close
Full Screen / Esc
Printer-friendly Version Interactive Discussion
Discussion
P
a
per
|
Dis
cussion
P
a
per
|
Discussion
P
a
per
|
Discussio
n
P
a
per
|
contrast to the toluene-SOAs, however, thek values for 1,3,5-TMB were found to be negligible at all the wavelengths studied (405, 532, and 781 nm). The average (±1σ) of the HRNO3/HROrg and O/C ratios during the same period as that used for determina-tion of the RI values were 0.019±0.001 and 0.49±0.01, respectively (Table 3). These values are lower than those for the toluene-SOAs (0.023–0.037 (HRNO3/HROrg) and 5
0.64–0.73 (O/C)) obtained under conditions where the [NOx]iniwas between 107 and 571 ppbv.
In 1,3,5-TMB, the hydrogen atoms in two meta sites to the methyl group in toluene are substituted by other methyl groups. The difference in the light absorption proper-ties between toluene-SOAs and 1,3,5-TMB-SOAs may be explained by the difference 10
in the production of nitro-phenols. Sato et al. (2012) compared the chemical properties of the 1,3,5-TMB-SOAs with those of SOAs generated from the photooxidation of ben-zene in the presence of NOx (denoted by benzene-SOAs) based on H-ToF-AMS and liquid chromatography/time of flight mass spectrometry (LC/TOF-MS) analyses. They reported that nitrophenols were not detected in the 1,3,5-TMB-SOAs while they were 15
detected in the benzene-SOAs and that the HRNO3/HROrg ratio for 1,3,5-TMB was lower than that for the benzene-SOAs and not dependent on the [NOx]iniThese results were explained by the instability of the NO2adducts of the phenoxytype radicals pro-duced from 2,4,6-trimethyphenol, which was formed from the reaction of the 1,3,5-TMB with OH (Sato et al., 2012). In the resonance structures of the phenoxytype radicals, 20
the carbon atoms at the radical’s center are bonded with methyl groups and therefore the NO2adducts of the phenoxytype radicals immediately dissociate to reactants again (Sato et al., 2012). The fact that no light absorption was revealed for the 1,3,5-TMB-SOAs in the present study is consistent with the hypothesis that nitro-aromatics such as nitro-cresols are the main sources of the light absorption for the toluene-SOAs. The 25
ACPD
12, 14551–14589, 2012Complex refractive index of toluene-SOA
T. Nakayama et al.
Title Page
Abstract Introduction
Conclusions References
Tables Figures
◭ ◮
◭ ◮
Back Close
Full Screen / Esc
Printer-friendly Version Interactive Discussion
Discussion
P
a
per
|
Dis
cussion
P
a
per
|
Discussion
P
a
per
|
Discussio
n
P
a
per
|
In the case of many other aromatic hydrocarbons such as benzene, o-xylene, m -xylene,p-xylene, 1,2,4-TMB, and ethylbenzene, there are other meta sites for which the hydrogen atom is not substituted by an alkyl group. Therefore, the photooxidation products of these precursors include stable NO2adducts of phenoxytype radicals, and the SOAs generated from these precursors presumably contain nitro-phenols and ex-5
hibit light absorption at UV and shorter visible wavelengths.
5 Atmospheric implications
To estimate the possible contribution of the light absorption by the toluene-SOAs, mass absorption cross sections (MACs) were calculated using the obtained RI values.
If the nitro-cresols generated from the methyl phenoxy radicals with NO2 are the 10
main sources of light absorption of the toluene-SOAs and the yield of the methyl phe-noxy radicals is constant, as discussed in Sect. 4.2, thenk can be considered to be proportional toYNO2
k(λ)=A(λ)×YNO2
=A(λ)×
kNO2[NO2]eff
kNO2[NO2]eff+kNO[NO]eff+kO3[O3]eff
(5) 15
whereA(λ) is the wavelength dependent factor that is proportional to the effective ab-sorption cross section of the light absorbing species (i.e. nitro-cresols). Because [NO]eff is smaller than both [NO2]eff and [O3]eff under our experimental conditions, the ob-served k values of the SOAs are substantially determined by the ratio of [NO2]eff to 20
[O3]eff during SOA formation. Figure 8b shows the [NO2]eff/[O3]eff ratio dependence of thekvalues at 405 and 532 nm for the toluene-SOA. Minimizing the sum of the squared residual between the measuredk(λ) values and those calculated using Eq. (5), theA(λ) values at 405 and 532 nm were determined to be (8.3+1.8
−2.1)×10
−3and (1.5
ACPD
12, 14551–14589, 2012Complex refractive index of toluene-SOA
T. Nakayama et al.
Title Page
Abstract Introduction
Conclusions References
Tables Figures
◭ ◮
◭ ◮
Back Close
Full Screen / Esc
Printer-friendly Version Interactive Discussion
Discussion
P
a
per
|
Dis
cussion
P
a
per
|
Discussion
P
a
per
|
Discussio
n
P
a
per
|
respectively. The quoted uncertainties include 2σ for the differences between the ob-servedkvalues and those calculated using Eq. (5) and uncertainties in the experimen-tally determinedk values.
The n values at 405 and 532 nm slightly depend on [NO2]eff/[O3]eff, as shown in Fig. 8a, possibly due to their contributions to the light absorption as discussed in 5
Sect. 4.2. Assuming thatn(532 nm) value obtained under high [NOx]iniconditions (run A1), 1.431+0.016−0.017, is a typicalnvalue for the toluene-SOAs without light absorption, the [NO2]eff/[O3]eff dependence of the n(λ) values can be estimated using the following equation
n(λ)=1.431+0.016
−0.017+B(λ)×YNO2 10
=1.431+0.016
−0.017+B(λ)×
kNO2[NO2]eff
kNO2[NO2]eff+kNO[NO]eff+kO3[O3]eff (6)
whereB(λ) is the wavelength dependent factor that is proportional to the contribution of the light absorbing species ton. Minimizing the sum of the squared residual between the measuredn(λ) values and those calculated using Eq. (6), the B(λ) values at 405 15
and 532 nm were determined to be 0.13+0.06−0.07 and 0.06+0.04−0.03, respectively. The quoted uncertainties include 2σfor the differences between the observednvalues and those calculated using Eq. (6) and the uncertainties in the experimentally determinedn val-ues. The solid (dashed) lines in Fig. 8a, b show the best estimation (and upper or lower limit) values of then(λ) and k(λ) calculated using Eqs. (5) and (6) with the optimized 20
A(λ) and B(λ) values respectively, assuming a constant [NO]eff/[NO2]eff value of 0.4 which is the average for the experimental runs (A1–A4).
Using the obtained [NO2]eff/[O3]effdependentn(λ) andk(λ) values, the MAC values of the toluene-SOAs at 405 and 532 nm were estimated based on the Mie theory (BH-MIE algorithm) assuming homogeneous spherical particles with a particle density of 25
1.4 g cm−3 (Sato et al., 2007) and a constant [NO
ACPD
12, 14551–14589, 2012Complex refractive index of toluene-SOA
T. Nakayama et al.
Title Page
Abstract Introduction
Conclusions References
Tables Figures
◭ ◮
◭ ◮
Back Close
Full Screen / Esc
Printer-friendly Version Interactive Discussion
Discussion
P
a
per
|
Dis
cussion
P
a
per
|
Discussion
P
a
per
|
Discussio
n
P
a
per
|
the photooxidation of toluene occurs, because of the rapid conversion of NO to NO2 due to the reaction with O3. Therefore, the constant [NO]/[NO2] ratio (=0.04) was as-sumed in the calculation. Figure 9 shows the [NO2]/[O3] dependence of the MACs of the SOAs with a diameter of 200, 400, and 600 nm, for the typical [NO2]/[O3] range be-tween 0.1 and 10 in an urban atmosphere during the daytime (e.g., Finlayson-Pitts and 5
Pitts, 2000; Kondo et al., 2008). The ranges of the best estimates (upper and lower lim-its) of the MAC values at 405 and 532 nm for the toluene-SOA with diameters between 200 and 600 nm were estimated to be 0.11–0.33 (0.08–0.48) and 0.012–0.046 (0.002– 0.081) m2g−1, respectively. As shown in Fig. 8, the MAC values at 405 and 532 nm both increase 2.4 times on average with an increase in the [NO2]/[O3] ratio from 0.1 10
to 10 and increase 1.2 and 1.6 times on average, respectively, with an increase in the particle diameter from 200 to 600 nm.
Several observational studies on wavelength dependence of the MAC values of brown carbon in urban aerosols (Barnard et al., 2008; Flowers et al., 2010; Zhang et al., 2011; Cheng et al., 2011) have been reported. Barnard et al. (2008) deter-15
mined the MAC values at wavelength between 300 and 500 nm for organic compo-nents of aerosols in the Mexico city and reported that the MAC steeply decrease from ∼6 m2g−1at 390 nm to∼1 m2g−1at 410 nm. Flowers et al. (2010) reported the MAC values for organic carbon in various Asian pollution plumes, which were transported to Jeju, Korea, ranging between 2.1 and 3.4 m2g−1C at 405 nm and between 0 and 20
1.0 m2g−1C at 532 nm. The MAC value at 405 nm for the toluene-SOA obtained in the present study (0.08–0.48 m2g−1) is several times smaller than those reported values. The difference may be explained by contributions of other sources of brown carbon such as biomass burning, because the reported MAC values for combustion related organic aerosols (combustion-OA) are typically larger than those for water soluble or-25
ganic carbons (WSOC) (Sun et al., 2007 and references therein).
ACPD
12, 14551–14589, 2012Complex refractive index of toluene-SOA
T. Nakayama et al.
Title Page
Abstract Introduction
Conclusions References
Tables Figures
◭ ◮
◭ ◮
Back Close
Full Screen / Esc
Printer-friendly Version Interactive Discussion
Discussion
P
a
per
|
Dis
cussion
P
a
per
|
Discussion
P
a
per
|
Discussio
n
P
a
per
|
WSOC in the Los-Angeles basin (LA) and Atlanta during the summer and reported a 4–6 times higher bulk absorption per soluble carbon mass at 365 nm (α(365 nm)/ρ;
α is the bulk absorption coefficient, ρis the density of the WSOC) in LA: 0.69 (week-days) and 0.77 m2g−1C (weekends) than those in Atlanta. They suggested that the light absorption observed in LA was due to freshly-formed anthropogenic SOAs, be-5
cause the radio carbon analysis showed that the SOAs were mainly formed by fossil carbon, and the chemical analysis showed a positive correlation between the bulk ab-sorption coefficients with nitro-aromatics in the WSOC. The bulk absorption per soluble carbon can be compared with the particulate absorption coefficients using the follow-ing relationship, assumfollow-ing that the particles are small relative to the wavelength (Sun 10
et al., 2007),
MAC=ξ×α/ρ (7)
whereξis defined by
ξ= 9n
n2−k2+22
+4n2k2
(8) 15
Applying the n(405 nm) and k(405 nm) values estimated using Eqs. (5) and (6) for [NO2]/[O3] ratios from 0.1 to 10, the ξ values were estimated to be 0.69–0.77. The MAC values at 405 nm were estimated from the reported α(365 nm)/ρ values to be 0.30–0.48 m2g−1C, using the mean angstr ´om exponent, 3.2±1.2, for LA and the ξ values. The ranges of the best estimates (upper and lower limits) of the MAC values at 20
405 nm for the toluene-SOAs with a diameter of 200 nm estimated in the present study, 0.11–0.27 (0.08–0.36) m2g−1, were converted to those per carbon mass, 0.22–0.57 (0.16–0.76) m2g−1C, by taking into account the range of the O/C, H/C, and N/C ratios measured by the ToF-AMS during “runs A1–A4”. These values are roughly consistent with the MAC values at 405 nm estimated based on the observations in LA by Zhang 25
ACPD
12, 14551–14589, 2012Complex refractive index of toluene-SOA
T. Nakayama et al.
Title Page
Abstract Introduction
Conclusions References
Tables Figures
◭ ◮
◭ ◮
Back Close
Full Screen / Esc
Printer-friendly Version Interactive Discussion
Discussion
P
a
per
|
Dis
cussion
P
a
per
|
Discussion
P
a
per
|
Discussio
n
P
a
per
|
The typical MAC values at 405 and 532 nm for the BC particles have been esti-mated to be 10.2 and 7.8 m2g−1, respectively, from the values reported by Bond and Bergstrom (2006) assuming an AAE of 1. The estimated MAC values for BC are 30– 90 (20–130) and>170 (>100) times larger than the best estimates (upper and lower limits) of the MAC values determined in this study for the toluene-SOAs at 405 and 5
532 nm, respectively. In addition, the MAC values for combustion-OA may several times larger than those for the toluene-SOAs as discussed above. However, the temporal and spatial variations of the relative abundance of BC, combustion-OA, and anthropogenic SOAs should be large. Therefore, the light absorption by the anthropogenic SOAs po-tentially contributes to the radiation balance at UV wavelengths below∼400 nm, specif-10
ically when the relative abundance of the anthropogenic SOAs is significant.
It should be noted that the presence of seed particles may enhance the light absorp-tion of the toluene-SOAs by a factor of 2–3 as reported by Zhong and Jang (2011). Further studies on the contribution of other possible factors, such as the presence of seed particles and the generation of SOA from other anthropogenic VOCs, to the RI 15
values of the SOAs should also be important.
6 Conclusions
In the present study, the [NOx]ini dependence of the complex RI values at 405, 532, and 781 nm for the toluene-SOAs was determined for the first time. The imaginary part of the RI value (k) for the toluene-SOAs was found to increase steeply to shorter 20
wavelengths at<405 nm, while the real part of the RI value (n) gradually increased to shorter wavelengths. Thek value at 405 nm was found to increase from 1.8×10⁻³ to 7.2×10⁻³with increasing [NOx]inifrom 109 to 571 ppbv. The HRNO3/HROrg and O/C ratios of the SOAs determined using the H-ToF-AMS also increased with increasing [NOx]ini. Our results imply that nitro-aromatic compounds, probably nitro-cresols, are 25
ACPD
12, 14551–14589, 2012Complex refractive index of toluene-SOA
T. Nakayama et al.
Title Page
Abstract Introduction
Conclusions References
Tables Figures
◭ ◮
◭ ◮
Back Close
Full Screen / Esc
Printer-friendly Version Interactive Discussion
Discussion
P
a
per
|
Dis
cussion
P
a
per
|
Discussion
P
a
per
|
Discussio
n
P
a
per
|
toluene-SOAs. The RI values of the 1,3,5-TMB-SOAs, generated under a high [NOx]ini condition, were also determined for the first time. The light absorption of the 1,3,5-TMB-SOAs was found to be negligible at all wavelengths (405, 532, and 781 nm). These results are explained by a suppression of formation of nitrophenols due to the instability of the NO2 adducts of the phenoxytype radicals produced from 2,4,6-trimethyphenol, 5
which was formed from the reaction of the 1,3,5-TMB with OH.
Using the obtained RI values, the MACs of the toluene-SOAs at 405 and 532 nm were estimated to be 0.08–0.48 and 0.002–0.081 m2g−1, respectively, under typical conditions in urban atmospheres during the daytime. These results indicate that light absorption by the SOAs potentially contributes to the radiation balance at UV wave-10
lengths below∼400 nm, specifically when the relative abundance of the anthropogenic SOAs are significant compared with those of BC and combustion-OA. The estimated MAC values at 405 nm for the toluene-SOA are roughly consistent with those estimated based on the bulk light absorption of WSOC observed in LA by Zhang et al. (2011).
This study suggests that the optical properties of the SOAs generated from aro-15
matic hydrocarbons depend on the concentration of NOxand O3during SOA formation and the chemical structure of the precursors. Therefore, further studies of the optical properties of SOAs generated from a variety of aromatic hydrocarbons (including their isomers) and their [NOx]ini dependence are required for the precise understanding of the atmospheric implications of light-absorbing anthropogenic SOAs.
20
Supplementary material related to this article is available online at: http://www.atmos-chem-phys-discuss.net/12/14551/2012/
acpd-12-14551-2012-supplement.pdf.
Acknowledgement. We would like to thank Y. Goto and Y. Ikeda (Nagoya Univ.) for their as-sistance with the experiments. This study was supported by the global environmental research
25
ACPD
12, 14551–14589, 2012Complex refractive index of toluene-SOA
T. Nakayama et al.
Title Page
Abstract Introduction
Conclusions References
Tables Figures
◭ ◮
◭ ◮
Back Close
Full Screen / Esc
Printer-friendly Version Interactive Discussion
Discussion
P
a
per
|
Dis
cussion
P
a
per
|
Discussion
P
a
per
|
Discussio
n
P
a
per
|
Steel Foundation for Environmental Protection Technology, and the joint research program of the Solar-Terrestrial Environment Laboratory, Nagoya University.
References
Adler, G., Abo Riziq, A., Erlick, C., and Rudich, Y.: Effect of intrinsic organic carbon on the optical properties of fresh diesel soot, P. Natl. Acad. Sci. USA, 107, 6699–6704, 2010.
5
Akimoto, H., Hoshino, H., Inoue, G., Sakamaki, F., Washida, N., and Okuda, M.: Design and characterization of the evacuable and bankable photochemical smog chamber, Environ. Sci. Technol., 13, 471–475, 1979.
Alexander, D. T. L., Crozier, P. A., and Anderson, J. R.: Brown carbon spheres in East Asian outflow and their optical properties, Science, 321, 833–836, 2008.
10
Andreae, M. O. and Gelencs ´er, A.: Black carbon or brown carbon? The nature of light-absorbing carbonaceous aerosols, Atmos. Chem. Phys., 6, 3131–3148, doi:10.5194/acp-6-3131-2006, 2006.
Atkinson, R., Aschmann, S. M., and Arey, J.: Reactions of OH and NO3radicals with phenol,
cresols, and 2-nitrophenol, at 296±2 K, Environ. Sci. Technol., 26, 1397–1403, 1992.
15
Barnard, J. C., Volkamer, R., and Kassianov, E. I.: Estimation of the mass absorption cross section of the organic carbon component of aerosols in the Mexico City Metropolitan Area, Atmos. Chem. Phys., 8, 6665–6679, doi:10.5194/acp-8-6665-2008, 2008.
Bahreini, R., Keywood, M. D., Ng, N. L., Varutbangkul, V., Gao, S., Flagan, R. C., Seinfeld, J. H., Worsnop, D. R., and Jimenez, J. L.: Measurements of secondary organic aerosol from
oxida-20
tion of cycloalkenes, terpenes, and m-xylene using an Aerodyne aerosol mass spectrometer, Environ. Sci. Technol., 39, 5674–5688, 2005.
Bohren, C. F. and Huffman, D. R., Absorption and Scattering of Light by Small Particles, John-Wiley & Sons Inc., New York, 1983.
Bond, T.: Spectral dependence of visible light absorption by carbonaceous particles emitted
25
from coal combustion, Geophys. Res. Lett., 28, 4075–4078, 2001.
Bond, T. C. and Bergstrom, R. W.: Light absorption by carbonaceous particles: an investigative review, Aerosol Sci. Technol., 40, 27–67, 2006.
Bones, D. L., Henricksen, D. K., Mang, S. A., Gonsior, M., Bateman, A. P., Nguyen, T. B., Cooper, W. J., and Nizkorodov, S. A.: Appearance of strong absorbers and fluorophores in
ACPD
12, 14551–14589, 2012Complex refractive index of toluene-SOA
T. Nakayama et al.
Title Page
Abstract Introduction
Conclusions References
Tables Figures
◭ ◮
◭ ◮
Back Close
Full Screen / Esc
Printer-friendly Version Interactive Discussion
Discussion
P
a
per
|
Dis
cussion
P
a
per
|
Discussion
P
a
per
|
Discussio
n
P
a
per
|
limonene-O3secondary organic aerosol due to NH+4-mediated chemical aging over long time
scales, J. Geophys. Res., 115, D05203, doi:10.1029/2009JD012864, 2010.
Cappa, C. D., Che, D. L., Kessler, S. H., Kroll, J. H., and Wilson, K. R.: Variations in organic aerosol optical and hygroscopic properties upon heterogeneous OH oxidation, J. Geophys. Res., 116, D15204, doi:10.1029/2011JD015918, 2011.
5
Chang, J. L. and Thompson, J. E.: Characterization of colored products formed during irradi-ation of aqueous solutions containing H2O2and phenolic compounds, Atmos. Environ., 44, 541–551, 2010.
Chen, Y. and Bond, T. C.: Light absorption by organic carbon from wood combustion, Atmos. Chem. Phys., 10, 1773–1787, doi:10.5194/acp-10-1773-2010, 2010.
10
Chen, J., Wenger, J. C., and Venables, D. S.: Near-ultraviolet absorption cross section of nitro-phenols and their potential influence on tropospheric oxidation capacity, J. Phys. Chem. A, 115, 12235–12242, 2011.
Cheng, Y., He, K.-B., Zheng, M., Duan, F.-K., Du, Z.-Y., Ma, Y.-L., Tan, H., Yang, F.-M., Liu, J.-M., Zhang, X.-L., Weber, R. J., Bergin, M. H., and Russell, A. G.: Mass absorption efficiency
15
of elemental carbon and water-soluble organic carbon in Beijing, China, Atmos. Chem. Phys., 11, 11497–11510, doi:10.5194/acp-11-11497-2011, 2011.
Coeur-Tourneur, C., Henry, F., Janquin, M.-A., and Brutier, L.: Gas-phase reaction of hydroxyl radicals withm-,o- andp-cresol, Int. J. Chem. Kinet., 38, 553–562, 2006.
Dinar, E., Abo Riziq, A., Spindler, C., Erlick, C., Kissc, G., and Rudich, Y.: The complex refractive
20
index of atmospheric and model humic-like substances (HULIS) retrieved by a cavity ring down aerosol spectrometer (CRD-AS), Faraday Discuss., 137, 279–295, 2008.
Drewnick, F., Hings, S. S., DeCarlo, P. F., Jayne, J. T., Gonin, M., Fuhrer, K., Weimer, S., Jiminez, J. L., Demerjian, K. L., Borrmann, S., and Worsnop, D. R.: A new time-of-flight aerosol mass spectrometer (ToF-AMS) – instrument description and first field deployment,
25
Aerosol Sci. Tech., 39, 637–658, 2005.
Favez, O., Alfaro, S. C., Sciare, J., Cachier, H., and Abdelwahab, M. M.: Ambient measurements of light-absorption by agricultural waste burning organic aerosols, J. Aerosol Sci., 40, 613– 620, 2009.
Finlayson-Piits, B. J. and Pitts Jr., J. N.: Chemistry of the Upper and Lower Atmosphere,
Aca-30
demic Science Press, New York, 2000.
ACPD
12, 14551–14589, 2012Complex refractive index of toluene-SOA
T. Nakayama et al.
Title Page
Abstract Introduction
Conclusions References
Tables Figures
◭ ◮
◭ ◮
Back Close
Full Screen / Esc
Printer-friendly Version Interactive Discussion
Discussion
P
a
per
|
Dis
cussion
P
a
per
|
Discussion
P
a
per
|
Discussio
n
P
a
per
|
carbonaceous aerosols observed at Jeju Island; 3-laser photoacoustic spectrometer, par-ticle sizing, and filter analysis, Atmos. Chem. Phys., 10, 10387–10398, doi:10.5194/acp-10-10387-2010, 2010.
Forstner, H. J. L., Flagan, R. C., and Seinfeld, J. H.: Secondary organic aerosol from the photooxidation of aromatic hydrocarbons: molecular composition, Aerosol Sci. Technol., 31,
5
1345–1358, 1997.
Galloway, M. M., Chhabra, P. S., Chan, A. W. H., Surratt, J. D., Flagan, R. C., Seinfeld, J. H., and Keutsch, F. N.: Glyoxal uptake on ammonium sulphate seed aerosol: reaction products and reversibility of uptake under dark and irradiated conditions, Atmos. Chem. Phys., 9, 3331– 3345, doi:10.5194/acp-9-3331-2009, 2009.
10
Graber, E. R. and Rudich, Y.: Atmospheric HULIS: How humic-like are they? A comprehensive and critical review, Atmos. Chem. Phys., 6, 729–753, doi:10.5194/acp-6-729-2006, 2006. Hallquist, M., Wenger, J. C., Baltensperger, U., Rudich, Y., Simpson, D., Claeys, M.,
Dom-men, J., Donahue, N. M., George, C., Goldstein, A. H., Hamilton, J. F., Herrmann, H., Hoff -mann, T., Iinuma, Y., Jang, M., Jenkin, M. E., Jimenez, J. L., Kiendler-Scharr, A.,
Maen-15
haut, W., McFiggans, G., Mentel, Th. F., Monod, A., Pr ´ev ˆot, A. S. H., Seinfeld, J. H., Sur-ratt, J. D., Szmigielski, R., and Wildt, J.: The formation, properties and impact of sec-ondary organic aerosol: current and emerging issues, Atmos. Chem. Phys., 9, 5155–5236, doi:10.5194/acp-9-5155-2009, 2009.
Henze, D. K., Seinfeld, J. H., Ng, N. L., Kroll, J. H., Fu, T.-M., Jacob, D. J., and Heald, C. L.:
20
Global modeling of secondary organic aerosol formation from aromatic hydrocarbons: high-vs. low-yield pathways, Atmos. Chem. Phys., 8, 2405–2420, doi:10.5194/acp-8-2405-2008, 2008.
Hoffer, A., Gelencs ¨er, A., Guyon, P., Kiss, G., Schmid, O., Frank, G. P., Artaxo, P., and Andreae, M. O.: Optical properties of humic-like substances (HULIS) in biomass-burning
25
aerosols, Atmos. Chem. Phys., 6, 3563–3570, doi:10.5194/acp-6-3563-2006, 2006.
Jacobson, M. Z.: Isolating nitrated and aromatic aerosols and nitrated aromatic gases as sources of ultraviolet light absorption, J. Geophys. Res., 104, 3527–3542, 1999.
Jang, M. and Kamens, R. M.: Characterization of secondary aerosol from the photooxidation of toluene in the presence of NOx and 1-propene, Environ. Sci. Technol., 35, 3626–3639,
30
2001.
ACPD
12, 14551–14589, 2012Complex refractive index of toluene-SOA
T. Nakayama et al.
Title Page
Abstract Introduction
Conclusions References
Tables Figures
◭ ◮
◭ ◮
Back Close
Full Screen / Esc
Printer-friendly Version Interactive Discussion
Discussion
P
a
per
|
Dis
cussion
P
a
per
|
Discussion
P
a
per
|
Discussio
n
P
a
per
|
mixtures and the effect of isoprene and sulfur dioxide, J. Geophys. Res., 113, D09303, doi:10.1029/2007JD009426, 2008.
Kim, H., Barkey, B., and Paulson, S. E.: Real refractive indices ofα- andβ-pinene and toluene secondary organic aerosols generated from ozonolysis and photo-oxidation, J. Geophys. Res., 115, D24212, doi:10.1029/2010JD014549, 2010.
5
Kirchstetter, T. W., Novakov, T., and Hobbs, P. V.: Evidence that the spectral dependence of light absorption by aerosols is affected by organic carbon, J. Geophys. Res., 109, D21208, doi:10.1029/2004JD004999, 2004.
Kleindienst, T. E., Conver, T. S., McIver, C. D., and Edney, E. O.: Determination of secondary organic aerosol products from the photooxidation of toluene and their implications in ambient
10
PM2.5, J. Atmos. Chem., 47, 79–100, 2004.
Klotz, B., Sørensen, S., Barnes, I., Becker, K. H., Etzkorn, T., Volkamer, R., Platt, U., Wirtz, K., and Mart´ın-Reviejo, M.: Atmospheric oxidation of toluene in a large-volume outdoor photore-actor: in situ determination of ring-retaining product yields, J. Phys. Chem. A, 102, 10289– 10299, 1998.
15
Koch, R., Knispel, R., Elend, M., Siese, M., and Zetzsch, C.: Consecutive reactions of aromatic-OH adducts with NO, NO2 and O2: benzene, naphthalene, toluene, m- and p-xylene,
hexamethylbenzene, phenol, m-cresol and aniline, Atmos. Chem. Phys., 7, 2057–2071, doi:10.5194/acp-7-2057-2007, 2007.
Kondo, Y., Morino, Y., Fukuda, M., Kanaya, Y., Miyazaki, Y., Takegawa, N., Tanimoto, H.,
McKen-20
zie, R., Johnston, P., Blake, D. R., Murayama, T., and Koike, M.,: Formation and transport of oxidized reactive nitrogen, ozone, and secondary organic aerosol in Tokyo, J. Geophys. Res., 113, D21310, doi:10.1029/2008JD010134, 2008.
Laskin, J., Laskin, A., Roach, P. J., Slysz, G., Anderson, G. A., Nizkorodov, S. A., Bones, D. L., and Nguyen, L. Q.: High-resolution desorption electrospray ionization mass spectrometry for
25
chemical characterization of organic aerosols, Anal Chem., 82, 2048–2058, 2010.
Moosm ¨uller, H., Chakrabarty, R. K., and Arnott, W. P.: Aerosol light absorption and its measure-ment: a review, J. Quant. Spectrosc. Ra., 110, 844–878, 2009.
Moosm ¨uller, H., Chakrabarty, R. K., Ehlers, K. M., and Arnott, W. P.: Absorption ˚Angstr ´om coefficient, brown carbon, and aerosols: basic concepts, bulk matter, and spherical particles,
30
Atmos. Chem. Phys., 11, 1217–1225, doi:10.5194/acp-11-1217-2011, 2011.


![Fig. 6. [NO x ] ini dependence of the (a) real and (b) imaginary parts of the RI values at 405 and 532 nm for the toluene-SOAs and (c) HRNO 3 /HROrg and O/C ratios measured by the H-ToF-AMS](https://thumb-eu.123doks.com/thumbv2/123dok_br/16383874.192139/36.918.167.545.34.485/dependence-imaginary-values-toluene-soas-hrorg-ratios-measured.webp)

