ACPD
10, 20303–20327, 2010A subsiding regional forest fire aerosol
layer
I. G. Mc Kendry et al.
Title Page
Abstract Introduction
Conclusions References
Tables Figures
◭ ◮
◭ ◮
Back Close
Full Screen / Esc
Printer-friendly Version Interactive Discussion
Discussion
P
a
per
|
Dis
cussion
P
a
per
|
Discussion
P
a
per
|
Discussio
n
P
a
per
|
Atmos. Chem. Phys. Discuss., 10, 20303–20327, 2010 www.atmos-chem-phys-discuss.net/10/20303/2010/ doi:10.5194/acpd-10-20303-2010
© Author(s) 2010. CC Attribution 3.0 License.
Atmospheric Chemistry and Physics Discussions
This discussion paper is/has been under review for the journal Atmospheric Chemistry and Physics (ACP). Please refer to the corresponding final paper in ACP if available.
A subsiding regional forest fire aerosol
layer at Whistler, BC: implications for
interpretation of mountaintop chemistry
observations
I. G. Mc Kendry1, J. Gallagher1, P. Campuzano Jost2, A. Bertram2, K. Strawbridge3, R. Leaitch4, and A. M. Macdonald4
1
Department of Geography, The University of British Columbia, Vancouver, Canada
2
Department of Chemistry, The University of British Columbia, Vancouver, Canada
3
Centre for Atmospheric Research Experiments, Environment Canada, Egbert, Canada
4
Science and Technology Branch, Environment Canada, 4905 Dufferin Street, Toronto, Ontario, Canada
Received: 19 July 2010 – Accepted: 18 August 2010 – Published: 27 August 2010 Correspondence to: I. G. Mc Kendry ([email protected])
ACPD
10, 20303–20327, 2010A subsiding regional forest fire aerosol
layer
I. G. Mc Kendry et al.
Title Page
Abstract Introduction
Conclusions References
Tables Figures
◭ ◮
◭ ◮
Back Close
Full Screen / Esc
Printer-friendly Version Interactive Discussion
Discussion
P
a
per
|
Dis
cussion
P
a
per
|
Discussion
P
a
per
|
Discussio
n
P
a
per
|
Abstract
On 30 August 2009, intense forest fires in interior BC, together with synoptic scale meteorological subsidence and easterly winds resulted in transport of a broad forest fire plume across southwestern BC. The physico-chemical and optical characteristics of the plume as observed from Saturna island (AERONET), CORALNet-UBC and the
5
Whistler Mountain air chemistry facility were consistent with forest fire plumes that have been observed elsewhere in continental North America. However, the importance of smoke plume subsidence in relation to the interpretation of mountaintop chemistry observations is highlighted on the basis of deployment both aCL31ceilometer and a single particle mass spectrometer (SPMS) in a mountainous setting. The SPMS was
10
used to identify the biomass plume based on levoglucosan and potassium markers. Data from the SPMS are also used to show that the biomass plume was correlated with nitrate, but not correlated with sulphate or sodium. This study not only provides baseline measurements of biomass burning plume physico-chemical characteristics in western Canada, but also highlights the importance oflidar remote sensing methods
15
in the interpretation of mountaintop chemistry measurements.
1 Introduction
Biomass burning plays an important role in the climate system and is the second largest source of anthropogenic aerosols (IPCC, 2007a). Aerosols produced from the burn-ing of forests, grasslands and crops scatter and absorb solar radiation (direct effect)
20
while also influencing cloud processes by acting as cloud condensation nuclei (indirect effect). Biomass burning also is a source of air pollution and may seriously degrade visibility regionally (e.g. Pahlow et al., 2005). Regional forest fires were a dominant feature of the summers of 2008 and 2009 in western North America and are predicted to increase in frequency and severity under global warming scenarios (IPCC, 2007b).
ACPD
10, 20303–20327, 2010A subsiding regional forest fire aerosol
layer
I. G. Mc Kendry et al.
Title Page
Abstract Introduction
Conclusions References
Tables Figures
◭ ◮
◭ ◮
Back Close
Full Screen / Esc
Printer-friendly Version Interactive Discussion
Discussion
P
a
per
|
Dis
cussion
P
a
per
|
Discussion
P
a
per
|
Discussio
n
P
a
per
|
Physical, chemical and optical properties of biomass burning plumes have been studied extensively in a variety of global settings. This work is exhaustively reviewed by Reid et al. (2005 a, b). In summary, approximately 80–90% of smoke aerosol volume is typically in the accumulation mode (particle diameter<1 µm) with smoke particles pri-marily composed of organic carbon (50–60%) and black carbon (5–10%). However, the
5
properties of smoke vary between fires, and are dependent on such variables as fuel type and moisture, combustion phase, and wind conditions. Furthermore, the physi-cal, chemiphysi-cal, and optical properties of biomass-burning aerosols can change rapidly as they disperse. Typically, aged smoke particles are larger and more spherical than their fresh counterparts (Reid et al., 2005b). For example, aged particles typically have
10
mean diameters ranging from 0.12–0.23 µm, with a mean around 0.18 µm, whereas fresh particles typically have a mean diameter of 0.12 µm.
As with other sources of transported aerosol, such as volcanic and desert aerosols, smoke plumes are subject to meteorological processes that tend to concentrate plumes into layer structures (McKendry and Lundgren, 2000). Previous studies in
southwest-15
ern Canada indicate that crustal dust plumes from both Asia and Sahara are subject to large scale subsidence (McKendry et al., 2007, 2008) and mountain wave activ-ity (Hacker et al., 2001), whilst regional smoke plumes from California are trapped by mid-tropospheric inversions (McKendry et al., 2010) .
Development of pollutant layers and their vertical movement has important
impli-20
cations for the interpretation of chemistry data from mountaintop observatories. At such stations, which are frequently assumed to be in the free troposphere (FT), con-siderable effort is directed at identifying boundary layer (BL) influences. This is often based on the interpretation of diurnal variability in various entities deemed to be BL tracers such as water vapour, or short-lived chemical species (e.g. Obrist et al., 2008;
25
ACPD
10, 20303–20327, 2010A subsiding regional forest fire aerosol
layer
I. G. Mc Kendry et al.
Title Page
Abstract Introduction
Conclusions References
Tables Figures
◭ ◮
◭ ◮
Back Close
Full Screen / Esc
Printer-friendly Version Interactive Discussion
Discussion
P
a
per
|
Dis
cussion
P
a
per
|
Discussion
P
a
per
|
Discussio
n
P
a
per
|
stratified by trajectory (i.e. pollutant concentration×windspeed represents a flux with units gm−2s−1).
Herein, a multi-day smoke episode at Whistler, BC is documented on the basis of observations of mountaintop chemistry at Whistler Mountain, novel deployment of a mountainside mini-lidar (VaisalaCL31Ceilometer) and ancilliary remote sensing data
5
(Lidar and sunphotometer) from Vancouver and Saturna Island. Primary objectives of this combined meteorological and chemical analysis are to:
– Show the critical importance of vertical transport processes (subsidence) in inter-pretation of mountain-top chemistry observations.
– Characterize the physico-chemical and optical characteristics of regional scale
10
plumes in southwestern BC using lidar and single particle mass spectrometry.
– Demonstrate the utility of remote vertical profiling methodologies to the interpre-tation of mountaintop chemistry observations.
This study is part of a wider project designed to better understand atmospheric aerosol in this region, to better understand trans-Pacific transport of pollution from Asia to
West-15
ern Canada and to improve understanding of the chemical properties of aerosols in the lower FT.
2 Methods 2.1 Ceilometer
The Vaisala CL31 Ceilometer is described in detail in M ¨unkel et al. (2007). Briefly,
20
ACPD
10, 20303–20327, 2010A subsiding regional forest fire aerosol
layer
I. G. Mc Kendry et al.
Title Page
Abstract Introduction
Conclusions References
Tables Figures
◭ ◮
◭ ◮
Back Close
Full Screen / Esc
Printer-friendly Version Interactive Discussion
Discussion
P
a
per
|
Dis
cussion
P
a
per
|
Discussion
P
a
per
|
Discussio
n
P
a
per
|
onto the receiver. For this study, the ceilometer was operated at the maximum vertical resolution of 5 m with a measurement interval of 3 s and a reporting interval of 60 s. This temporal resolution was deemed sufficient for analyzing the development of BL structure and lower FT features.
Although originally designed to determine cloud heights, in recent years ceilometers
5
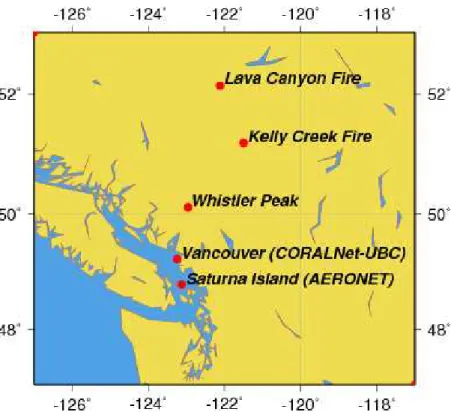
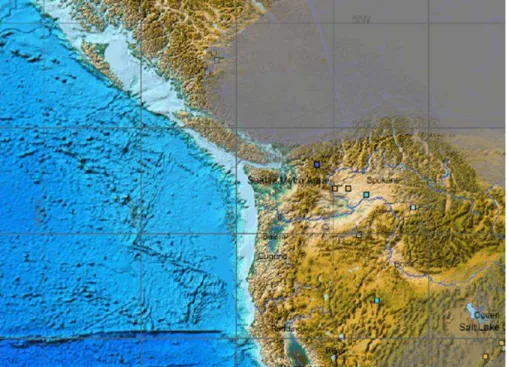
have been used for determining BL structure by taking the backscatter intensity of the returned laser light as a proxy for ground-sourced aerosol concentrations (Rsnen et al., 2000; Emeis et al., 2004; Zephoris et al., 2005; van der Kamp et al., 2008; McKendry et al., 2009, 2010). Previous studies in the Vancouver Region (see Figure 1) have demonstrated the capability of the CL31 for identifying elevated pollutant layers and
10
smoke plumes (McKendry et al., 2009). For this study the ceilometer was deployed at an elevation of 810 m (a.m.s.l.) on the lower slopes of Whistler Mountain (at the Timing Flats). The ceilometer was installed and operated by Environment Canada as part of a data collection effort related to meteorological services for the 2010 Olympic Winter Games.
15
2.2 Lidar
Additional regional information on the smoke event was derived from 1064/532 nm Li-dar observations from the University of British Columbia (part of the Canadian Op-erational Research Lidar Network (CORALNet) – http://www.coralnet.ca/). The lidar systems deployed for CORALNet use identical transmitter and receiver assemblies
20
and where necessary are housed in a modified cargo trailer. The trailer modifications include a roof hatch assembly, basic meteorological tower, radar interlock system, cli-mate control system and leveling stabilizers. The unit can be operated via an internet link and requires an external power source. A precipitation sensor is used to operate the roof hatch and three pan/tilt webcams capture sky conditions and monitor the lidar
25
ACPD
10, 20303–20327, 2010A subsiding regional forest fire aerosol
layer
I. G. Mc Kendry et al.
Title Page
Abstract Introduction
Conclusions References
Tables Figures
◭ ◮
◭ ◮
Back Close
Full Screen / Esc
Printer-friendly Version Interactive Discussion
Discussion
P
a
per
|
Dis
cussion
P
a
per
|
Discussion
P
a
per
|
Discussio
n
P
a
per
|
The laser is the new Continuum Inlite III (small footprint) laser operating at 1064/532 nm with a pulse repetition rate of 10 Hz. The energy output is approximately 150 mJ @ 532 nm and 130 mJ @ 1064 nm. The system emits two wavelengths and measures a return signal at three channels (1064 nm, 532 both polarizations).
2.3 Single Particle Mass Spectrometer (SPMS)
5
An ion trap based single particle MS was built for deployment at the top of Whistler Peak. This instrument follows broadly the design principles of the UT-ATOFMS de-scribed by Su et al. (2004). As in that instrument, it incorporates a) an aerosol lens as a vacuum interface, particle concentrator and focusing device, b) dual aerosol scatter-ing devices operatscatter-ing at 532 nm for aerosol sizscatter-ing and mass spectrometer triggerscatter-ing
10
and c) a pulsed dual polarity mass spectrometer incorporating an ablation/ionization laser operating at 266 nm for ionization of the particles. While the details of the in-strument are discussed in a separate publication (Campuzano-Jost and Bertram, in preparation), the main differences compared to the ATOFMS relevant to this study are briefly listed here:
15
– Aerosol sizing module is fully independent of mass spectrometer operation, allow-ing the acquisition of full particle distributions to compare with standard aerosol instrumentation (Simpson et al., 2009).
– A real-time triggering solution for the ionization laser that ensures consistent beam quality and hence greatly reduces shot to shot fluctuations – (Hanna et
20
al., 2009).
– An ionization region about four times larger than in the Su et al. (2009) design, which should improve MS collection efficiency in some cases.
– A 3-D ion trap for mass analysis. This results in a smaller footprint MS module with a robust mass calibration, high sensitivity, and reduced space charge effects.
ACPD
10, 20303–20327, 2010A subsiding regional forest fire aerosol
layer
I. G. Mc Kendry et al.
Title Page
Abstract Introduction
Conclusions References
Tables Figures
◭ ◮
◭ ◮
Back Close
Full Screen / Esc
Printer-friendly Version Interactive Discussion
Discussion
P
a
per
|
Dis
cussion
P
a
per
|
Discussion
P
a
per
|
Discussio
n
P
a
per
|
It also allows for tandem mass spectrometry (Simpson et al., 2009), which was not used in this study.
While the full mass range of the ion trap MS is roughly 10–200m/z, for the data ac-quired for this paper only a reduced mass range of 10–100m/z was used. This limits somewhat the analysis of more complex smoke markers.
5
2.4 Whistler mountaintop chemistry
Measurements of particles and trace gases are made at a high elevation site in Whistler, BC, approximately 100 km north of Vancouver (Fig. 1). The site is located at the top of a ski resort at Whistler Mountain, at a height of 2182 m (a.m.s.l.) and is operated by Environment Canada. There are no continuous combustion sources at the
10
peak and occasional influences from maintenance vehicles operating on the mountain have been identified and removed from the data set.
Condensation nuclei (CN) are observed using a TSI 3025 Ultrafine Condensation Particle Counter, which measures number concentration of particles larger than ap-proximately 3 nm diameter. The TSI 3025 uses butanol as a condensing fluid to
en-15
large the particles to a size that can be detected by an optical sensor. Particle size distributions were measured using a MSP Corporation Wide Range Aerosol Spectrom-eter, which combines a differential mobility analyzer and an optical particle counter to measure from about 0.01 µm to 20 µm diameter. Here, we use only the number con-centrations of particles greater than about 0.4 µm diameter.
20
2.5 Saturna Island sunphotometer
AEROCAN CIMELs (AEROCAN is the Canadian sub-network of AERONET) have been important in tracing the transport and characteristics of aerosol layers over British Columbia and, in general, over AEROCAN/AERONET sites across North America (e.g. Thulasiraman et al., 2002). The AEROCAN site on Saturna Island site (Figure 1) is
ap-25
ACPD
10, 20303–20327, 2010A subsiding regional forest fire aerosol
layer
I. G. Mc Kendry et al.
Title Page
Abstract Introduction
Conclusions References
Tables Figures
◭ ◮
◭ ◮
Back Close
Full Screen / Esc
Printer-friendly Version Interactive Discussion
Discussion
P
a
per
|
Dis
cussion
P
a
per
|
Discussion
P
a
per
|
Discussio
n
P
a
per
|
acquire solar radiances which are transformed into three processing levels of Aerosol Optical Thickness (AOT) (1.0 – non-cloud screened, 1.5 – cloud screened and 2.0 – cloud screened and quality assured) across eight spectral channels (340, 380, 440, 500, 670, 870, 1020 and 1640 nm). In a separate operational mode, almucanter sky radiances are collected across four channels (440, 670, 870, and 1020 nm) at a
nom-5
inal sampling resolution which is about 1/20 of the nominal AOT sampling resolution (an hour versus 3 min). The sky radiances, along with AOT estimates at the same four channels, are used to perform inversions for particle size distribution and refractive index (Dubovik et al., 2000).
2.6 Ancilliary data
10
To complement aerosol observations from the summit of Whistler Mountain, hourly PM2.5 data were obtained from the BC Ministry of Environment’s air quality station in the Whistler Valley (Whistler Meadow Park, 641 m a.m.s.l.). Weather maps for the rel-evant time periods were created from NCEP pressure level reanalysis datasets, avail-able from NOAA’s Earth System Research Laboratory (http://www.esrl.noaa.gov/psd/
15
data/gridded/reanalysis).
3 Results
3.1 Background meteorology and fire history
During summer 2009, persistent large-scale weather patterns in North America were responsible for the unusually warm and dry season experienced in southern British
20
ACPD
10, 20303–20327, 2010A subsiding regional forest fire aerosol
layer
I. G. Mc Kendry et al.
Title Page
Abstract Introduction
Conclusions References
Tables Figures
◭ ◮
◭ ◮
Back Close
Full Screen / Esc
Printer-friendly Version Interactive Discussion
Discussion
P
a
per
|
Dis
cussion
P
a
per
|
Discussion
P
a
per
|
Discussio
n
P
a
per
|
observed in the region in late July, including 34.4◦C at Vancouver International Airport (an all-time record high). A significant consequence of this weather pattern was the very active forest fire season that occurred in BC and the northwestern US.
In southwestern British Columbia, in addition to several minor fires, the largest fires (see Fig. 1) were the Kelly Creek Fire near Clinton (reported at 13 572 ha on 28 August)
5
and the Lava Canyon Fire near Williams Lake (reported at 33 815 ha on 26 August). In addition to numerous large fires east of the Coast Mountains, two small fires were reported on Blackcomb Mountain within a few kilometres of observing sites on Whistler Mountain. Thus, degraded air quality from smoke was a common occurrence through-out the summer in sthrough-outhern BC. At times, easterly to northerly wind flows aloft advected
10
smoke through the Whistler area and into Metro Vancouver.
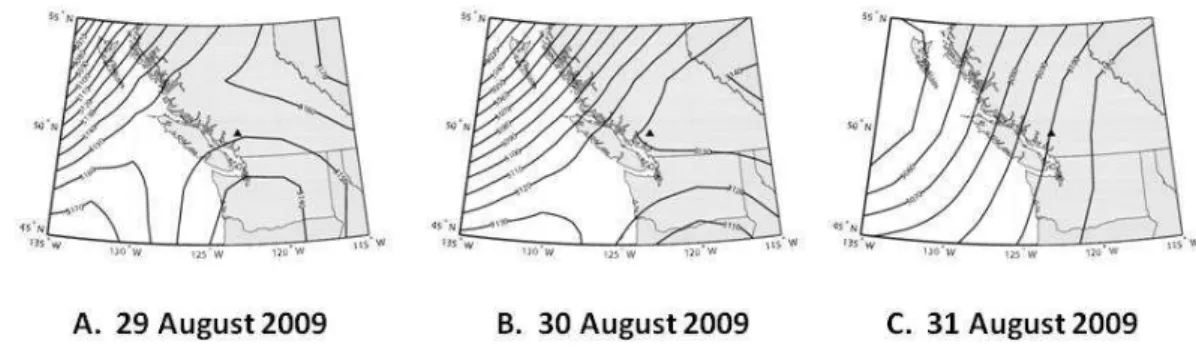
Synoptic weather patterns during the final three days of August resulted in advection of forest fire smoke from southern British Columbia fires (including Kelly Creek, Notch Hill and Lava Creek) westward to Whistler Mountain. This westward transport was associated with a cyclonic circulation situated over the northwestern United States that
15
was evident in both 500 hPa (not shown here) and 700 hPa patterns (Fig. 2) on 29 and 30 August. On 31 August, the low continued inland as low pressure in the northeast Pacific approached the coast, changing the flow over Whistler to southerly.
Between the inland and offshore cyclonic circulations, a ridge of high pressure was apparent at both 500 hPa and 700 hPa . On 30 August, this ridge was oriented
20
southwest-northeast directly over Whistler (Fig. 2b). A maximum in dynamic subsi-dence (positiveω, expressed in Pa s−1) is found downstream of the ridge axis (Figure 3a) and centered over southwestern BC. Ceilometer observations of the smoke plume (Fig. 5b) show a corresponding subsidence rate of ∼1.7 cm s−1 at Whistler over the morning period of 30 August. At the surface, the synoptic scale forcing was rather
25
weak, with a high pressure ridge just offshore of British Columbia (Fig. 3b).
ACPD
10, 20303–20327, 2010A subsiding regional forest fire aerosol
layer
I. G. Mc Kendry et al.
Title Page
Abstract Introduction
Conclusions References
Tables Figures
◭ ◮
◭ ◮
Back Close
Full Screen / Esc
Printer-friendly Version Interactive Discussion
Discussion
P
a
per
|
Dis
cussion
P
a
per
|
Discussion
P
a
per
|
Discussio
n
P
a
per
|
Clinton-area fires to the Whistler area. On the 30th, easterly winds continued to advect the smoke plume westward as dynamic subsidence forced the plume to descend at the same time. On 31 August, the flow aloft turned southerly and the smoke gradually retreated to the north.
Satellite derived smoke detection products from the National Environmental Satellite
5
Data and Information Service (NESDIS found online at – http://map.ngdc.noaa.gov/ website/firedetects/viewer.htm) show the regional smoke distribution in the period 29– 31 August with a wide swath of smoke extending westward to Vancouver in the south and northward into central British Columbia (Fig. 4).
3.2 Lidar and ceilometer
10
The combination of CORALNet-UBC (Vancouver) lidar imagery, Whistler mountain-side ceilometer imagery and Whistler mountaintop chemistry measurements provide a novel opportunity to examine both the regional and local scale processes associ-ated with the subsidence of smoke layers. In Fig. 5a, CORALNet-UBC 1064 nm im-agery shows a pattern broadly consistent with that observed by ceilometer at Whistler
15
(Fig. 5b). A dense smoke layer capped below 3000 m a.s.l. was evident over Vancouver on 30 August 2009. Rates of subsidence (∼1.7 cm s−1) and midday BL mixing patterns are also similar to those observed by the Whistler ceilometer and suggest that the evo-lution of the smoke layer at Whistler was characteristic of a broad regional pattern, albeit modified by local topographic effects. Whistler mountaintop CN particle
concen-20
trations and nearby valley floor PM2.5observations (Fig. 5c) were negatively correlated
over the 30–31 August period during which the smoke layer was observed to subside below Whistler Peak. As the layer intercepted the peak at∼03:00 LST on 30 August, CN values spiked and then declined rapidly as the layer moved below the elevation of Whistler Peak. On both 30 and 31 August valley floor PM2.5concentrations reached a
25
maximum around midday of∼30 µg m−3.
ACPD
10, 20303–20327, 2010A subsiding regional forest fire aerosol
layer
I. G. Mc Kendry et al.
Title Page
Abstract Introduction
Conclusions References
Tables Figures
◭ ◮
◭ ◮
Back Close
Full Screen / Esc
Printer-friendly Version Interactive Discussion
Discussion
P
a
per
|
Dis
cussion
P
a
per
|
Discussion
P
a
per
|
Discussio
n
P
a
per
|
gradient and clear skies allowed thermally induced mesoscale flows to dominate the wind pattern in Whistler Valley. Diurnally-reversing slope and valley winds are common in mountainous terrain under such conditions (Whiteman, 2000). Observations from surface weather stations in the area indicate that diurnal winds occurred during the three days of this study (for brevity, these observations are not presented here). At
5
the valley floor observing location, calm winds were observed in the morning hours, followed by southerly (up-valley) winds in the afternoon, which increased to∼5 ms−1 in the late afternoon. Reports from several of Environment Canada’s Olympic Auto-station Network (OAN) sites on the slopes of Whistler Mountain also indicate diurnal flows: winds with an easterly (downslope) component occurred overnight, and winds
10
with a westerly (upslope) component were dominant during the daytime. Two effects of this wind pattern were likely important to the observed impact of forest fire smoke in the lower elevations of the valley: 1) the slope winds facilitated vertical mixing that was otherwise limited by stable stratification in the lower troposphere; 2) the afternoon up-valley breeze effectively removed much of the smoke from the valley. Evidence for
15
both of these effects can be found in the ceilometer data (Fig. 5b). Enhanced returns in the lowest 500 m around midday are likely due to PM that was mixed downward out of the main smoke plume. The much lower returns found in the lowest 800 m after 17:00 LST indicate cleaner air arriving from up-valley flow. Wind observations in the area are limited, but it is likely that, on days with a well-developed valley wind, marine
20
air reaches Whistler from the head of Howe Sound (approximately 35 km to the south). However, pollutants can be returned to the Whistler Valley during the overnight hours by down-valley winds and ground-level PM concentrations can then increase as the shallow nocturnal boundary layer limits mixing.
3.3 Optical characteristics and physico-chemical composition of smoke
25
ACPD
10, 20303–20327, 2010A subsiding regional forest fire aerosol
layer
I. G. Mc Kendry et al.
Title Page
Abstract Introduction
Conclusions References
Tables Figures
◭ ◮
◭ ◮
Back Close
Full Screen / Esc
Printer-friendly Version Interactive Discussion
Discussion
P
a
per
|
Dis
cussion
P
a
per
|
Discussion
P
a
per
|
Discussio
n
P
a
per
|
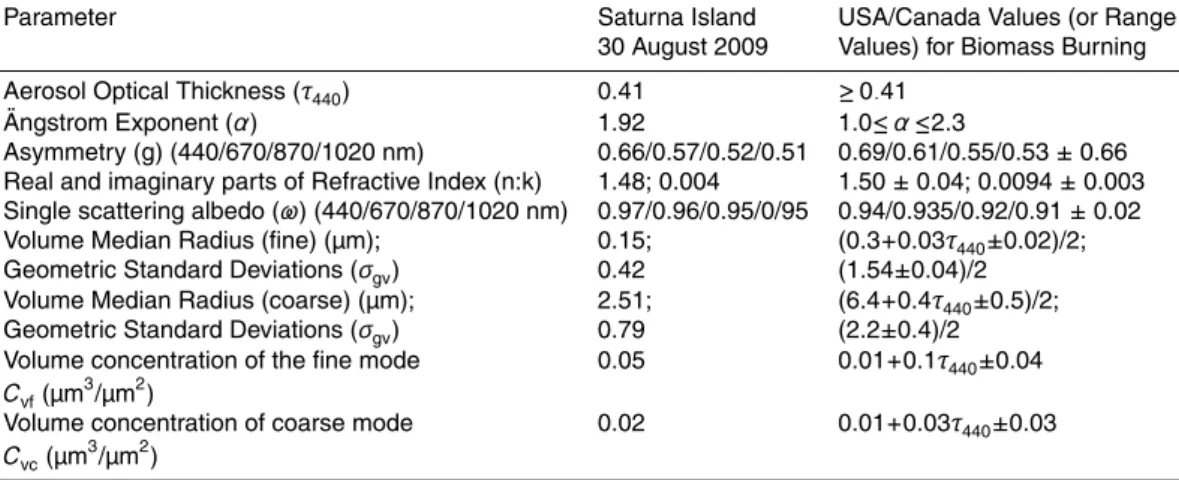
are compared with typical North American biomass burning values as summarized by Reid et al. (2005b). Note, the final four rows describe a bimodal size distribution and show the dominance of the accumulation mode as expected for a forest fire plume. Other optical parameters are remarkably consistent with those reported by Reid et al. (2005b) based on AERONET inversions for North American boreal forest biomass
5
burning aerosol.
The SPMS was operating at Whistler Peak between 22 August 2009 and 6 Septem-ber 2009. During this time period, it was only operated during hours when an operator could access it. Therefore the SPMS dataset is limited to daily periods of about 4– 6 h between roughly 11:00 a.m. and 06:00 p.m. PDT. During the smoke period, roughly
10
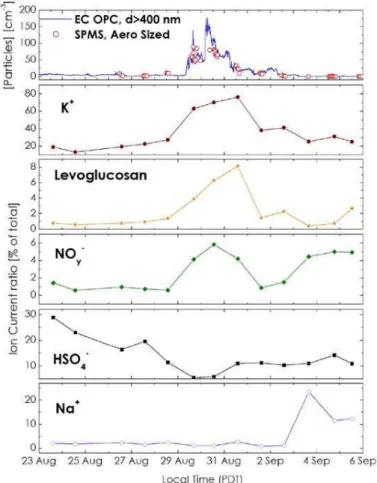
1 million particles were sampled and sized over the three day period (∼20 h). Total particle concentrations acquired by the SPMS show a steep increase in particle con-centration with the plumes’ arrival. They were consistent with data acquired by the OPC operating at Whistler Peak, once the detection limit/efficiency of the SPMS was taken into account (Fig. 6, top panel), giving us confidence that the SPMS sampled a
15
representative aerosol distribution.
Mass spectra (161 000 for the smoke period) were background corrected and inte-grated with unit mass resolution. They were then classified as valid aerosol spectra if at least one particular mass showed an ion current at least 4x above the standard deviation of the noise. Based on this criterion, about 75 000 (47% of acquired) valid
20
MS spectra were included in the final analysis.
The smoke plume was characterized with a variety of well-established markers that were computed on a particle by particle basis for the fraction of valid mass spectra. In order to account for fluctuations in both ionization efficiency and detector gain, all markers were normalized to the total ion current derived from the particle. Finally, for
25
clarity, daily averages were computed.
ACPD
10, 20303–20327, 2010A subsiding regional forest fire aerosol
layer
I. G. Mc Kendry et al.
Title Page
Abstract Introduction
Conclusions References
Tables Figures
◭ ◮
◭ ◮
Back Close
Full Screen / Esc
Printer-friendly Version Interactive Discussion
Discussion
P
a
per
|
Dis
cussion
P
a
per
|
Discussion
P
a
per
|
Discussio
n
P
a
per
|
(1,6-anhydro-β-D – glucopyranose) is a product of cellulose combustion and is well known and stable tracer of biomass burning (Qin et al., 2006 as well as references therein). Aged biomass is also often associated with elevated levels of sulphate (neg-ative m/z 81 and 97), nitrate (negative m/z 46 and 62) and organics (Murphy et al., 2006). Finally, sodium (Na, positivem/z 23) has been sometimes identified in biomass
5
burning plumes, although it seems to be highly dependent on the source of the biomass (Hudson et al., 2004). Figure 6b–f show the daily average ratios of these markers in the smoke plume as well as before and after it with the exception of the organics and black carbon marker. The organics marker (positive m/z 27, 29, 37, see Silva et al., 2001) was discarded due to the aluminum isobar (m/z 27) which was likely present in
10
some dust and pollution events before and after the plume. The black carbon marker was discarded due to its poor expression throughout the sampling period. This is likely due to the overlap of other organic fragments (Murphy et al., 2006).
Figure 6 shows that the aerosol chemistry at Whistler Peak did indeed change during the 29–31 August period with large increases in the relative amounts of potassium and
15
levoglucosan. This is consistent with previous observations of biomass plumes (Qin et al., 2006; Hudson et al., 2004). A significant increase in nitrate is also observed, as would be expected for an aerosol from a source about 100 km away. On the other hand, another aging marker, sulphate, decreases. This probably simply reflects the high levels of sulphate that were present in the background aerosol both before and
20
after the plume. Lastly, no increase is observed for sodium (the increase of this marker around 4 September is due to an influx of Pacific air at the site). As stated before, this might be just a function of the specific composition of BC wood and soil.
4 Discussion and conclusions
Based on the mountaintop observations of chemical constituents alone, the natural
in-25
ACPD
10, 20303–20327, 2010A subsiding regional forest fire aerosol
layer
I. G. Mc Kendry et al.
Title Page
Abstract Introduction
Conclusions References
Tables Figures
◭ ◮
◭ ◮
Back Close
Full Screen / Esc
Printer-friendly Version Interactive Discussion
Discussion
P
a
per
|
Dis
cussion
P
a
per
|
Discussion
P
a
per
|
Discussio
n
P
a
per
|
above and below the mountaintop station and persisted over multiple days. Interpre-tation of time series of chemical constituents at mountaintop sites therefore requires careful meteorological analysis of vertical motion in relation to layer structures as well as boundary layer growth. Lidar has been used in previous boundary layer studies in mountainous terrain, but in most cases the data have been collected for only short time
5
periods via either aircraft or temporary ground installations (e.g. Reuten et al., 2005; de Wekker et al., 2004). This study confirms that permanentlidar installations in moun-tainous location can add value to other atmospheric observations from the same area and are crucial to the understanding of vertical transport processes and the analysis of chemical time series.
10
This study also highlights the importance of synoptic scale weather patterns on the character of air masses sampled at a mountaintop observatory. Studies using a syn-optic classification scheme for the European Alps have demonstrated the effects of different circulation patterns and wind directions on aerosol and trace gas measure-ments at the Jungfraujoch observatory in Switzerland (e.g. Lugauer et al., 1998; Forrer
15
et al., 2000). For the Whistler site, this case is a good example of an easterly wind flow (not common at this location) transporting regionally produced aerosol loads to the site. While the Whistler observatory is well-situated to sample air masses coming offthe Pacific Ocean in prevailing westerlies, it is important to recognize times when the synoptic pattern produces trajectories with relatively long residence times over the
20
North American continent. Thus, synoptic scale flow and the more local boundary layer influence should both be considered when characterizing the air mass sampled at a mountain observatory for a particular time period.
In addition to chemically confirming the presence of smoke at Whistler, deployment of a SPMS instrument at Whistler peak represents a significant addition to the suite of
in-25
ACPD
10, 20303–20327, 2010A subsiding regional forest fire aerosol
layer
I. G. Mc Kendry et al.
Title Page
Abstract Introduction
Conclusions References
Tables Figures
◭ ◮
◭ ◮
Back Close
Full Screen / Esc
Printer-friendly Version Interactive Discussion
Discussion
P
a
per
|
Dis
cussion
P
a
per
|
Discussion
P
a
per
|
Discussio
n
P
a
per
|
addition of this instrument to the Whistler suite of observations promises to significantly increase understanding of the provenance and chemical properties of aerosols in the lower FT in western Canada. On the basis of this and similar cases, future efforts will be directed toward permanent installation of a CORALNet lidar at Whistler to support the investigation of aerosol transport from hemispheric to local scales.
5
Acknowledgements. We thank Norm O’Neill and Alain Royer and their stafffor establishing and maintaining the Saturna Island sites used in this investigation and also the Cloud Physics and Severe Weather Research Section of Environment Canada for making the Whistler ceilometer available for aerosol research through the summer of 2009. We are grateful for the financial and in-kind support provided by Environment Canada, the Natural Sciences and Engineering
10
Research Council, the BC Ministry of Environment, The Canadian Foundation for Innovation, and the Canadian Foundation for Climate and Atmospheric Sciences. Special thanks also go to the University of British Columbia and in particular to Seane Trehearne at Totem Field, and Michael Travis and Bernard Firanski of Environment Canada.
References
15
Baltensperger, U., Gaggeler, H., Jost, D., Lugauer, M., Schwikowski, M., Weingartner, E., and Seibert, P.: Aerosol climatology at the high-alpine site Jungfraujoch, Switzerland, J. Geo-phys. Res., 102, 19707–19715, 1997.
Campuzano-Jost, P. and Bertram, A. K.: An ion trap based single particle MS for high altitude research, in preparation, 2010.
20
De Wekker, S. F., Steyn, D., and Nyeki, S.: A comparison of aerosol-layer and convective boundary-layer structure over a mountain range during STAAARTE ’97, Bound.-Lay. Meteo-rol., 113, 249–271, 2004.
Dubovik, O., Smirnov, A., Holben, B., et al.: Accuracy assessments of aerosol optical properties retrieved from Aerosol Robotic Network (AERONET) sun and sky radiance measurements,
25
J. Geophys. Res., 105(D8), 9791–9806, 2000.
ACPD
10, 20303–20327, 2010A subsiding regional forest fire aerosol
layer
I. G. Mc Kendry et al.
Title Page
Abstract Introduction
Conclusions References
Tables Figures
◭ ◮
◭ ◮
Back Close
Full Screen / Esc
Printer-friendly Version Interactive Discussion
Discussion
P
a
per
|
Dis
cussion
P
a
per
|
Discussion
P
a
per
|
Discussio
n
P
a
per
|
Forrer, J., R ¨uttimann, R., Schneiter, D., Fischer, A., Buchmann, B., and Hofer, P.: Variability of trace gas measurements at the high-alpine site Jungfraujoch caused by meteorological transport processes, J. Geophys. Res., 105, 12241–12251, 2000.
Hacker, J. P., McKendry, I. G., and Stull, R. B.: Modeled downward transport of Asian dust over Western North America during April 1998, J. Appl. Meteorol., 40, 1617–1628, 2001.
5
Hanna, S. J., Campuzano-Jost, P., Simpson, E. A., Robb, D. B., Burak, I., Blades, M. W., Hepburn, J. W., and Bertram, A. K.: A new broadly tunable (7.4–10.2 eV) laser based VUV light source and its first application to aerosol mass spectrometry, Int. Jo. Mass Spectrom., 279, 134–146, 2009.
Hudson, P. K., Murphy, D. M., Cziczo, D. J., Thomson, D. S., deGouw, J. A., Warneke,
10
C.,Holloway, J., Jost, H.-J., and H ¨ubler, G.: Biomass burning particle measurements: Characteristic composition and chemical processing, J. Geophys. Res., 109, D23S27, doi:10.1029/2003JD004398, 2004.
IPCC: Contribution of Working Group I to the Fourth Assessment Report of the Intergovern-mental Panel on Climate Change, edited by: Solomon, S., Qin, D., Manning, M., Chen, Z.,
15
Marquis, M., Averyt, K. B., Tignor, M. and Miller, H .L., Cambridge University Press, Cam-bridge, United Kingdom and New York, NY, USA, 2007a.
IPCC: Contribution of Working Group II to the Fourth Assessment Report of the Intergovern-mental Panel on Climate Change, edited by: Parry, M. L., Canziani, O. F., Palutikof, J. P., van der Linden, P. J., and Hanson, C. E., Cambridge University Press, Cambridge, United
20
Kingdom and New York, NY, USA, 2007b.
Leaitch, W. R., Macdonald, A. M., Anlauf, K. G., Liu, P. S. K., Toom-Sauntry, D., Li, S.-M., Liggio, J., Hayden, K., Wasey, M. A., Russell, L. M., Takahama, S., Liu, S., van Donkelaar, A., Duck, T., Martin, R. V., Zhang, Q., Sun, Y., McKendry, I., Shantz, N. C., and Cubison, M.: Evidence for Asian dust effects from aerosol plume measurements during INTEX-B 2006 near Whistler,
25
BC, Atmos. Chem. Phys., 9, 3523–3546, doi:10.5194/acp-9-3523-2009, 2009.
Lugauer, M., Baltensperger, U., Furger, M., G ¨aggeler, H., Jost, D., Schwikowski, M., and Wan-ner, H.: Aerosol transport to the high Alpine sites Jungfraujoch (3454 m asl) and Colle Gnifetti (4452 m a.s.l.), Tellus, Series B, 50B, 76–92, 1998.
McKendry, I. G., Macdonald, A. M., Leaitch, W. R., van Donkelaar, A., Zhang, Q., Duck, T.,
30
and Martin, R. V.: Trans-Pacific dust events observed at Whistler, British Columbia during INTEX-B, Atmos. Chem. Phys., 8, 6297–6307, doi:10.5194/acp-8-6297-2008, 2008.
ACPD
10, 20303–20327, 2010A subsiding regional forest fire aerosol
layer
I. G. Mc Kendry et al.
Title Page
Abstract Introduction
Conclusions References
Tables Figures
◭ ◮
◭ ◮
Back Close
Full Screen / Esc
Printer-friendly Version Interactive Discussion
Discussion
P
a
per
|
Dis
cussion
P
a
per
|
Discussion
P
a
per
|
Discussio
n
P
a
per
|
complex and/or coastal terrain – a review, Progress in Physical Geography, 24, 359–384, 2000.
McKendry, I. G., Strawbridge, K., O’Neill, N., Macdonald, A. M., Liu, P., Jaegle, L., Jaffe, D., Fairlie, D., Anlauf, K., and Westphal, D.: A Case of Trans-Pacific Transport of Saharan Dust to Western North America, J. Geophys. Res., 112, D01103, doi:10.1029/2006JD007129,
5
2007.
McKendry, I. G., van der Kamp, D., Strawbridge, K. B., Christen, A., and Crawford, B.: Simulta-neous observations of boundary-layer aerosol layers with CL31 ceilometer and 1064/532 nm lidar, Atmos. Environ., 43(36), 5847–5852, 2009.
Munkel, C., Eresmaa, N., Rasanen, J., and Karppinen, A.: Retrieval of mixing height and dust
10
concentration with lidar ceilometer, Bound.-Lay. Meteorol., 124(1), 117–128, 2007.
Murphy, D. M., Cziczo, D. J., Froyd, K. D., Hudson, P. K., Matthew, B. M., Middlebrook, A. M., Peltier, R. E., Sullivan, A., Thomson, D. S., and Weber, R. J.: Single-particle mass spectrometry of tropospheric aerosol particles, J. Geophys. Res., 111, D23S32, doi:10.1029/2006JD007340, 2006.
15
Obrist, D., Hallar, A. G., McCubbin, I., Stephens, B. B., and Rahn, T.: Atmospheric mercury concentrations at Storm Peak Laboratory in the Rocky Mountains: Evidence for long-range transport from Asia, boundary layer contributions, and plant mercury uptake, Atmos. Envi-ron., 42, 7579–7589, 2008.
Qin, X. and Prather, K. A.: Impact of biomass emissions on particle chemistry during the
Cali-20
fornia Regional Particulate Air Quality Study, Int. J. Mass Spectrom., 258, 142–150, 2006. Rsnen, J., Lnnqvist, J., and Piironen, A.: Urban boundary layer measurements with a
commer-cial ceilometer. In: Proc. 3rd Symp. on Urban Environment 15 to 18 August 2000, Davis CA, American Meteorological Society, Boston, vol 5.1, 34, 2000.
Reid, J. S., Koppmann, R., Eck, T. F., and Eleuterio, D. P.: A review of biomass burning
emis-25
sions part II: intensive physical properties of biomass burning particles, Atmos. Chem. Phys., 5, 799–825, doi:10.5194/acp-5-799-2005, 2005a.
Reid, J. S., Eck, T. F., Christopher, S. A., Koppmann, R., Dubovik, O., Eleuterio, D. P., Hol-ben, B. N., Reid, E. A., and Zhang, J.: A review of biomass burning emissions part III: intensive optical properties of biomass burning particles, Atmos. Chem. Phys., 5, 827–849,
30
doi:10.5194/acp-5-827-2005, 2005b.
ACPD
10, 20303–20327, 2010A subsiding regional forest fire aerosol
layer
I. G. Mc Kendry et al.
Title Page
Abstract Introduction
Conclusions References
Tables Figures
◭ ◮
◭ ◮
Back Close
Full Screen / Esc
Printer-friendly Version Interactive Discussion
Discussion
P
a
per
|
Dis
cussion
P
a
per
|
Discussion
P
a
per
|
Discussio
n
P
a
per
|
116, 37–61, 2005.
Silva, P. J., Liu, D.-Y., Noble, C. A., and Prather, K. A.: Size and Chemical Characterization of Individual Particles Resulting from Biomass- burning of Local Southern California Species, Environ. Sci. Technol., 33(18), 3068–3076, 1999.
Simpson, E. A., Campuzano-Jost, P., Hanna, S. J., Robb, D. B., Hepburn, J. W., Blades, M. W.,
5
and Bertram, A. K.: A laser desorption-electron impact ionization ion trap mass spectrometer for real-time analysis of single atmospheric particles, Int. J. Mass Spectrom., 281, 140–149, 2009.
Su, Y., Sipin, M. F., Furutanu, H., and Prather, K. A.: Development and Characterization of an Aerosol Time-of-Flight Mass Spectrometer with Increased Detection Efficiency, Anal. Chem.,
10
76, 712–719, 2004.
Thulasiraman, S., O’Neill, N. T., Royer, A., Holben, B. N., Westphal, D. L., and McArthur, L. J. B.: Sunphotometric observations of the 2001 Asian dust storm over Canada and the U.S., Geophys. Res. Lett., 29(8), 1255, doi:10.1029/2001GL014188, 2002.
van der Kamp, D., McKendry, I. G., Wong, M., and Stull, R.: Lidar Ceilometer Observations
15
and Modeling of a Fireworks Plume in Vancouver, British Columbia, Atmos. Environ., 42, 7174–7178, 2008.
van der Kamp, D. and McKendry, I. G.: Comparison of Tethered Balloon Vertical Profiles of Par-ticulate Matter Size Distributions with Lidar Ceilometer Backscatter in the Nocturnal Urban Boundary Layer, Int. J. Environ. Pollut., 41(1/2), 155–165, 2010.
20
Weiss-Penzias, P., Jaffe, D. A., Swartzendruber, P., Dennison, J. B., Chand, D., Hafner, W., and Prestbo, E.: Observations of Asian air pollution in the free troposphere at Mount Bachelor Observatory during the spring of 2004, J. Geophys. Res., 111, D10304, doi:10.1029/2005JD006522, 2006.
Whiteman, C. D.; Mountain Meteorology: Fundamentals and Applications, Oxford University
25
Press, 355, 2000.
ACPD
10, 20303–20327, 2010A subsiding regional forest fire aerosol
layer
I. G. Mc Kendry et al.
Title Page
Abstract Introduction
Conclusions References
Tables Figures
◭ ◮
◭ ◮
Back Close
Full Screen / Esc
Printer-friendly Version Interactive Discussion
Discussion
P
a
per
|
Dis
cussion
P
a
per
|
Discussion
P
a
per
|
Discussio
n
P
a
per
|
Table 1. Summary Comparison of AERONET daily values for 30 August 2009 at Saturna Island and biomass burning aerosol optical properties from Reid et al. (2005b) summary (Ta-ble 3) of worldwide AERONET network of ground-based radiometers. In the right column are Boreal Forest Biomass burning properties from USA and Canada. The middle column shows AERONET daily values for 30 August 2009.
Parameter Saturna Island USA/Canada Values (or Range of 30 August 2009 Values) for Biomass Burning
Aerosol Optical Thickness (τ440) 0.41 ≥0.41 ¨
Angstrom Exponent (α) 1.92 1.0≤α≤2.3
Asymmetry (g) (440/670/870/1020 nm) 0.66/0.57/0.52/0.51 0.69/0.61/0.55/0.53±0.66 Real and imaginary parts of Refractive Index (n:k) 1.48; 0.004 1.50±0.04; 0.0094±0.003 Single scattering albedo (ω) (440/670/870/1020 nm) 0.97/0.96/0.95/0/95 0.94/0.935/0.92/0.91±0.02 Volume Median Radius (fine) (µm); 0.15; (0.3+0.03τ440±0.02)/2; Geometric Standard Deviations (σgv) 0.42 (1.54±0.04)/2 Volume Median Radius (coarse) (µm); 2.51; (6.4+0.4τ440±0.5)/2; Geometric Standard Deviations (σgv) 0.79 (2.2±0.4)/2 Volume concentration of the fine mode 0.05 0.01+0.1τ440±0.04
Cvf(µm3/µm2)
Volume concentration of coarse mode 0.02 0.01+0.03τ440±0.03
Cvc(µm 3
ACPD
10, 20303–20327, 2010A subsiding regional forest fire aerosol
layer
I. G. Mc Kendry et al.
Title Page
Abstract Introduction
Conclusions References
Tables Figures
◭ ◮
◭ ◮
Back Close
Full Screen / Esc
Printer-friendly Version Interactive Discussion
Discussion
P
a
per
|
Dis
cussion
P
a
per
|
Discussion
P
a
per
|
Discussio
n
P
a
per
|