Vol-7, Special Issue-Number2-April, 2016, pp619-628 http://www.bipublication.com
Case Report
Estimate of Market Risk Premium by Considering the Market Leverage in
Tehran Stock Exchange
1
Hamid Reza Shammakhi, 2Mansur Rouze'ei, and 3Shahin Kargar
1
Assistant Professor, Islamshahr branch, Islamic Azad University, Islamshahr, Iran
2
Faculty member of Amin Police University, Tehran, Iran
3
MA in Financial Management, Islamshahr branch, Islamic Azad University, Islamshahr, Iran
Email: [email protected]
ABSTRACT
In this study, the method of calculating the market risk premium with respect to the market leverage was presented and it was studied which method has the accuracy of better estimate in Tehran Stock Exchange. This study seeks to provide and introduce more appropriate and accurate measures in order to measure market risk premium in order to better predict the expected return on the investment in the Tehran Stock Exchange. Returns expected by investors of the stocks of companies with high leverage are more than any other stocks with low leverage. Creditors have a higher priority against the company’s assets and cash money which contributes to an increase in the investors’ risk and therefore it would increase the expected returns and efficiency. Three types of definition and subsequently three CAPM models of Ibbotson, Lally and Siegel were introduced to calculate and evaluate market risk premium, and its accuracy in forecasting investors’ expected returns was tested. In this regard, based on simple random sampling and based on Cochran formula data collected from 69 firms listed in the Tehran Stock Exchange from 2008 to 2014 with panel data model, three-month returns of the sample companies were calculated and used as the basis for the test. The results show that Lally model (leverage effect of the market) compared with Ibbotson and Siegel models explained the strong stock market returns.
Key words: market risk premium, market leverage, Ibbotson model, Lally model and Siegel model.
INTRODUCTION
Investment in stocks, has more risk than other investments in other types of securities, therefore the expected return on the investment is more than other investments. Shareholders do not have any priority on the company's assets in bankruptcy until the final settlement and instead their scores are in gaining risk premium. The capital asset pricing model (CAPM) developed by Sharpe Lintner Mucin, market risk premium is the excess market return relative to the risk-free return. Market risk premium is significantly discussed in financial management literature and is an important factor in determining the expected return on CAPM model. Good estimate
return is considered as the discount rate and the market value of Stock portfolio is estimated by discounting expected future cash dividends. In the Residual Income Model is derived from Dividend Discount Model, equity value is the sum of equity book value and the present value of expected abnormal earnings. The method of time varying was introduced by Merton (1980), and accordingly, market risk premium changes in different time horizon. Lally (2002) developed Merton's model to estimate the market risk premium. Of course, the working basis of Lally was Miller and Modigliani model (1958) and based on this model, the effect of market leverage (the ratio of companies’ debt to the equity) on market risk premium was evaluated and the new model was presented accordingly (Marsden, 2005).
Statement of the problem and Significance of the study
The issue of studying market risk premium is by taking into account the market leverage in Tehran Stock Exchange. The research in estimating the market risk premium is in a way that managers can help the investment portfolio and investors optimize investment in the Stock Exchange. In other words, the fundamental issue of the research is to consider the equities and the sum of companies’ debt in Tehran Stock Exchange to calculate the market leverage and risk-free return is sovereign and corporate participation papers. Therefore, to estimate the market risk premium, the stocks of the companies listed in Tehran Stock Exchange is investigated.
The importance of the issue is due to growing value of the Stock Exchange and trying to direct it towards efficiency. The efficiency of Tehran Stock Exchange will help to lead the public financial resources towards economic activities that have the technical and economic feasibility. On the other hand, the importance of the issue refers to opportunities that will be created due to the absence of an appropriate standard to determine the expected rate of return. If there is no suitable criterion to determine the risk premium in Tehran Stock Exchange, in this
more or less than their actual value and also productive projects are not carefully and economically assessed.
Corporates’ use of financial leverage (debt creation) in Tehran Stock Exchange due to the long distance of cost of financing through banks and stock markets leads to the willingness of companies to leverage. However, this leverage increases the risk and companies’ differences in using leverage, leads to investors’ differences in expected returns. Therefore, by considering the market leverage and market risk premium, returns expected by investors can be measured better.
A review of the literature and theoretical foundations
Various theories based on the efficient market hypothesis try to justify the investors’ behaviors. Stock portfolio theory, capital asset pricing model (CAPM), Fama and French three-factor model, Arbitrage pricing model and the representation theory are of these models. Investment managers, Stock portfolio managers, and other real and legal persons trading stocks and other capital assets in the stock market, needs to study various factors affecting investment returns in different economic conditions to maintain and increase the value of their investment portfolio. CAPM model is based on the assumption that investors using the theory of Stock portfolio and reducing systemic risk, according to their degree of risk aversion, choose one of the stock efficient baskets. In this model, the expected investment return rate is directly related to risk, in other words, if the investor tolerates more risk, more efficiency also will be expected.
criticized by other researchers and other methods are also presented. Calculating the market risk premium is used extensively in financial calculations and financial analysis including analysis of investment (capital budgeting), valuation of securities, analysis of costs and benefits, financial status, and more. Ibbotson and Sinquefield (1976) presented a model to measure the annual risk premium for long-term horizon in markets of America for the first time.
Their assumption was that market risk premium is stable in a long-term and their model was also presented on the same basis. Their research involved information of the years of 1926 and 1974, and was used for years by academic researchers and financial analysts. According to this model, the market risk premium of 7.9% for the year of 2000 was predicted which was not too different from the actual number is 6%. In this model the market return was the return of S & P 500 index which has not had dividends since then and the final results were presented based on market values and adjusted values based on inflation.
f M I
R
R
P
R
M
ˆ
I
P
R
M
ˆ
= Ibbotson estimator for market risk premiumM
R
= The arithmetic mean of market returnf
R
= The arithmetic mean risk-free returnMuch criticism was proposed for the method such as the lack of stability in market structure in the long term, the computational error through the arithmetic average, and certain events.
Jerry Siegel (1992) criticized the method of taking into account the inflation rate presented by Ibbotson. In the period of the research, the inflation rate was high (especially in 1965 and 1985) and therefore the market risk premium rate has been biased upwards. In the case of treasury bills, inflation was ineffective while it was effective on the stock expected return. This is why the manner suggested by Siegel is the average account after deducting the expected return on risk-free rate of return on the market
(instead of the arithmetic average risk-free rate of return by Ibbotson method).
f m
S
R
R
P
R
M
ˆ
S
P
R
M
ˆ
= Ibbotson estimator for market risk premiumM
R
= The arithmetic mean of market returnf
R
= Estimating the risk-free returnThe value obtained through Sigel method will be less than the value obtained through Ibbotson method. For example, the value obtained through Sigel method for New Zealand for the period between 1802 and 1990 was half the value obtained through Sigel method (2004 a, b). Pablo Fernandez (2009) conducted his research through sending 7500 e-mails in the ninth and tenth January 2009 about the use percent and method to estimate the market risk premium.
The e-mails were sent to economic and financial experts and 1161 answers were received in the twelfth February 2009, from which 752 people submitted a model for estimating the market risk premium. The geographical distribution of incoming mail were 5/6% in the US, 3/5% in Europe, 4/5% to Canada, 6/5%, the UK, 9/5%, Australia.
Martin Lally (2002) introduced Time-Varying Market Risk Premium (MRP) Estimator for market risk premium in which the cost of capital and the companies’ leverage were considered. In other words, due to changes in corporate debt ratio (the ratio of total debt to total enterprise value of companies), market risk premium has changed, and the more amount of market leverage and financial risk raises, the expected returns will also increase more. He called the right course to determine the risk-free rate of return which is the same as treasury bills the five-year because of the useful asset's life used during this period.
)
S
B
)(
R
R
(
)
S
B
)(
R
R
(
MRP
mt mt f d mt
mt f
u m
t
1
m
R
= The arithmetic mean of the market in the long-term rate of return is constant in all theyears
u m
R
= The arithmetic mean of the market rate of return regardless of market leveragef
R
= The average rate of free-risk return Bmt = Total debt of interest-bearing liabilities of companies listed on the stock exchange in t year Smt = Total equity of companies listed on the stock exchange in t year
Rdt = the rate of corporate participation papers
d
R
= The mean of corporate participation papersThe following formula was used to calculate Rmu:
mt t m
mt mt dt mt u mt
S
B
S
B
R
R
R
1
)
(
Chay (1993, 1995) by investigated Ibbotson method methods in production companies and to form the stock portfolio used randomization and stage procedures. The statistical society included companies listed in New Zealand Stock Exchange and the study period was the years of 1993-1995. He totally formed 93 stock portfolios as investment baskets. Each stock portfolio was made up of 146 companies that were selected without replacement. The aim of this study was to evaluate the efficiency of Ibbotson model compared to the standard CPM method. After statistical analysis, it was concluded that the Ibbotson model was slightly better than the standard CAPM model for decision making for investors.
Price water house Coopers (2002) conducted a study about the comparison of Sigel model and standard CAPM model. The aim of this study was to determine the reliability and usefulness of the model compared to the standard CAPM model. In this study, the Central information of the institute was used. The study period was the years of 1992- 2002. The statistical population was companies listed in America Stock
Exchange (AMEX) with the number of 193 companies. After statistical analysis, the results showed that the function of the standard CAPM model is not only strong, but the evidence is quite supportive. The average operating efficiency of the market in the period was not significant. Beta coefficient (β) was considered a strong factor in explaining the expected returns and the end result indicated that the expected returns does not depend on the factors in the Siegel model. Bahandar (198
8) showed that the companies with high leverages (the ratio of debt on equity) compared to the companies with low leverages in the period of 1948-1979 had higher returns mean. This result after inclusion of beta and firm size as explanatory variables was also remained. High leverage increases the degree of risk of the company's stock; however, this risk should be reflected in beta coefficient greater explanatory. His results showed contrast to the predictions of the CAPM model. This result also remained in place after inclusion of beta and firm size as explanatory variables. High leverage increases the risk degree of company's stock, but this risk should be reflected in beta coefficient greater explanatory. The results showed the contrast with the predictions of CAPM model.
Harris and Marston (1992) by predicting the five-year growth rates and analysis of equity stock for the period of 1991-1982 for US Exchange Stock estimated the mean of the market risk premium of 6.47% for the periods. Danny Bao (2008) also compared Ibbotson and Lally from New Zealand Stock Exchange from 1960 to 2005 and concluded that in total, these two methods are not significantly different and they had significant differences only in situations where the use of leverage is increased in the stock company.
Research questions
model along with Conventional models are useful to assist investors in Tehran Stock Exchange optimal investment decisions. Lally made some changes in the above capital asset pricing model and called it Lali changed pricing model in which interest-bearing debt named market leverage was particularly paid attention. The researcher is going to answer the question if applying Lally Modelin Stock Exchange improves the prediction of stock returns or not. To answer the above question the following hypotheses are proposed and tested:
First hypothesis: The expected market returns,
according to the Lally model (considering the market leverage) compared with the conventional methods of Ibbotson and Siegel predicts market real returns with fewer errors. Second hypothesis: Market risk premium has
positive correlation with actual market return compared to correlation between market risk premium and with actual market return in models of Ibbotson and Siegel's methods. The following formula is used to calculate the market risk premium in normal CAPM method:
f
m
R
R
MRP
In this case, the market return (
R
m) in thethree-month time horizons and risk-free return
(
R
f ) in the three-month time horizons were used. Therefore, both numbers will change over time. The following formula is used to calculate the market risk premium by Sigel’s method:f m
S
R
R
P
R
M
ˆ
In this case, the market return (
R
m) wascalculated As the arithmetic mean of 5 years which also is assumed constant over time and
risk-free return (
R
f ) was also used in the three-month time horizons. The following formula is used to calculate the market risk premium by Lally’s method:)
)(
(
)
1
)(
(
mt mt f d mt
mt f
u m t
S
B
R
R
S
B
R
R
MRP
MRPt = Market risk premium at t time by Lalai’s method
m
R
= The arithmetic mean of the market return (TEPIX) for the years 2008 to 2014 which is fixed in all years.u m
R
= The arithmetic mean of the market return (TEPIX) regardless of leveragef
R
= The mean rate of risk-free return forgovernment participation papers for funding Bmt = Total expense debt of companies listed on Tehran Stock Exchange in t year
Smt = Total equity of companies listed on Tehran Stock Exchange in t year
Rdt = the rate of corporate participation papers R d = the mean of corporate
participation papers
The following formula was used to calculate Rmu:
mt t m
mt mt dt mt u mt
S
B
S
B
R
R
R
1
)
(
The following formula is used to calculate the market risk premium by Ibbotson’s method:
f m
S
R
R
P
R
M
ˆ
In this case, the market return (
R
m) andrisk-free return (
R
f ) were calculated as thearithmetic mean of 5 years which also is assumed constant over time in the three-month time horizons in the three-month time horizons were used. Therefore, both numbers will change over time.
Population and sample
has been screened. Those business units that their fiscal year ends in March and within the years of 2008 to 2014 its stock has been in turnover and their 3-month financial statements have been prepared should be selected and those business units that lack the aforementioned conditions should be eliminated. With regard to screening and 95% of confidence level the sample size was obtained from the following formula:
2 2 2 22 2
2
.
1
.
.
x x
Z
N
Z
N
n
In which: N: size of population, n: sample size, 2
x
: variance society,
2: error estimation,2
2
Z
: The normal explanation of the level oferror. The amount of N equal to 185 companies,
2
2
Z
is error estimation of 5% which equals to1.96. Awareness of
x2 is inevitable to replace the formula. To calculate
x2, among the methods available, initial sample was selected from the statistical community and using calculated standard deviations for selecting a sample of companies available in CD information of Stock Exchange, preliminary sample variance was calculated by Excelsoftware to be used as an estimate of
x2 whichnumber 2 (20.794)was obtained. By entering figures into the formula samples to be characterized as follows:
185
1
5
1
.
96
20
.
794
69
794
.
20
96
.
1
185
2 2
2
2 2
n
In this study, 69 companies were selected from companies listed on the Tehran Stock Exchange. To select a sample, the simple random sampling (without replacement) was used. The range of this study was 6 years from the beginning of 2008 until the end of 2014. From the four data collection and information tools, measuring
tools used in this research, tools refer to the documentation (such as software RAHAVARD of new stock, CD of the information of Exchange services companies, the Internet and magazines) were used.
Methodology
To test the hypothesis and to evaluate the predictive ability of the market risk premium by Lally model, it was defined twice. In this regard, the 7-year period was divided into two sub-intervals. Under the first interval (base period) that are in research models, ID, consisted of lots 20 three-month periods (from 2002 to 2007) and second interval which are in models, ID+1 consisted of 8 three-month periods (2008 to 2014) which are defined as estimation period. Thus, the market risk premium based on real information and returns of 69 companies belonging to the ID, 20 three-month periods, the value of
and
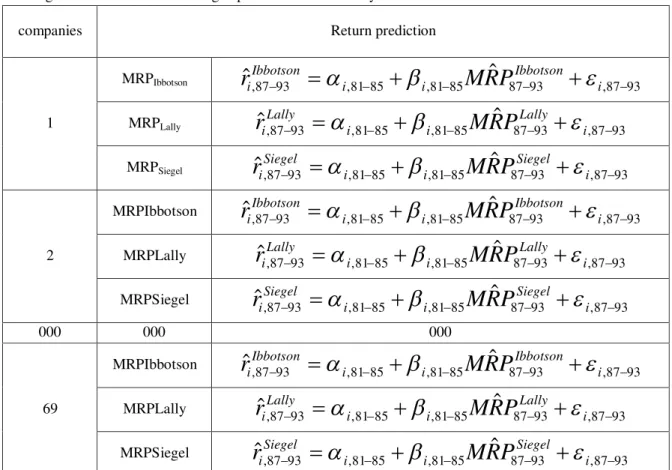
was measured for regression.Based on the obtained coefficient, returns of the period ID + 1, the 8 three-month periods in three methods of Ibbotson, Sigel and Lally were predicted. This was calculated for each company through the 3 models and then with the actual numbers of returns the ID + 1 period was compared and the estimation error was obtained. At the end, the method with the less estimation error was introduced as a more accurate method. General scheme and describing the steps briefly include:
1. First, for 20 three-month periods (base period ID) returns of 69 companies as the dependent variable and the market risk premium as the independent variable were calculated. By implementation of regression models, the relationship between stock returns (the dependent variable) and the market risk premium (independent variable), were studied. Thus, at this stage, clear models were selected. General regression model is generally defined as follows:
85 81 , 85 81 85
81 , 85 81 , 85 81
,
i
i
i i
MRP
Table 1: Regression model to investigate the relationship between stock returns and market risk premium for the years of 2002 to 2006
Durbin Watson test was used to investigate the classical hypothesis and to ensure no correlation between wastes, Wight correction for variance inconsistency separation and F test was used to specify regression models. Also, t-test was used for significance test of independent variable coefficients. 2. For estimation period (ID + 1) using the coefficients obtained from estimated regression model of 20 three-month period, expected return of each company was estimated. Also, estimated value of Lally
method for market risk premium (
M
R
ˆ
P
86Lally87) is considered in this equation estimated separately. Forother methods, it can be defined in a similar way.
87 86 , 87 86 85 81 , 85 81 , 87 86 ,
ˆ
ˆ
iLally
i
i M
R
P
Lally
i r
Table 2: Regression model of estimating expected returns for the years of 2008 to 2014
Return prediction companies 93 87 , 93 87 85 81 , 85 81 , 93 87 ,
ˆ
ˆ
iIbbotson
i
i M
R
P
Ibbotson
i r
MRPIbbotson
1
MRPLally
r
ˆ
iLally,8793
i,8185
i,8185M
R
ˆ
P
87Lally93
i,879393 87 , 93 87 85 81 , 85 81 , 93 87 ,
ˆ
ˆ
iSiegel
i
i M
R
P
Siegel
i r
MRPSiegel 93 87 , 93 87 85 81 , 85 81 , 93 87 ,
ˆ
ˆ
Ibbotson
i ii Ibbotson
i
M
R
P
r
MRPIbbotson
2
MRPLally
r
ˆ
iLally,8793
i,8185
i,8185M
R
ˆ
P
87Lally93
i,879393 87 , 93 87 85 81 , 85 81 , 93 87 ,
ˆ
ˆ
iSiegel
i
i M
R
P
Siegel
i r
MRPSiegel 000 000 000 93 87 , 93 87 85 81 , 85 81 , 93 87 ,
ˆ
ˆ
iIbbotson
i
i M
R
P
Ibbotson
i r
MRPIbbotson
69
MRPLally
r
ˆ
iLally,8793
i,8185
i,8185M
R
ˆ
P
87Lally93
i,879393 87 , 93 87 85 81 , 85 81 , 93 87 ,
ˆ
ˆ
iSiegel
i
i M
R
P
Siegel
i r
MRPSiegel
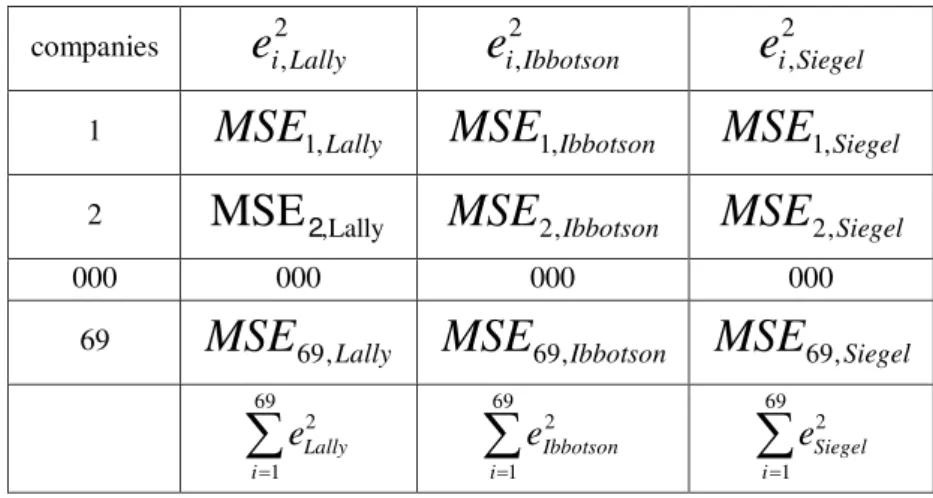
To determine which of the models mentioned has greater accuracy in determining the expected return on the stock, estimation error values get calculated and each one with squared fewer errors, will be selected as a better model.
al i Lally i Lally
i
r
r
e
ˆ
,8793
Re,8793The estimated regression equation
com p ani es 85 81 , 1 85 81 , 1 85 81 , 1 85 81 , 1 ) ( 85 81
1
,
MRP
r
capm MRPCAPM 1 85 81 , 1 85 81 , 2 85 81 , 2 85 81 , 2 ) ( 85 812
,
MRP
r
capm MRPCAPM 2 000 000 000 85 81 , 1 85 81 , 69 85 81 , 69 85 81 , 69 ) ( 85 8169
,
MRP
al i Ibbotson i Ibbotson
i
r
r
e
ˆ
,8793
Re,8793al i Siegel i Siegel
i
r
r
e
ˆ
,8793
Re,8793
69
1
69
1 2 69
1 2 2
,
,
i i
Siegel i
Ibbotson
Lally
e
e
e
Min
Table 3: Calculation of squared estimation error of each method
2 ,Siegel i
e
2 ,Ibbotson i
e
2 ,Lally i
e
companies
Siegel
MSE
1,Ibbotson
MSE
1,Lally
MSE
1,1
Siegel
MSE
2,
Ibbotson
MSE
2,
Lally ,
MSE
22
000 000
000 000
Siegel
MSE
69,
Ibbotson
MSE
69,
Lally
MSE
69,69
69
1 2
i Siegel
e
69
1 2
i
Ibbotson
e
69
1 2
i Lally
e
Research hypothesis testing
The result of the first hypothesis
First the estimating values of the market risk premium were calculated based on any method that results are presented in Table 4.
Table 4: Estimating the market risk premium of any method
Lally Ibbotson
Sigel
.044 .0381
.033
87 86
ˆ
P
R
M
Then, by implementing steps 1, 2 and 3, the results in Table 4, mean square error during the years of 2008-2014 were obtained as shown in Table 5:
Table 5: Mean Square Err
Lally Ibbotson
Sigel
0.41228 0.50301
0.39512 Charkheshgar
0.628 0.6661
0.63538 Khak e Chini Iran
0.37512 0.18845
0.18091 Khorak e Dam Pars
000 000
000 000
1.00196 0.90844
1.02901
Jam Daru
0.24076 0.16646
0.23296 Jush and Oxygen
32.57167 38.36154
39.74
MSE
The result of the second hypothesis
The market risk premium estimated based on Lally model in compared to the estimated risk premium based on Ibbotson and Siegel models has a high correlation with actual market return. They are expressed as follows:
0
:H
0: there is no significant relationship between market returns and the market leverage .
0
::
H
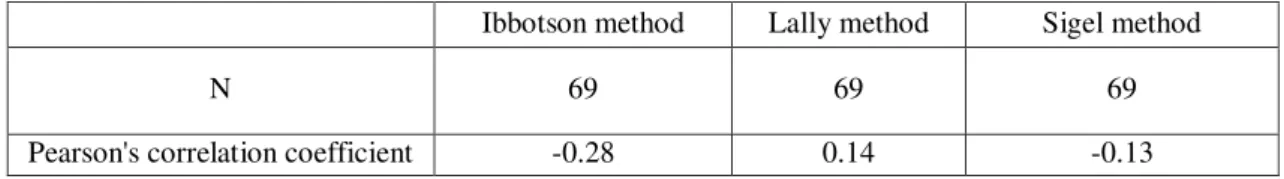
1: there is asignificant relationship between market returns and the market leverage . To test this hypothesis, the relationships and correlations of the factor of market risk premium with the market real returns in different models were evaluated by Pearson correlation.Table 6: Correlation test between market risk premium and real market returns
Sigel method Lally method
Ibbotson method
69 69
69 N
-0.13 0.14
-0.28 Pearson's correlation coefficient
CONCLUSION
In this study, the function of CAPM model, Lally model and Sigel model in predicting the expected return in the level of all companies of the research community, industries and also a strong correlation with risk premium real return any of the models were examined. The results showed there is less estimation error (MSE) in Lally model. The results of studying correlation of market risk premium of each of the models with the real returns mean showed that there is the most complete correlation between market risk premiums with real returns based on Lally model. Research results by Danny Bao (2006) showed that the leverage market has a great impact on explaining returns.
Suggestions for the future study
CAPM model, Lally model and Siegel model are the most important models in pricing capital assets, and have many applications. It is recommended to study and test the following performance and power aspects of predictive models:
optimal portfolio selection;
Evaluation of the cost of capital investment of different investing projects for investment decisions;
Evaluation of managers’ performance of investment companies;
Comparing this model with other models of capital asset pricing such arbitrage pricing model, Fama and French pricing the model and ...;
Comparing Lally model performance with conditional CAPM model.
REFERENCES
1.B1.ao, D., (2008). Time-Varying Market Leverage and the Market Risk Premium in New Zealand. A thesis submitted to the Victoria University of Wellington in fulfillment of the requirements for the degree of Master of Commerce and Administration in Money and Finance Victoria University of Wellington 2008.
2. Behandari, L. C. (2008).Debt/Equity ratio and expected common stock return: Empirical Evidence. Journal of Finance, 43, 407-427.
Chay, J., Marsden, A., & R. Stubbs, (2012). Historical Rates of Return to Equities, Bonds, and the Equity Risk Premium: New Zealand Evidence, Pacific Accounting Review, 5(1), 27–46.
3 .Chay, J., Marsden, A., & Stubbs, R. (2004). Investment returns in the New Zealand market: 1931–1994, New Zealand Investment Analyst, 16, 19–27.
ernandez, P. (2008). Market risk premium user in 2008: A survey of more than a 1000 professor.
4 .Harris, R. S. & F. C. Marston, (2012). Estimating Shareholder Risk Premia Using Analysts Growth Forecasts, Financial Management, 21(2), 63–70.
Year-by-Year Historical Returns (1926–1974), Journal of Business, 49(1), 11–47.
5. Lally, M. & A. Marsden, (2004a). Estimating the Market Risk Premium in New Zealand through the Siegel Methodology, Accounting Research Journal, 17(2), 93– 101.
6. Lally, M. & A. Marsden, (2004b). Tax-Adjusted Market Risk Premiums in New Zealand: 1931–2002, Pacific-Basin Finance Journal, 12(3), 291–310.
7. Lally, M., (2002). Estimating the Market Risk Premium in New Zealand to Market Leverage Methodology, http://www.ssrn.com.
8. Marsden, A. (2005). Historical and Siegel Estimates of the Market Risk Premium in New Zealand. ISCR presentation on The Regulatory Cost of Capital II: What is the Market Risk Premium?.
9. Merton. (1980). On Estimating the Expected Return on the Market, Journal of Financial Economics, 8, 323–361.
10. Modigliani, F. & M. H. Miller, (2002). The Cost of Capital, Corporation Finance and the Theory of Investment, American Economic Review, 48(3), 261–297.