Vol-7, Special Issue-Number4-July, 2016, pp784-790 http://www.bipublication.com
t or ep R se Ca
Investigating the influence of risk management on earnings volatility of the
listed companies in Tehran stock exchange
Jafar Akbari1*, Fatemeh Samadi2 and Masoumeh Jafari3
1
Department of Financial Management, Tehran East Branch, Email : [email protected]
2
Department of FinancialManagement, Tehran East Branch Email : [email protected]
3
Department of Governmental Management, Tehran East Branch, Islamic Azad University, Tehran, Iran
Email : [email protected] Corresponding author is Jafar Akbari
ABSTRACT
This invetigation aims to examine the impact of risk management practices on earnings volatility of the listed companies in Tehran stock exchange. All listed companies in Tehran stock exchange were selected as the statistical population of the research during 2005 to 2015. Risk management, liquidity risk management and operational risk management, and earnings volatility were selected as the independent and dependent variables of the study, respectively. Dechow & Tang (2008) model is used for measuring earnings volatility in this research. 130 firms were selected as the statistical population based on the systematic elimination method. The obtained results show that risk management doesn’t impact on earnings volatility. As well, liquidity risk management significantly and negatively impact on earnings volatility, and operational risk management positively and significantly influence on earnings volatility.
Keywords: Risk management; Liquidity risk management; Operational risk management; earnings volatility.
1. INTRODUCTION
Risk management is an evaluating risk process and designing strategies for identifying risk. Researchers believe that risk management of a business unit is essential for reducing general risk of a firm's bankruptcy, for improving performance, and finally for increasing firm value. Agency risk management is a dynamic approach of measuring integrated risk by which organizations decrease their risk level (Bushman & Zuiden). Having established agency risk management, a firm is enabled to regularly measure risks and identify the required resources and stages to overcome or reduce risks (Funstan, 2003). The main defualt of risk management is that each business unit is established to create value for its stakeholders.
management titled with "operational risk". As staffs and management implement business processes, operational risks start to emerge. The available defect in processes' esence may result in inefficieny and problems during the operation, and possible undesirable effects may also seen in the organization success (Chelik et al, 2012). Generally, risk management looks for recognizing the risk possibilitis and risk tolerance. It can be seen in risk litrature that risk management results in decreased earnings volatility (Beasley et al, 2008; Gordon et al, 2009). This is one of the major advantages of risk management, because risk management ables to decrease the cost related to firms' financial distress. The cost of firms' financial distress is a potential value in improving risk management implementation characteristics. The current investigation followed by Edmonds et al, (2015) examined how risk management affect earnings volatility. The results suggested that increased quality of risk management practices result in decrased earnings volatility. Edmonds et al, (2015) found that the economic impact of risk management is highlighted more than for loss-making and financially-distressed firms. Therefore, the main issue in current research is how risk management affect earnings volatility of the listed companies in Tehran stock exchange.
2. Research background
Edmonds et al, (2015) examined the relation between risk management behavior and earnings volatility of firms. Their results suggested that high quality implementation of risk management system results in decreased earnings volatility. Kelab & Wou (2014) investigated the relation between earnings volatility and earnings forecast capability in English and American firms. They examined 341 cases during 1991 to 2010 and concluded that there is a negative and significant relation between earnings forecast capability and earnings volatility in English and American firms. Ittner & Michels (2014) examined the relation between liquidity risk management of a business unit and earnings management forecast of the listed companies in U.S stock exchange. The results shown that liquidity risk
management results in earnings management accuracy and decreased forecast error, and controls earnings volatilities. Therefore, liquidity risk management results in decrased earnings volatility. Berry & Xu (2013) examined how risk management and earnings volatility have correlated and concluded that there was a negative and significant relationship between the two factor.
Jumnez & Delkato Garcia (2012) examined the relation between risk management and firm performance of Spanish firms during 2000 to 2005. They concluded that there was a significant relation among risk management and firm performance of Spanish cases.
Li et al, (2010) investigated the relation between earnings manipulation and systematis risk in Banking industry. According to the their research, there is a significant relation between earnings manipulation and banks' systematic risk. The results also suggested that risk management results in decreased earnings volatility. Hutton et al, (2009) investigated the relation between earnings management and managrial risk-taking and concluded that managerial risk-taking in banks has significant relation with accruals manipulation, as a result, there is a significant relation between managerial risk-taking and earings management.
3. Research methodology 3-1- The research hypotheses 3-3-1- The primary hypothesis
Risk management significantly impact on earnings volatility of the listed companies in Tehran stock exchange.
3-1-2- The secondary hypotheses
Liquidity risk management significantly impact on earnings volatility of the listed companies in Tehran stock exchange. Operational risk management significantly
impact on earnings volatility of the listed companies in Tehran stock exchange. 3-2- Research method
and field method are used as a inseparable part of scientific researches in this study.
3-3- The statistical population and sample The population of the research includes all listed companies in Tehran stock exchange during 2005 to 2015, followed the below conditions: 1. The firm should be listed before 2005. 2. Its fiscal year should end in 19/3 on each
year.
3. The firm should not change its fiscal year during the study.
4. Banks, insurance and investment companies are not considered.
5. The firms' data should be available.
130 firms were selected as the statistical population of the research based on systematic elimination mehod.
3-4- The regression model
3-4-1- The regression model of the primery hypothesis
itlatility
EarningsVo
it itit
Cf
GI
ment
RiskManage
2 31
0
it it it
it
Lev
Size
Na
4 5 63-4-2- The regression model of the first secondary hypothesis
itlatility
EarningsVo
it it itit
Cf
GI
Na
LR
2 3 41
0
it it it
it
Size
Lev
5 63-4-2- The regression model of the second secondary hypothesi
itlatility
EarningsVo
it it itit
Cf
GI
Na
OR
2 3 41
0
it it
it
Size
Lev
5 63-5- Data analysis method
To estimate the efficiency of a regression model, inn this research, one the common effects, fixed effects and random effects model is selected using panel data by suitable test. F-Limer test is used for selecting between common effects and fixed effects methods.
If fixed effects model is selected, Hausman test would be used to select among fixed effects and random effects models. Also, model’s error term autocorrelation, heteroskedasticity and data normality would have been examined.
To illustrate the description power of descriptive variables, to examine the significance of variables and to investigate the adequacy of whole model, adjusted coefficient of determination, T-statistics and F-Fisher test are used, respectively.
As well, statistical analyses are done through EVIEWS 7 and EXCEL software.
4- RESULTS
4-1- Multicolinearity
Table 1-1- Pearson correlation test
Variables Operational risk
management
Risk management
Liquidity risk management
Operational risk management 1.000000
Risk management -0.012778 1.000000
Liquidity risk management 0.067299 -0.016356 1.000000
According to the table 1-1, there is no high or low (close to +1 and -1) correlation coefficient influencing the results of the regreson aalysis. As a result, there is no multicolinearity between the variables of the research.
4-2- Significance test of fixed affects method
Table 1-2: F-Limer test
Description Statistics amount Freedom degree Probability
Cross-section F 2.278308 129 *0.000
Cross-section Chi-square 292.685670 129 *0.000
* 5% error level
Table 1-3- Hausman test
Description Statistics amount Freedom degree Probability
Cross-section F 12.730918 6 *0.0475
Regarding the results of both table (F and Hausman), the obtained probability were less than 5% in each tests, so fixed effects method should be used in the related regression model.
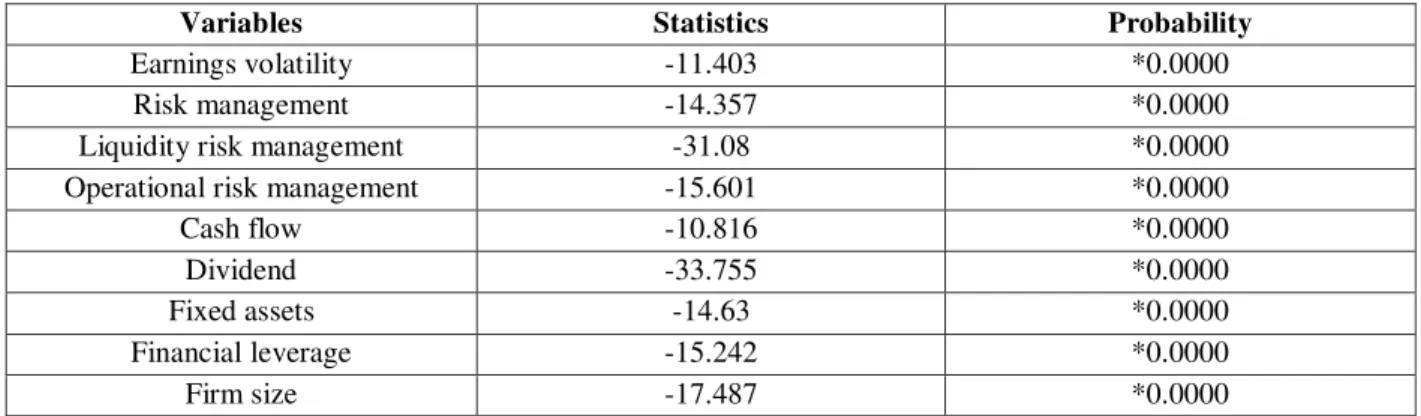
4-3- Dickey-Fuller test
Table 1-4- Test of cumulative unit root test on variables by Dickey-Fuller
Variables Statistics Probability
Earnings volatility -11.403 *0.0000
Risk management -14.357 *0.0000
Liquidity risk management -31.08 *0.0000
Operational risk management -15.601 *0.0000
Cash flow -10.816 *0.0000
Dividend -33.755 *0.0000
Fixed assets -14.63 *0.0000
Financial leverage -15.242 *0.0000
Firm size -17.487 *0.0000
* 5% error level
According to the table 1-4, the examination of calculated statistics and their acceptance probability indicates that H0 is rejected and all variables of the study are durable.
4-6- The primary hypothesis test
Table 1-5- The regression test of the primary hypothesis
Variable Estimated
coefficients
Estimation of
deviation t-statistics
Significance level Fixed
3.376474 0.563119 5.996018 0.0000
Risk management 0.000877 0.000904 0.970935 0.3318
Cash flow
0.615313 0.265736 2.315505 0.0207
Dividend 0.00446 0.277517 0.008815 0.9930
Fixed assets 0.130293 0.295948 0.440257 0.6598
Financial leverage -0.036433 0.221714 3.807712 0.0001
Firm size -0.036433 0.034688 -1.050323 0.2938
* 5% error level
Table 1-6: Description and significance ability of whole model R2
DW
ANOVA
Sig F
Adjusted coefficient of determination
Coefficient of determination
**0.000 25.69610 1.73 0.828 0.859
** 1% error level
Regarding the table 1-5, since Durbin-Watson statistic test value is determined among 1.5 to 2.5, there is no correlation between errors and regression can be used. The adjusted coefficient of determination is 0.828; indicating 82.8% of all earnings volatilities depend on the independent and control variable. On the other hand, due to significance level of F-test in error level less than 0.01, it can be concluded that the regression model is a suitable model and the independent variable are able to firms' earnings volatility changes.
Estimated impact factor of risk management on firms' earnings volatility is -0.001, suggesting risk managementnegatively and adversly impacts on earnings volatility.
Also, according to significance level of t-statistics, and due to the amount of risk management on earnings quality (0.3318) is more than 5% error level, , H0 is confirmed with 95% confidence level.
4-7- The first secondary hypothesis test
Table 1-7- The regression test of the first secondary hypothesis
Variable Estimated coefficients Estimation of
deviation t-statistics
Significance level Fixed
3.317797 0.568415 5.836926 0.0000
Liquidity risk management -0.133338 0.020207 -6.598675 0.0000
Cash flow
0.615091 0.255929 2.403370 0.0164
Dividend 0.014258 0.284932 0.050041 0.9601
Fixed assets 0.142202 0.286865 0.495710 0.6262
Financial leverage 0.756830 0.239004 3.166599 0.0016
Firm size -0.02069 0.034888 -0.593268 0.5531
*5% error level
Table 1-8: Description and significance ability of whole model R2
DW
ANOVA Sig F Adjusted coefficient of
determination
Coefficient of determination **0.000 28.88545 1.7 0.75 0.82 ** 1% error level
Regarding the table 1-7, since Durbin-Watson statistic test value is determined among 1.5 to 2.5, there is no correlation between errors and regression can be used. The adjusted coefficient of determination is 0.75; indicating 75% of all earnings volatilities depend on the independent and control variable. On the other hand, due to significance level of F-test in error level less than 0.01, it can be concluded that the regression model is a suitable model and the independent variable are able to firms' earnings volatility changes. Estimated impact factor of liquidity risk management on firms' earnings volatility is -0.133, suggesting liquidity risk management negatively and adversly impacts on earnings volatility. Also, according to significance level of t-statistics, and due to the amount of liquidity risk management on earnings quality (0.000) is more than 5% error level, , H0 is rejected with 95% confidence level. It can be stated that, liquidity risk management significantly and negatively impact on earnings volatility of the listed companies in Tehran stock exchange.
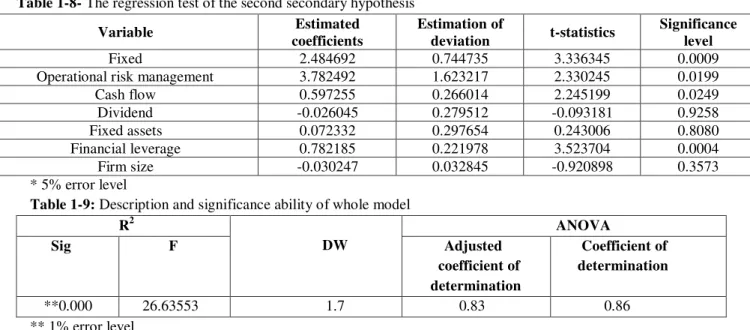
4-8- The second secondary hypothesis test
Table 1-8- The regression test of the second secondary hypothesis
Variable Estimated
coefficients
Estimation of
deviation t-statistics
Significance level Fixed
2.484692 0.744735 3.336345 0.0009
Operational risk management 3.782492 1.623217 2.330245 0.0199
Cash flow
0.597255 0.266014 2.245199 0.0249
Dividend -0.026045 0.279512 -0.093181 0.9258
Fixed assets 0.072332 0.297654 0.243006 0.8080
Financial leverage 0.782185 0.221978 3.523704 0.0004
Firm size -0.030247 0.032845 -0.920898 0.3573
* 5% error level
Table 1-9: Description and significance ability of whole model R2
DW
ANOVA Sig F Adjusted
coefficient of determination
Coefficient of determination
**0.000 26.63553 1.7 0.83 0.86 ** 1% error level
Regarding the table 1-8, since Durbin-Watson statistic test value is determined among 1.5 to 2.5, there is no correlation between errors and regression can be used. The adjusted coefficient
than 0.01, it can be concluded that the regression model is a suitable model and the independent variable are able to firms' earnings volatility changes. Estimated impact factor of operational risk management on firms' earnings volatility is 3.782, suggesting liquidity risk management positively and directly impact on earnings volatility. Also, according to significance level of t-statistics, and due to the amount of operational risk management on earnings quality (0.019) is more than 5% error level, , H0 is rejected with 95% confidence level. It can be stated that, operational risk management significantly and positively impact on earnings volatility of the listed companies in Tehran stock exchange.
5- CONCLUSIONS AND
RECOMMENDATIONS
The results of the primary hypothesis indicated that risk management significantly impact on earnings volatility of the listed companies in Tehran stock exchange. The result of the first secondary hypothesis suggested that liquidity risk management negatively and significantly impact on earnings utility of the listed cmpanies in Tehran stock exchange. The result of the second secondary hypothesis showed that operational risk management has significant and positive impact on earnings volatility of the listed companies in Tehran stoclk exchange. According to the obtained results, the following recommendation can be made:
1. It is suggested to firms to establish required strategies in order to increase risk management and liquidity risk management and to decrease operational risk management so that they can decrease firms' earinings volatility.
2. It is recommended to investors and shareholders to invest in firms in which high liquidity risk management and low operational risk management is existed to not experience earnings volatility.
3. It is recommended to Tehran stock exchange to rate firms based on their earnings volatility to help people and stakeholders to make reasonable decisions.
6- REFERENCES
1. Allayannis, G, Rountree, B, & Weston, J. (2005). Earnings volatility, cash flow volatility, and firm value. Available at www.ssrn.com
2. Anolli,M,Beccalli,E,& Molyneux,P.(2014). Bank earnings forecasts, risk and the crisis. Journal of international financial markets,instituations and money, pp 309-335 3. Berry, T, & Xu, J. (2013). Enterprise risk management and cost of capital. Available at www.ssrn.com
4. Bertomeu, J. (2008). Risk management, executive compensation and the cross-section of corporate earnings. Available at www.ssrn.com
5. Chen,K&Chen,L. (2001). Earnings quality and stock returns. NBER working paper. No 8308
6. Clubb, G, & Wu, G. (2014). Earnings volatility and earnings prediction: analysis and UK evidence. Journal of business and accounting, vol41. No1, pp53-72
7. Danghui,L, Quang,N,Peter,K & Steven,X.( 2010). Large foreign ownership and firm-level stock return volatility in emerging markets. Journal of financial and quantitative analysis, working paper version.
8. Dichev, I, & Tang, V. (2009). Earnings volatility and earnings predictability. Journal of accounting and economics, vol 47. No 1, pp 160-181
9. Diether, K, Malloy, C & Scherbina, A. (2002). Differences of opinion and the cross section of stock returns. Journal of finance, vol 62, pp 2113-2141
10.Edmonds, C, Emonds, J, Leece, R, & Vermeer, T. (2015). Do risk management activities impact earnings volatility? Research in accounting regulation
11.Hamada, R. (1972). The effect of firm’s capital structure on the systematic risk of common stock. Journal of finance, vol 27. No 2, pp 435-452
13.Hutton, A, Alan, J, & Hassan, T. (2009). Opaque financial reports, R-square and crash risk. Journal of financial economics, col94, pp 67-86
14.Ittner, C, & Michels, J. (2014). Enterprise risk management and management earnings forecasts. Available at www.ssrn.com
15.Jiang, C, Elyas, E, & Jane, J. (2011). Institutional ownership, stability and risk taking. Ssrn paper
16.John,K,Litov,L&Yeung,B.(2008). Corporate governance and risk taking. The journal of finance,vol 63,pp 1679-1728
17.Khaled,A,Zakaria,S.(2014). The effect of ownership structure on share price volatility of listed companies in Amman stock exchange. Research journal of finance and accounting. Vol 5. No 6
18.Konstantini, T, & Pope, P. (2012). Forecasting risk in earnings. Working paper business school.
19.Lamont, O., C. Polk & J. SA’s-Requejo. (2001). Financial constrants and stock returns. Review of financial studies, vol 14, pp 529-554
20.Lee, C, Marcia, M, Alan, M, & Hassan, T. (2014). Bank earnings management and tail risk during financial crisis. Journal of money, credit and banking, vol46. No1
21.Li, L, Ma, M, & Wu, F. (2010). Earnings smoothing and systematic risk in banking industry. University of international business and economics.
22.Lin, X. (2007). Endogenous technological progress and the cross section of stock returns. Working paper, London school of economics.
23.Linda, K. (2009). The trade-off between risk management and earnings volatility: Evidence from restatements. Doctoral Dissertations
24.Ntim, C, Lindop, S, & Thomas, D. (2013). Corporate governance and risk reporting in South Africa: a study of corporate risk disclosures in the pre- and post- 2007/2008 global financial crisis periods. International review of financial analysis.
25.Tucker, J, & Zarowin, P. (2006). Does income smoothing improve earnings
informativeness? The accounting review, vol81. No 1, pp 251-270
26.Yasuda, Y, Okuda, S, & Konishi, M. (2004). The relationship between bank risk and earnings management: evidence from Japan. Review of quantitative finance and accounting, vol 22. No 3, pp 233-248