A Study on Engineering of Cash Management
and its impact on Profitability of Indian
Pharmaceutical Industry with Special
Reference to Cipla Ltd.
Dr. S.K. Sinha
Professor & Dean, Chaudhary Ranbir Singh University, Jind, Haryana, India
Dr. Ruchi Goyal
Associate Professor, School of Business, Suresh Gyan Vihar University, Jiapur, Rajsthan, India
Sunil Kumar
Research Scholar, Suresh Gyan Vihar University, Jiapur, Rajsthan, India
Vinay Gupta
Assistant Professor, School of Business, ITM University, Gwalior, Madhya Pradesh, India
Abstract: The creation of firms’ value is been positively expected by a well designed and implemented cash management. The purpose of this paper is to examine the trends in cash management and its impact on firms’ performance and also to examine significant difference between the profitability of firms and industries. Here we consider the return on total assets as dependent variable which is used as a measure of profitability and relation between cash management and corporate profitability. For this purpose here we have taken a sample of ten Indian Pharmaceuticals firms (NSE listed) and the period of 2000-2014. In this study we used panel data regression for the investigation of the results. The other main variables used in this analysis are cash conversion cycle(CCC), GEAR, CATA, CLTA, CATURN, LNSales. In previous empirical work a strong significant relationship between WCM and profitability has been found. In this way the final analysis of the operational efficiency, liquidity and profitability of the Indian Pharmaceuticals firms have shown a significant changes and it also shows how best practices are prevailing in the Cipla Ltd. and others which are contributing to performance. We have also come out how the findings also reveal an increasing trend in the working capital financing (short-term component).
Key words: working capital management, Profitability, liquidity & operational efficiency.
I. INTRODUCTION
The main reason of firms which holds assets is to generate returns. In this way the value of an asset is determined according to its capacity to generate future cash flows. For example, a firm might maintain large account receivables and a varied stock of inventory in an effort to gain greater loyalty from customers and in turn generate more future sales. But, now the question arises if the main goal of the firm is to distribute profits to investors, why do it choose to hold cash? Perhaps the first idea that comes to mind is that cash is needed to perform transactions, for example, to pay general expenses and wages or to make purchases. Of course, in some cases a firm may be able to effect these transactions using credit rather than cash, but eventually such obligations need to be paid. Thus, as long as the company operates, there is a transaction motive for holding cash.
Second, a firm will need to hold some cash to be able to respond to the unexpected. On the one hand, an unexpected event may be bad, for example, if a large customer fails to pay on time. In this case, the firm can only pay its bills when it has sufficient back-up money available. This is typically referred to as a precautionary motive for holding cash. On the other hand, an unexpected event may be good, say, if a firm faces a profit-increasing investment opportunity. To the extent that pursuing such opportunities requires cash, the firm may choose to hold higher cash balances simply to be able to profit from this valuable option. Here the option motive for holding cash is to close, but richer than, the typical speculative motive for holding cash.
If we consider the development of technologies that facilitate transactions and the evolution of local and global markets that provide a wide variety of hedging alternatives, we would expect corporate cash balances to have decreased over time. However, the observed pattern is just the opposite: cash-to-assets ratios, for example, have more than doubled over the last 25 years.
So why are firms increasing their cash balances? That is, why do firms increasingly find it valuable to hold cash? Some researchers agree that most of this departure is explained by the risk component; that is, it is explained either by this option value of cash holding or by the use of cash as a hedging tool.
This chapter summarizes the factors in which a financial manager needs to take into an account respect to the firm’s cash management policy. Initially we have given a brief discussion of the various motives for holding cash. At the conclusion we have summarizes the key variables that the literature shows determine a firm’s optimal cash balances. Next, we have explained why a firm’s cash collection policy and its cash conversion cycle matter for good cash management. Finally, we have discussed how a firm can optimally invest its idle cash.
II. LITERATURE REVIEW
Baumal (1952) emphasized that the total cost of the cash balance to be held by the firm should be minimum. He attempted to apply the inventory model to determine the level of cash to be held by the business firm. He stated that the total cost is the sum of interest opportunity cost and broker's fees. The model, which he has applied in his study, is as follows:
C =
Where, C= the cash balance to be held by business firm, b is the broker's fees or transaction cost, T is the total cash needed, and i is the interest opportunity cost. He opined that the transactions demand for cash would vary approximately in proportion with the money value of transactions.
Baumal assumptions about the behaviour of cash inflow and outflows are probably more application to an individual than to a business firm. It is because inflows are likely to be less lumpy and outflows are likely to be less smooth for the firm.Sagan (1955), Sagan pointed out that responsibility of money manager is to provide funds when needed to invest by examining liquidity and profitability of, various investment opportunities. He suggested that the money manager should take his decisions on the basis of cash budget and total current assets position rather than on the basis of traditional working capital ratios. This is important because efficient money manager can avoid borrowing from outside even when his net working capital position is low. The study pointed out that there was a need to improve the collection of funds but it remained silent about the method of doing it. Finally, he concluded that the money manager should be a combination of credit analyst, a commodity specialist, a money market expert, a bit of a horse trader, and a banker. Moreover, this study is descriptive without any empirical support. Therefore, the validity of facts is found low.Tobin (1956) studied on the interest elasticity of transaction demand for cash. He indicated that there are important economies of scale in cash holding and an inverse relationship between interest rates and the demand for money. His study is different from Baumal's study to the extent that the individual's interest earnings not of transaction costs were maximized. He himself recognized that his result is similar to Baumal's equation. In the study of Friedman (1959), His empirical results indicated that the permanent income elasticity was 1.8 and the effect of interest rates on the demand for money was too small to be statistically significant. He concluded that the demand for money is not statistically sensitive to changes in the rate of interest. In fact, his estimates apply to individuals, but he believed his model could be applied to the business firms as well.
Meltzer (1963) investigated the demand for money by business firms. The study of Meltzer was based on 14 industries for nine years with assets - class observation. In his study, he specified the following function as a first approximation to the theory:
M = f(r, w)
Where, M is money, the sum of currency and demand deposit of the public, r is a market rate of interest and w is the net wealth of the public. He used sales as a proxy for the firm's wealth. In order to reach conclusion, he tested three function forms:
/RJ& DȕORJ6& .6 C = a + b S1/2+ dS
the U.S. total manufacturing sector. By using regression equation, Nadiri found that the demand for real cash balances was determined by output (wealth), the interest rate, and the expected rate of change in the general price level and factor prices. The level of the long-term interest rate and the change in the interest rate are significant determinants of real cash holdings of the manufacturing sector. Lastly, Nadiri concluded that the question of whether the short or long term interest rate is 1 better proxy of the relevant interest rate required further investigation. Marvill and Tavis (1973) in their study They pointed out that the current assets and liabilities of a firm are the stock reflection of closely interrelated operational and financial cash flows. They suggested that the net effect of these combined flows must be recognized in searching for the optimal credit inventory or short term borrowing policies. Smith (1997) studied on modelling associations between working capital and operating profit. The purpose of the study was to report on results of research undertaken to model associations between traditional and alternative working capital measures and operating profit in 135 industrial firms listed on the Johannesburg Stock Exchange over of period of ten years starting from 1984 to 1993. In the study they found the traditional working capital leverage ratio of current liabilities divided by gross funds flow displayed the greatest associations with operating profit. As per the findings, a decrease in total current liabilities divided by gross funds flow could indicate an improvement in operating profit and vice versa. Shin and Soenen (1998) studied on efficiency of working capital management and corporate profitability. They investigated the relation between the firm's net trade cycle and its profitability. The relation was examined using correlation and regression analysis. They found that in all cases, a strong negative relation between the length of the firm's net trade cycle and its profitability. Pinkowitzand Willian son (2001) examined the effect of bank power on cash holding patterns of industrial firms for a sample of Japanese firms for the periods 19741995, German firms for the periods 1984-1994 and US firms for 1971-1994. They found that high cash holdings mean higher rents extracted by the banks during the periods when they enjoy certain power in the corporate lending system. Toby (2005) in his paper he suggested that; the finance managers in manufacturing enterprises needed to redefine their banking relationship regularly as a strategy for managing anticipated and unanticipated gap. Nguyen (2005) investigated the hypothesis that money balances have a preventive motive and serve to mitigate the volatility of operative earnings that they used as a proxy for risk. Their results showed that money holdings are completely related to firm level risk, however negatively concerning trade risk. In line with past researches, money holdings were found to be decreasing with the firm’s size and debt ratio and increasing with its gain, growth prospects, and dividend pay-out ratio. Guney et al (2006) examined the impact of leverage on cash balances of companies. They found high levels of leverage, a positive relationship between money holdings and leverage exists. Their results counsel a significant non-linear relationship between cash holding and leverage.
Drobetz and Gruninger (2006) investigated the determinants of Swiss no financial firms' cash holdings over the 1995-2004. The results showed that the median of Swiss corporations hold almost doubly the maximum amount cash and cash equivalents because the median of UK or U.S. firm.
3.1 Objectives & Research Hypotheses:
The objective of this research is to distinguish the relationship between methods of cash management and profitability of Indian Pharmaceutical companies and to examine the causes for any significant differences between the Indian pharmaceutical companies.
H0: A Significant relationship exists between the cash conversion cycle and return on total assets.
3.2 Research Methodology
The primary aim of this study is to investigate the impact of cash management on corporate profitability of Indian Pharmaceutical Industry. This is achieved by developing a similar empirical framework first used by Shin and Soenen (1998) and the subsequent work of Deloof (2003). We extend our study to examine the possible causes for any significant differences between the Companies. Our study focuses exclusively on those Indian Pharmaceutical companies are listed in NSE Pharma Indices.
Thus the empirical study is based on a sample of 10 Indian Pharmaceutical Companies. The data has been collected from Prowess data base and companies annual reports. The sample was drawn from the list of NSE Pharma indices. All companies’ data was available for a 14 years’ period, covering the accounting period 1999-2000 to 2012-2013. This has given a balanced panel data set of 140 firm-year observations for a sample of 10 firms.
Explanatory variables
The Cash Conversion Cycle (CCC) is used as a comprehensive measure of working capital as it shows the time lag between expenditure for the purchases of raw materials and the collection of sales of finished goods. The longer the cycle, the larger the funds blocked in working capital. The return on assets is a better measure since it relates the profitability of the business to the asset base. There are many ways of managing return on assets but, in principle, key levers are, of course, profit increase and assets reduction. The latter has become more important to many businesses as the former becomes more elusive.
Cash conversion cycle: Period of cash conversion
Control variables
In order to account for firm’s size and the other variables that may influence profits so we use sales a proxy for size (the natural logarithm of sales), the gearing ratio (financial debt/total assets), the gross working capital turnover ratio (sales/current assets) and the ratio of current assets to total assets are included as control variables in the regressions.
III. ANALYSIS OF CASH MANAGEMENT
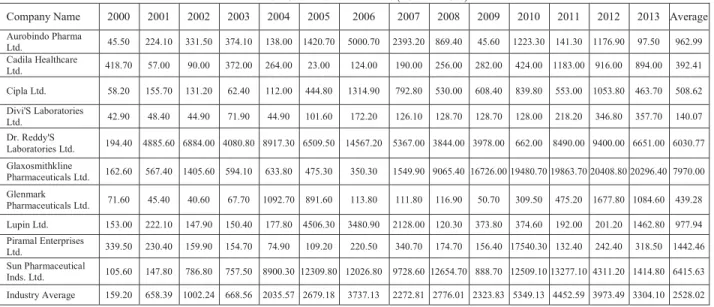
3.1 Composition of cash:As it is known, holding cash is very important to run a business. In this study the total annual cash & bank balances of Indian pharmaceutical companies are shown in the table 1. Holding cash depends upon policy & size of the company. Annual industry average of Cash and Bank balance is Rs 2528.02 million. The Divi’s Laboratories Ltd. holds minimum cash balance i.e. as an average of Rs140.07 million, where as the maximum cash is being held by Glaxosmithkline Pharmaceuticals Ltd. the nature of cash is much fluctuating in each pharmaceutical company. There are huge fluctuations in cash balances of Glaxosmithkline Pharmaceuticals Ltd., from the year 2007 to 2013. In Cipla Ltd. cash has increased from Rs 58.20 million in 2000 to Rs 1053.80 million in 2012. During 2004 to 2007 cash increased continuously and after 2007 with fluctuation it decrease. Maximum cash balance held by Cipla Ltd. is Rs 1314.90 million in 2006 and minimum Rs 58.20 million in 2000.
. Table 1 Cash and Bank Balance (Rs in millions)
Company Name 2000 2001 2002 2003 2004 2005 2006 2007 2008 2009 2010 2011 2012 2013 Average
Aurobindo Pharma
Ltd. 45.50 224.10 331.50 374.10 138.00 1420.70 5000.70 2393.20 869.40 45.60 1223.30 141.30 1176.90 97.50 962.99 Cadila Healthcare
Ltd. 418.70 57.00 90.00 372.00 264.00 23.00 124.00 190.00 256.00 282.00 424.00 1183.00 916.00 894.00 392.41 Cipla Ltd. 58.20 155.70 131.20 62.40 112.00 444.80 1314.90 792.80 530.00 608.40 839.80 553.00 1053.80 463.70 508.62 Divi'S Laboratories
Ltd. 42.90 48.40 44.90 71.90 44.90 101.60 172.20 126.10 128.70 128.70 128.00 218.20 346.80 357.70 140.07 Dr. Reddy'S
Laboratories Ltd. 194.40 4885.60 6884.00 4080.80 8917.30 6509.50 14567.20 5367.00 3844.00 3978.00 662.00 8490.00 9400.00 6651.00 6030.77 Glaxosmithkline
Pharmaceuticals Ltd. 162.60 567.40 1405.60 594.10 633.80 475.30 350.30 1549.90 9065.40 16726.00 19480.70 19863.70 20408.80 20296.40 7970.00 Glenmark
Pharmaceuticals Ltd. 71.60 45.40 40.60 67.70 1092.70 891.60 113.80 111.80 116.90 50.70 309.50 475.20 1677.80 1084.60 439.28 Lupin Ltd. 153.00 222.10 147.90 150.40 177.80 4506.30 3480.90 2128.00 120.30 373.80 374.60 192.00 201.20 1462.80 977.94 Piramal Enterprises
Ltd. 339.50 230.40 159.90 154.70 74.90 109.20 220.50 340.70 174.70 156.40 17540.30 132.40 242.40 318.50 1442.46 Sun Pharmaceutical
Inds. Ltd. 105.60 147.80 786.80 757.50 8900.30 12309.80 12026.80 9728.60 12654.70 888.70 12509.10 13277.10 4311.20 1414.80 6415.63 Industry Average 159.20 658.39 1002.24 668.56 2035.57 2679.18 3737.13 2272.81 2776.01 2323.83 5349.13 4452.59 3973.49 3304.10 2528.02
4.2 Size of Cash
The cash to Current Assets ratio measures a company's liquidity, which shows however liquid a company is by its cash and Marketable securities alone. High or increasing cash to Current Assets ratio is mostly a positive sign. This also shows that the company's liquid assets represent a bigger portion of its Total Current Assets. It also indicates the company is in higher position to convert its non-liquid assets, such as inventory, into cash. Table 2 shows the average percentage of cash to currents assets of pharmaceutical companies is 14.21%, which shows companies keep low portion in the form of cash & bank balances. The highest cash to current assets ratio is 83.46% of Glaxosmithkline Pharmaceuticals Ltd. in the year 2010 and the annual average is also highest at 44.54%. From 2008 to 2011 Glaxosmithkline Pharmaceuticals Ltd. held cash 72.80% to 80.09% that is the main reason why its annual average is highest during the study period. On the other hand Cipla Ltd. holds lowest cash balance on an average 2.02%, it is fluctuating between 0.58% to 5.97% throughout the study period.
Table: 2 Cash/Current Assets (in %)
Company Name 2000 2001 2002 2003 2004 2005 2006 2007 2008 2009 2010 2011 2012 2013 Average
Aurobindo Pharma Ltd. 1.13 4.44 5.01 4.84 1.73 12.10 28.55 13.25 4.28 0.21 4.11 0.49 3.34 0.20 5.98
Cadila Healthcare Ltd. 23.25 3.15 2.78 10.21 7.97 0.57 2.13 2.98 3.34 3.42 4.16 9.34 6.55 5.93 6.13
Cipla Ltd. 1.33 2.31 1.36 0.58 0.82 2.32 5.97 2.94 1.55 1.79 2.26 1.50 2.47 1.03 2.02
Divi'S Laboratories Ltd. 5.48 4.75 3.49 3.56 1.82 3.37 4.39 2.50 1.86 1.77 1.34 1.80 2.47 2.07 2.91
Dr. Reddy'S Laboratories
Ltd. 4.19 43.12 49.91 36.00 54.69 38.15 48.21 25.56 15.03 16.71 2.14 20.18 16.85 9.45 27.16 Glaxosmithkline
Pharmaceuticals Ltd. 5.02 15.51 31.80 16.51 15.71 13.20 9.31 35.66 72.80 83.07 83.46 80.31 81.04 80.09 44.54 Glenmark
Lupin Ltd. 3.32 4.52 2.65 3.37 3.54 40.37 26.22 14.42 0.83 2.15 1.67 0.66 0.55 3.05 7.66
Piramal Enterprises Ltd. 14.77 7.75 4.36 3.84 1.67 2.44 4.21 5.30 2.40 2.47 17.69 0.28 0.61 2.06 4.99
Sun Pharmaceutical Inds.
Ltd. 4.18 5.42 18.23 20.70 67.52 68.97 55.83 39.45 50.82 7.17 50.84 48.42 20.36 3.52 32.96 Industry Average 7.07 9.50 12.19 10.27 18.23 19.87 18.65 14.33 15.50 11.98 17.55 17.09 15.21 11.47 14.21
Table 3 shows the relationship between cash and current liability. This Ratio shows liquidity position of the company, higher ratio shows good liquidity position of company. The cash and current liability Ratio shows the overall industry average is 72.82%, which shows more than two third of the current liability can be paid by cash, but this average is derived by only three companies mainly by Glaxosmithkline Pharmaceuticals Ltd. whose average of cash to current liability ratio is 257.38%. This figure exhibit that company has two and half of cash than current liability. Two more company Sun Pharmaceutical Inds. Ltd. and Dr. Reddy'S Laboratories Ltd. have cash balance more than of current liability, 215.76% and 119.40% respectively. In the year 2005 the cash to current liability ratio of Sun Pharmaceutical Inds. Ltd. is 740.75%, this is the highest ratio of cash and current liability. In the contrast 0.72% cash to current liability ratio is of Aurobindo Pharma Ltd., that is the lowest figure of this table. In case of Cipla Ltd. cash to current liability ratio is moving between 1.66% to 24.90%. On an average cash to current liability ratio of Cipla Ltd. is 7.03%. It is found that the liquidity position of Glaxosmithkline Pharmaceuticals Ltd. is better than other companies.
3.3 Velocity of Cash
The cash turnover ratio indicates the company’s efficiency or activity in use of cash for generation of sales revenue during the year, which is the number of times that cash turns over per year (cash to goods and again goods to cash). A high turnover of cash ratio may indicate inadequate cash balance in company. This may lead to financial problems if further financing is not available at reasonable prices, it may leave the company weak to creditors, while a low ratio may indicate an inefficient use of working capital. In general, sales five to six times larger than working capital are needed to maintain a positive cash flow and finance sales. Table 4 shows the average cash turnover ratio of pharmaceutical companies is 75.41 times, which shows the companies keep good positions form of sales.
Table: 3 Cash to current Liabilities (in %)
Company Name 2000 2001 2002 2003 2004 2005 2006 2007 2008 2009 2010 2011 2012 2013 Average Aurobindo Pharma
Ltd. 3.56 15.73 16.05 24.12 7.07 50.02 155.45 57.97 17.59 0.77 15.79 2.21 12.23 0.74 27.09 Cadila Healthcare
Ltd. 57.40 6.71 5.22 20.45 14.32 1.15 3.29 6.84 8.72 7.27 10.91 24.47 21.28 17.02 14.65 Cipla Ltd. 3.49 6.30 3.65 1.66 2.27 6.99 24.90 9.10 5.23 6.33 9.01 5.99 9.88 3.60 7.03 Divi'S Laboratories
Ltd. 9.36 13.84 8.61 13.51 6.72 8.82 13.89 7.99 7.96 7.88 5.53 7.38 12.08 12.14 9.69 Dr. Reddy'S
Laboratories Ltd. 18.32 297.98 328.45 140.05 245.48 117.66 229.97 78.82 36.60 27.48 5.75 49.30 60.23 35.48 119.40 Glaxosmithkline
Pharmaceuticals
Ltd. 14.15 37.40 68.96 28.83 28.88 18.45 14.14 63.32 333.78 528.20 562.67 731.92 622.11 550.55 257.38 Glenmark
Pharmaceuticals
Ltd. 28.63 10.80 7.64 10.90 158.25 80.80 6.10 4.10 5.13 2.58 14.84 11.88 24.60 12.94 27.09 Lupin Ltd. 10.46 14.39 8.08 7.64 7.42 150.44 97.87 48.54 1.56 6.15 5.37 2.18 2.04 13.12 26.80 Piramal Enterprises
Ltd. 28.52 14.03 10.19 8.27 3.39 5.33 9.35 12.14 5.34 4.33 215.89 1.66 3.21 4.13 23.27 Sun Pharmaceutical
Inds. Ltd. 17.64 24.69 93.52 66.70 649.61 740.75 247.29 133.95 220.82 33.75 398.47 285.68 84.75 23.00 215.76 Industry Average 19.15 44.19 55.04 32.21 112.34 118.04 80.23 42.28 64.27 62.47 124.42 112.27 85.24 67.27 72.82
The highest cash turnover ratio is 745.59 times of Aurobindo Pharma Ltd. in the year 2013and the annual average is also highest 167.52 times. In 2000, 2009, 2011 and 2013 Aurobindo Pharma Ltd. held average cash turnover ratio 500.85 times that is the main reason why its annual average is highest during the study period. On the other hand Cipla Ltd. holds second largest cash turnover ratio on an average 126.37 times. The lowest cash turnover ratio in Cipla Ltd. is 27.82 times in the year 2006 and the highest cash turnover ratio in Cipla Ltd. is 329.43 times in the year 2003.
3.4 Analysis of Cash flow
activities and financing activities. The cash flow statement is beneficial in crucial the short viability of a company, significantly its ability to pay bills.
International accounting standard seven (IAS 7) is that the International accounting standard that deals with cash flow statements. “In june 1995, the Securities And Exchange Board Of india (SEBI) amended clause 32 of the Listing Agreement requiring each listed company to give beside the balance sheet and Profit and Loss Account, a cash flow statement ready within the prescribed format, showing individually cash flows from operating activities, investing activities and financing activities.”
(7. Gupta, Shashi K.and Sharma, R.K., “Financial Management- Theory and Practice” Kalyani Publishers, New Delhi, 2006, P. 7.2.)
3.4.1 Cash flow from operating activities:
Cash flows from operating activities primarily accrue from the foremost revenue manufacturing activities (i.e., goods and rendering of services) of the company. Therefore, they typically result from the transactions and different events that enter into the determination of net profit or loss. Table 5 shows the industry average of cash from operating activity is Rs 2517.5 million. In which participation of Cipla Ltd. Is largest on an average of Rs 6125.0 million and lowest by Piramal Enterprises Ltd. During the study period the maximum cash inflow from operating activity is registered by Cipla Ltd. in the year 2013 of Rs 17851.90 million followed by Lupin Ltd. with Rs 15262.10 million in the year 2012. The maximum cash used in the operating activity by Piramal Enterprises Ltd. in the year 2010 i.e. Rs 47241.10 million. Cash from operating activities of Indian pharmaceutical companies is moving between Rs 63.86 million to Rs 2517.5 million on an average.
Table: 4 Cash Turnover Ratio (in Times)
Company Name 2000 2001 2002 2003 2004 2005 2006 2007 2008 2009 2010 2011 2012 2013 Average Aurobindo Pharma
Ltd. 219.92 46.34 35.98 35.86 84.19 10.39 3.98 10.07 33.19 727.98 34.58 309.89 47.32 745.59 167.52 Cadila Healthcare Ltd. 11.60 97.28 109.56 30.56 43.64 582.17 124.06 92.55 69.60 69.67 55.65 23.22 33.78 41.29 98.90 Cipla Ltd. 182.77 89.96 119.89 329.43 214.39 69.78 27.82 54.18 100.17 93.34 76.21 127.98 78.74 204.49 126.37 Divi'S Laboratories
Ltd. 45.84 45.41 57.97 44.55 82.01 38.80 43.00 83.07 93.54 73.39 103.83 85.37 61.83 70.81 66.39 Dr. Reddy'S
Laboratories Ltd. 51.30 3.30 2.33 4.30 1.84 3.31 2.88 6.74 11.79 12.27 87.28 7.99 8.93 14.73 15.64 Glaxosmithkline
Pharmaceuticals Ltd. 58.55 19.74 8.31 20.36 23.52 33.53 48.84 11.36 1.98 1.18 1.13 1.24 1.34 1.31 16.60 Glenmark
Pharmaceuticals Ltd. 26.94 57.57 82.18 56.34 4.92 6.96 73.70 126.00 74.75 204.05 39.47 34.38 12.21 22.48 58.71 Lupin Ltd. 53.00 39.54 68.19 79.61 68.54 3.81 5.89 12.51 248.87 99.74 120.18 281.80 355.41 61.37 107.03 Piramal Enterprises
Ltd. 16.93 41.70 72.17 93.37 174.85 138.14 77.50 58.74 136.64 173.39 0.47 87.87 55.00 48.45 83.94 Sun Pharmaceutical
Inds. Ltd. 52.98 47.06 10.04 11.79 1.17 1.10 1.43 2.50 2.24 21.03 1.60 1.87 5.69 21.18 12.98 Industry Average 71.98 48.79 56.66 70.62 69.91 88.80 40.91 45.77 77.28 147.60 52.04 96.16 66.03 123.17 75.41
Table: 5 Cash from operating Activity (Rs in millions)
Company Name 2000 2001 2002 2003 2004 2005 2006 2007 2008 2009 2010 2011 2012 2013 Average Aurobindo Pharma
Ltd. 219.3 898.4 1074.7 455.2 832 275.1 475.3 1035.4 33.1 3463.8 2445.7 1841.9 6249.2 3280.3 1612.8 Cadila Healthcare
Ltd. 442.9 -842 1706 2039 1331 636 2205 629 3132 5766 5470 3571 4237 8426 2767.8 Cipla Ltd. 667.8 664.1 656.9 2435.7 1882.4 2624.4 3126.2 2002.8 3491.7 11102.6 9500 16190.4 13552.9 17851.9 6125 Divi'S Laboratories
Ltd. 263.3 272.2 491.8 260 365.7 484.6 1859.5 3021.2 2955.6 3581.5 3261 3444.7 4828.3 5581.3 2339 Dr. Reddy'S
Laboratories Ltd. 1204.5 4540.2 4097.9 3593.7 2505.3 796.8 8884.2 5435 4706 12354 2463 14030 2888 9055 5468.1 Glaxosmithkline
Pharmaceuticals Ltd. 381.9 599.3 1408 1602.4 2078 3168.1 2172.4 2701.3 2676 4487.8 4274.4 2682.8 2353.6 1995 2327.2 Glenmark
Pharmaceuticals Ltd. 28.5 320.8 93.3 230 89 -280.2 -102.6 2437.7 940.6 9814.6 4210.6 1946.4 2530.1 1142.4 1671.5 Lupin Ltd. 678.6 1412.3 1772.1 4364.6 1216.5 1086.8 1575.6 2530.7 3998.8 5148 4390 4561 9850.4 15262.1 4132 Piramal Enterprises
Ltd. 465.4 2673.2 957.8 2549.5 2291.4 1489.4 1520.2 1311.5 -1069 5491.6 -47241.1 -5441.5 -11216 -10925.1 -4082 Sun Pharmaceutical
Inds. Ltd. 690.7 1426.9 1607.3 3245.6 2125.8 3010.4 4477.6 6258.9 12272.3 5976 11865 12820 350.8 -24930.6 2942.6
Industry Average 531.07 1196.5 1386.58 2077.6 1471.71 1329.14 2619.34 2736.35 3313.71 6718.59 63.86 5564.67 3562.45 2673.83 2517.5
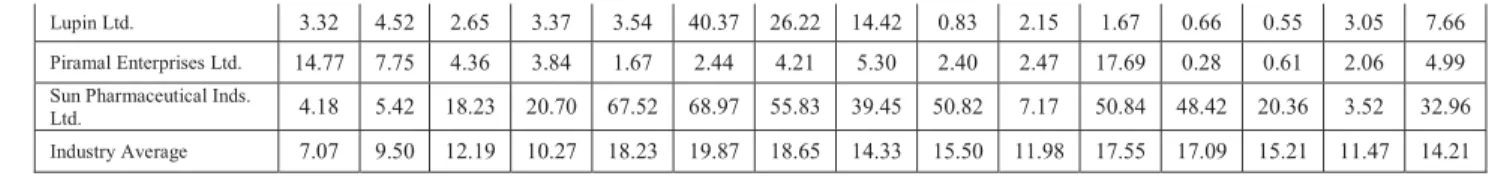
The investment activities relate to the acquisition and disposal of long term assets and other investments not included in cash-equivalents. Their separate disclosure is important as they represent the extent to which expenditures have been made for resources intended to generate future income and cash flows. Table 6 shows the industry average of cash used in investing activities is Rs 2138.12 million. The maximum average cash used in investing activities Rs 6292.61 million of Cipla Ltd. and average cash from investing activities is Rs 6252.75 million of Dr. Reddy'S Laboratories Ltd. In the year 2010 due to huge used of cash in operating activities Piramal Enterprises Ltd. has collected Rs 93875.30 million, but in remaining study period Piramal Enterprises Ltd. has used cash in investing activities and the maximum cash used in investing activities is Rs 15554.9 million in the year 2011. The Indian pharmaceutical companies have used average cash in investing companies between Rs 4477.64 million to (5500.35) million. Cipla Ltd. has used average cash in investing activities Rs 6292.61.80 million during the study period. In Glaxosmithkline Pharmaceuticals Ltd. cash generated from investing activities is more than other companies. Except 2000, 2002, 2003, 2004 and 2012, Glaxosmithkline Pharmaceuticals Ltd. has generated cash in remaining study period.
Table: 6 Net Cash flow Cash from Investing Activity (Rs in millions)
Company Name 2000 2001 2002 2003 2004 2005 2006 2007 2008 2009 2010 2011 2012 2013 Average Aurobindo Pharma Ltd. -501 -1506.8 -2359.2 -2469 -2613.7 -2506.5 -4035 -1829.7 -3239.2 -4149.8 -5697.4 -5338.2 -2949.6 -4014.4 -3086 Cadila Healthcare Ltd. -1759 -1349 -1732 -703 -525 -916 -1605 -2599 -2574 -2486 -3676 -8174 -7092 -3920 -2794
Cipla Ltd. -511 -374.1 -853.4 -2081.4 -662.8 -3892.3 -4859.7 -5337.5 -5807.9 -6572.3 11362.6 -10468 -20642 -14672.1- -6293 Divi'S Laboratories Ltd. -90.2 -93 -590.1 -356.7 -261.9 -1116.6 -1582.5 -2354.9 -2173.9 -3171.7 -2221.2 -2147.6 -2544.9 -3050.6 -1667 Dr. Reddy'S
Laboratories Ltd. -548.2 -1383.8 -1788 -6271.5 693.6 -9139.4 -3973.2 -15149 -7436 -11111 -6130 -11305 -5189 -8808 -6253 Glaxosmithkline
Pharmaceuticals Ltd. -89.5 278.7 -45.1 -1880.3 -1320.7 841 59.6 1115.5 7873.1 6548.1 1020 3684.8 -925.8 1979.8 1367.1 Glenmark
Pharmaceuticals Ltd. -915.9 -234.6 -391.8 -426 -2038.8 -2390.8 -2379.2 -157 -5891.7 10002.1 -6547.2 6015.4 -1132.4 2165.5- -1738 Lupin Ltd. -503.9 -510.5 -593.3 -814.6 -1281.7 -753.7 -1511.1 -4985.3 -4922.3 -6841.1 -3753 -3979.3 -3719.2 -4465.1 -2760 Piramal Enterprises Ltd. -309.5 512.9 742.7 -982.4 -1785.6 -2238.4 -1605.9 -1135.5 -701 -303.2 93875.3 -15555 -14707 9619.7 4673.4 Sun Pharmaceutical
Inds. Ltd. -189.1 -756.7 -643.4 -5316.9 -8634.2 1607.6 -1423.9 -7434.9 -6603.7 -1587.6 10731.5 -7736.9 4605.4- 5191.4 -2832
Industry Average -591.9 -541.69 -825.36 -2130.2 1843.08 -2050.5 -2291.6 -3986.7 -3147.7- 3967.67 4477.64 -5500.4 -5429.6 -1997.38- -2138
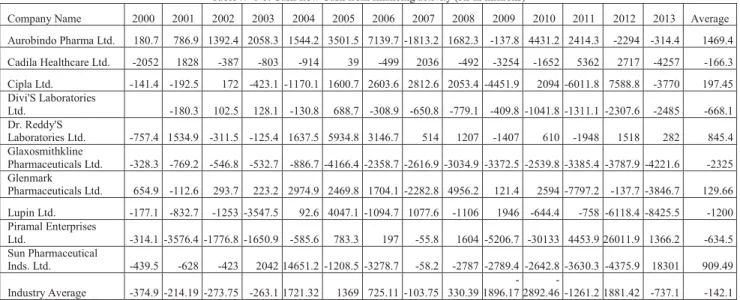
3.4.3 Cash flow from financing activities:
The financing activities report the changes in the size and composition of the share/ owner’s capital and debt of the company. This separate disclosure is useful in predicting claims on future cash flows by providers of funds (both capital and borrowings) to the company.
Table :7 Net Cash flow Cash from financing activity (Rs in millions)
Company Name 2000 2001 2002 2003 2004 2005 2006 2007 2008 2009 2010 2011 2012 2013 Average Aurobindo Pharma Ltd. 180.7 786.9 1392.4 2058.3 1544.2 3501.5 7139.7 -1813.2 1682.3 -137.8 4431.2 2414.3 -2294 -314.4 1469.4 Cadila Healthcare Ltd. -2052 1828 -387 -803 -914 39 -499 2036 -492 -3254 -1652 5362 2717 -4257 -166.3 Cipla Ltd. -141.4 -192.5 172 -423.1 -1170.1 1600.7 2603.6 2812.6 2053.4 -4451.9 2094 -6011.8 7588.8 -3770 197.45 Divi'S Laboratories
Ltd. -180.3 102.5 128.1 -130.8 688.7 -308.9 -650.8 -779.1 -409.8 -1041.8 -1311.1 -2307.6 -2485 -668.1 Dr. Reddy'S
Laboratories Ltd. -757.4 1534.9 -311.5 -125.4 1637.5 5934.8 3146.7 514 1207 -1407 610 -1948 1518 282 845.4 Glaxosmithkline
Pharmaceuticals Ltd. -328.3 -769.2 -546.8 -532.7 -886.7 -4166.4 -2358.7 -2616.9 -3034.9 -3372.5 -2539.8 -3385.4 -3787.9 -4221.6 -2325 Glenmark
Pharmaceuticals Ltd. 654.9 -112.6 293.7 223.2 2974.9 2469.8 1704.1 -2282.8 4956.2 121.4 2594 -7797.2 -137.7 -3846.7 129.66 Lupin Ltd. -177.1 -832.7 -1253 -3547.5 92.6 4047.1 -1094.7 1077.6 -1106 1946 -644.4 -758 -6118.4 -8425.5 -1200 Piramal Enterprises
Ltd. -314.1 -3576.4 -1776.8 -1650.9 -585.6 783.3 197 -55.8 1604 -5206.7 -30133 4453.9 26011.9 1366.2 -634.5 Sun Pharmaceutical
Inds. Ltd. -439.5 -628 -423 2042 14651.2 -1208.5 -3278.7 -58.2 -2787 -2789.4 -2642.8 -3630.3 -4375.9 18301 909.49
Industry Average -374.9 -214.19 -273.75 -263.1 1721.32 1369 725.11 -103.75 330.391896.17-2892.46 -1261.2 1881.42 -737.1- -142.1
3.4.4 Net cash increase/decrease
The difference of opening and closing balances affects the increase or decrease in net cash of Indian pharmaceutical companies. Table 8 shows the average decrease of cash in Indian pharmaceutical companies is Rs (245.3) million. The maximum cash increase or decrease is of Piramal Enterprises Ltd. i.e. Rs 16542.5 million increase in 2011 and decrease of Rs 16501.20 million in 2010. But the average change in cash of Piramal Enterprises Ltd. as increase of Rs 42.71 million. On an average Cadila Healthcare Ltd. has maximum average increase of cash is 209.9 million and maximum average decrease in cash is Rs 1369 million of Glaxosmithkline Pharmaceuticals Ltd.
Cipla Ltd. has an average decrease of cash is Rs 29.82 million which is moving between the increase of Rs 590.30 million to decrease of Rs 870.1 million during the study period.
Table: 8 Change in Cash (Rs in millions)
Company Name 2000 2001 2002 2003 2004 2005 2006 2007 2008 2009 2010 2011 2012 2013 Average Aurobindo Pharma
Ltd. 101 -178.5 -107.9 -44.5 237.5 -1270.1 -3580 2607.5 1523.8 823.8 -1182.3 1082 -1005.6 1048.5 3.9429 Cadila Healthcare
Ltd. 3367.9 363 413 -283 108 241 -101 -66 -66 -26 -142 -759 138 -249 209.92 Cipla Ltd. -15.4 -97.5 24.5 68.8 -49.5 -332.8 -870.1 522.1 262.8 -78.4 -231.4 289.2 -500.1 590.3 -29.82 Divi'S Laboratories
Ltd. 0 1.1 -4.2 -31.4 27 -56.7 31.9 -15.5 -2.6 0 2 14 24.2 -45.7 -3.993 Dr. Reddy'S
Laboratories Ltd. 101.1 -4691.3 -1998.4 2803.2 -4836.4 2407.8 -8057.7 9200 1523 164 3018 -759 839 -595 -62.98 Glaxosmithkline
Pharmaceuticals
Ltd. 35.9 -108.8 -816.1 810.6 129.4 157.3 126.7 -1199.9 -7514.2 -7663.4 -2754.6 -2982.2 2360.1 246.8 -1369 Glenmark
Pharmaceuticals
Ltd. 232.5 26.4 4.8 -27.2 -1025.1 201.2 777.7 2.1 -5.1 66.1 -257.4 -164.6 -1199.5 596.8 -55.09 Lupin Ltd. 2.4 -69.1 74.2 -2.5 -27.4 -4380.2 1030.2 1377 2029.5 -252.9 7.4 176.3 -12.8 -2371.5 -172.8 Piramal Enterprises
Ltd. 158.2 390.3 76.3 83.8 79.8 -34.3 -111.3 -120.2 166 18.3 16501.2 16542.5 -89.5- -60.8 42.707 Sun Pharmaceutical
Inds. Ltd. -62.1 -42.2 -540.9 29.3 -8142.8 -3409.5 225 1234.2 -2881.6 -1599 1528.7 -1483.4 -530.9 1454.9 -1016
Industry Average 392.15 -440.66 -287.47 340.71 1349.95 -647.63 -1052.9 1354.13 -496.44 -854.75- 1651.28 1195.58 2.29- 61.53 -245.3
Table: 9 Quality Income (in times)
Company Name 2000 2001 2002 2003 2004 2005 2006 2007 2008 2009 2010 2011 2012 2013 Average
Aurobindo
Pharma Ltd. 0.112 0.123 0.168 0.193 0.055 0.090 0.174 0.217 0.088 0.331 0.301 -0.055 0.155 0.375 0.166 Cadila
Healthcare Ltd. 0.323 0.297 0.244 0.354 0.304 0.335 0.355 0.400 0.426 0.602 0.643 0.555 0.374 0.603 0.415 Cipla Ltd. 0.436 0.389 0.371 0.375 0.416 0.436 0.439 0.380 0.346 0.463 0.352 0.460 0.558 0.443 0.419 Divi'S
Laboratories Ltd. 0.209 0.351 0.469 0.514 0.484 0.512 0.655 0.809 0.754 0.851 0.839 0.782 0.742 0.825 0.628 Dr. Reddy'S
Laboratories Ltd. 0.456 1.069 0.836 0.480 0.073 0.320 1.048 0.386 0.399 0.574 0.473 0.547 0.574 0.815 0.575 Glaxosmithkline
Pharmaceuticals
Ltd. 0.197 0.173 0.309 0.530 0.791 1.028 1.103 1.174 1.192 1.017 1.027 0.610 0.790 0.590 0.752 Glenmark
Pharmaceuticals
Ltd. 0.254 0.334 0.397 0.399 0.458 0.422 0.580 0.960 0.989 0.408 0.732 0.622 0.673 0.775 0.572 Lupin Ltd. 0.155 0.249 0.180 0.224 0.126 0.252 0.359 0.383 0.319 0.408 0.399 0.381 0.534 0.898 0.348 Piramal
Enterprises Ltd. 0.276 0.177 0.251 0.320 0.314 0.341 0.327 0.409 0.296 0.401 34.199 0.180 -0.424 -0.428 2.617 Sun
Pharmaceutical
Inds. Ltd. 0.709 0.670 0.918 0.662 0.561 0.527 0.514 0.657 0.644 1.025 1.491 1.382 0.629 -2.223 0.583 Industry Average 0.31 0.38 0.41 0.41 0.36 0.43 0.56 0.58 0.55 0.61 4.05 0.55 0.46 0.27 0.708
3.5 Analysis of Quality Income of Indian Pharmaceutical Companies.
earnings quality. A ratio less than one reveals a low earnings quality; that is, the company may be overstating its true earnings. A ratio greater than 1 is indicative of the company’s strong ability to finance its business activities through its operating cash flow. Table 4.9 shows the average quality ratio of Indian pharmaceutical companies is 0.708 which is near to ideal ratio 1. The highest quality income ratio is 34.199 times in the year 2010 of Piramal Enterprises Ltd. Due to high quality income ratio in 2010, Piramal Enterprises Ltd. also maximum in average quality income ratio by 2.62 times and the minimum average quality income ratio 0.166 times of Aurobindo Pharma Ltd. during the study period. Few Indian pharmaceutical companies have negative quality income ratio during the study period which show the cash used in operating activities more than cash generate from the operating activities. The average quality income ratio of Cipla Ltd. is 0.419 times. The maximum quality income ratio of Cipla Ltd. is 0.56 times in the year 2012 and minimum is 0.35 times in the year 2008. If we ignore the quality income ratio of Piramal Enterprises Ltd. in 2010 than the overall result of quality is not satisfactory.
IV. IMPACT OF CASH MANAGEMENT ON PROFITABILITY:
Regression Analysis
To investigate the impact of CCC (Cash Conversion Cycle) on profitability, the model used for the regressions analysis is expressed within the general type as given in equation:
ROTA = f(ln sales, gear, cata, clta, turnca, cccdays) Equation
ROTA ȕ0ȕ1lnsalesitȕ2gearitȕ3cataitȕ4cltaitȕ5turncaitȕ6cccitİit [model ]
Where i denoting firms (cross-section dimension) starting from one to ten and t denoting years (time-series dimension) starting from one to fourteen.
The model specifies on top of is calculable using the regression-based framework (Fixed Effects and Pooled OLS) as used by Deloof (2003). Our model differs, initial by using ROTA as a comprehensive measure of profitability and also the model includes asset-management and funding policy as management variables. the information set used for this half is pooled across companies and years, given associate balanced panel data set of one hundred forty firm-year observations.
A classical check for panel information is one among mounted effects model (FEM) versus Random Effects Model (REM). In the REM, it's assumed that there's one common intercept term, however that the intercepts for individual companies vary from this common intercept in a very random manner. to see that of those estimators are a lot of applicable to use, each a fixed effects and a random effects expert was used to estimate the coefficients in model one. The Hausman check, that may be a check for the null hypothesis of no correlation, rejects this null hypothesis then the choice is taken to employ a fixed effects framework..
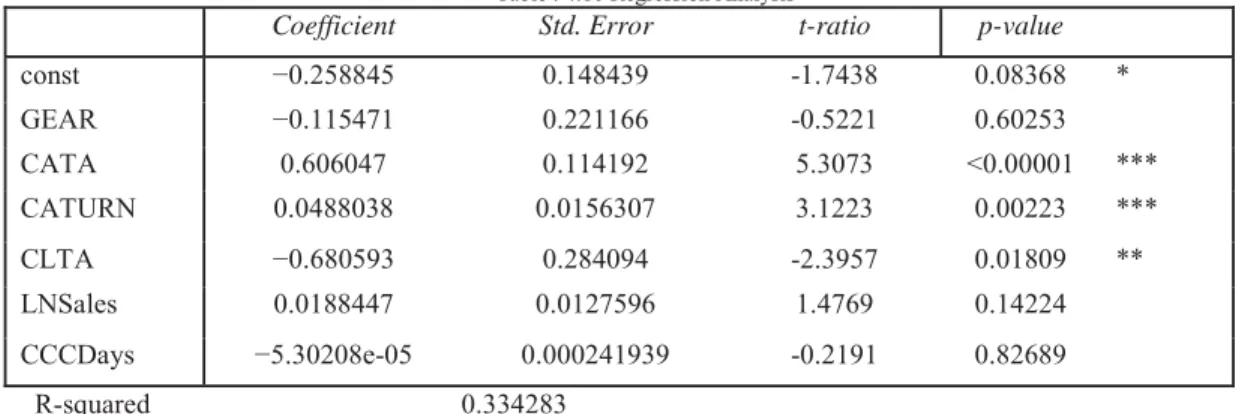
The Table 4.10 represents the results of regression two, applying a fixed effects methodology, wherever the intercept term is allowed to vary across companies. It’s immediately obvious from the adjusted R-squared values that the utilization of a firm specific intercept improves the informative power of those models. In Regression, the adjusted R-squared justify 33.42% of the variation in profitability
Table : 4.10 Regression Analysis
Coefficient Std. Error t-ratio p-value
const í 0.148439 -1.7438 0.08368 *
GEAR í 0.221166 -0.5221 0.60253
CATA 0.606047 0.114192 5.3073 <0.00001 ***
CATURN 0.0488038 0.0156307 3.1223 0.00223 ***
CLTA í 0.284094 -2.3957 0.01809 **
LNSales 0.0188447 0.0127596 1.4769 0.14224
CCCDays íH-05 0.000241939 -0.2191 0.82689
R-squared 0.334283
In this regression, the coefficient of CCCdays variable is negative in this regression, but the coefficient is not statistically significantly. The coefficients of the other variables included in the model are significant, except for GEAR and LNSales. Also the coefficient of GEAR and CLTA variables are negative in this regression. The explanatory variables explain 33.4 percent variation in return on total assets. One percent change in ROTA increases CATA, CATURN and LNsales by 0.606 percent, 0.0488 percent and 0.0188 percent respectively. One percent change in ROTA decrease GEAR, CLTA and CCCdays by 0.115 percent, 0.681 percent and 5.302 percent respectively, which is statistically significant at 5 percent level.
V. CONCLUSION
managers with data concerning the essential monetary management practices utilized by their peers and their peers attitudes toward these practices. The capital desires of a company modification over time as will its internal money generation rate. As such, the pharmaceutical companies ought to guarantee an honest synchronization of its assets and liabilities.
This study has shown that the thesis and Cipla Ltd.has been able to attain high scores on the varied elements of capital and this has completely impact on its profitableness. On this premise this trade is also referred because the ‘hidden champions’ and will so be used as best apply among the Indian Pharmaceutical trade.
REFERENCES
[1] Agarwal, Ajai K., ‘Working Capital: A tool to Control-Operations’, The Management accounting, Calcutta, Vol. 35, No. 9, Sept. 2000, pp. 660-665.
[2] Agarwal, J. D., ‘A Gaol Programming Model for Working Capital Management’, Finance India, New Delhi, Vol. 2, No. 2, June 1988, pp. 153- 163.
[3] Agarwal, P.K. and Varma, S.K. (2013) ‘Working capital management and corporate performance: evidence from a study of Indian firms’, Int. J. Indian Culture and BusinessManagement, Vol. 7, No. 4, pp.552–571.
[4] Austin, L., ‘Project EOQ: A Success Story in Implementing Academic Research’, Interfaces, Vol. 7, Nov. 4, Aug. 1977.
[5] Banerjee, D. and Hazza, M. K., ‘Working Capital Management in Grasim Industries Ltd.: A Case Study’, The Management Accountant, Calcutta, Vol. 27, No.5 May 1992.
[6] Baumal, W., “The transactions demand for cash: an inventory theoretic approach”, the quarterly journal of economics, November 1952, pp.545-566.
[7] Baxter, N.D., “Leverage, Risk of Ruin and Cost of Capital”, Journal of Finance, Vol. 22, September 1967, pp.395-403.
[8] Beaves, W. H., ‘Financial Ratios as Predictor of Failure, Empirical Research in Accounting, Selected Studies, Journal of Accounting Research, Sep. , Vol. 4, 1967.
[9] Ben-Horim, Moshe and Haim Levy, ‘Management of Account Receivable under Inflation’, Financial Management, Spring 1983, pp. 42-48.
[10] Bolsten, S.E., Managerial Finance, (Boston), Houghton Miffin Co. 1976, p. 388.
[11] Bray, J.N., “The Risk and Use of Debt Financing”, Unpublished Ph.D. Dissertation, UCLA, 1967.
[12] Brennan, M., Maksimovic, V. and Zechner, J., “Vender Financing”, Journal of Finance 43, 1988, pp. 1127-1141.
[13] Brewster, D. E., ‘Reducing the Investment in Debtors by Effective Credit Control’, Management Accounting, London, Vol. 52, No.9, Oct. 1974.
[14] CEmery, G.W., “An Optimal Financial Response to Variable Demand”, Journal of Financial and Quantitative Analysis 22, 1987, pp. 209-225.
[15] Ferri, M.G. and Jones, W.H., “Determinants of Financial Structure: A New Methodology Approach”, Journal of Finance, Vol. 34, June 1979, pp. 631-644.
[16] Keith, V. Smith, “Working Capital Management”, McGraw Hill Publishing Company, 1979.
[17] Irvin, F., “Retail Inventory Investment and the Cost of Capital”, The American Economic Review, 1981, p.633.
[18] Lewellen, W.g. and Jonson, R.W., “Better way to Monitor Accounts Receivables”, Harvard Business Review (May-June), pp. 101-119.
[19] Liberman, C., “Inventory Demand and Cost of Capital Effects”, The Review of Economic and Statistics, August 1980, pp. 348-356. [20] Miller, M.H. & Orr, D., “A Model for the Demand for Money by Firms. Quarterly Journal of Economics, No. 80, August, 1966, pp.
413-435.
[21] Ng. C.K., Smith, J.K. and Smith, R.L., “Evidence on the Determinants of Credit Terms Used in Inter Firm Trade”, Journal of Finance 54, 1999, pp. 1109-1129.
[22] Pandey, I.M., “The Financial Leverage in India: A Study”, Indian Management, Vol.23, No.3, March 1988, pp.1-19. [23] Petersen, M.A. and Rajan, R.G., “Trade Credit; Theories and Evidence” Review of Financial Studies 10, 1997, pp. 661-691.
[24] Pogue, G.A., Faucett R.B. and Bussard R.N., “Cash Management: A System Approach”, Industrial Management Reviews, (Feb. 1970), pp. 55-74.
[25] Ramamoorthy, V.E., “Working Capital Management”, IFMR, Chennai, 1976, p.11.
[26] Richards, V. D. & Laughin, E. J., ‘A Cash Conversion Cycle Approach to Liquidity Analysis’, Financial Management, Vol. 9, No. 1 (Spring, 1980), pp. 32-38.
[27] Smith K., “Profitability versus Liquidity Trade Off in Working Capital Management”, in Reading on the Management of Working Capital., 1980, Ed. K.K. Smith, St. Paul, West Publishing Company, pp. 549 –562.
[28] Smith M.B., “Modelling Association Between Working Capital and Operating Profit: Survey Findings”, Journal of Financial Management and Analysis, 1997, pp. 51-61.
[29] Soloman, E. and Pringle, J.J., “An Introduction to Financial Management”, Prentice-Hall of India, 1977, p. 182. [30] Soloman, E. and Pringle, J.J., “An Introduction to Financial Management”, Prentice Hall of India, 1978, p.218-221.