Computer-Generated Ovaries to Assist Follicle
Counting Experiments
Angelos Skodras1, Gianluca Marcelli2*
1German Centre for Neurodegenerative Diseases (DZNE), Tübingen, Germany,2School of Engineering and Digital Arts, University of Kent, Canterbury, United Kingdom
Abstract
Precise estimation of the number of follicles in ovaries is of key importance in the field of re-productive biology, both from a developmental point of view, where follicle numbers are de-termined at specific time points, as well as from a therapeutic perspective, determining the adverse effects of environmental toxins and cancer chemotherapeutics on the reproductive system. The two main factors affecting follicle number estimates are the sampling method and the variation in follicle numbers within animals of the same strain, due to biological vari-ability. This study aims at assessing the effect of these two factors, when estimating ovarian follicle numbers of neonatal mice. We developed computer algorithms, which generate models of neonatal mouse ovaries (simulated ovaries), with characteristics derived from ex-perimental measurements already available in the published literature. The simulated ova-ries are used to reproducein-silicocounting experiments based on unbiased stereological
techniques; the proposed approach provides the necessary number of ovaries and sam-pling frequency to be used in the experiments given a specific biological variability and a de-sirable degree of accuracy. The simulated ovary is a novel, versatile tool which can be used in the planning phase of experiments to estimate the expected number of animals and work-load, ensuring appropriate statistical power of the resulting measurements. Moreover, the idea of the simulated ovary can be applied to other organs made up of large numbers of indi-vidual functional units.
Introduction
Accurate estimation of ovarian follicle numbers is the foundation of reproductive biology [1].
Follicle counts are important for the comparison between wild-type animals and those carrying
specific genetic mutations that affect the reproductive system [2], the determination of the
ad-verse effects of environmental toxins [3] and cancer chemotherapeutics [4], as these factors
may affect the number of follicles within the ovaries. Furthermore, precise follicle counts are required when studying the developmental progress of the ovarian follicles, their quiescent
state, their recruitment and loss thereof [5and6]. The number of follicles in an ovary of an
ani-mal can be considered as a statistical variable that follows a probability distribution. This
OPEN ACCESS
Citation:Skodras A, Marcelli G (2015) Computer-Generated Ovaries to Assist Follicle Counting Experiments. PLoS ONE 10(3): e0120242. doi:10.1371/journal.pone.0120242
Academic Editor:Norbert Gleicher, Center for Human Reproduction, UNITED STATES
Received:August 25, 2014
Accepted:January 20, 2015
Published:March 26, 2015
Copyright:© 2015 Skodras, Marcelli. This is an open access article distributed under the terms of the Creative Commons Attribution License, which permits unrestricted use, distribution, and reproduction in any medium, provided the original author and source are credited.
Data Availability Statement:All data and algorithms are available from corresponding author upon request by email
Funding:The authors received no specific funding for this work.
distribution is representative of the entire population of ovaries and can be characterized by the mean and standard deviation. The standard deviation expresses the dispersion of the distri-bution and can be seen as a measure of the biological variability. When determining the num-ber of follicles in the ovary an accurate estimate of the mean and the standard deviation need to be derived. In this regard, appropriate sample sizes are vitally important for narrowing
confi-dence intervals to acceptable levels [7].
Mean follicle numbers in mice are known to vary considerably between animals of the same
strain [8], as well as between strains [9]. An example of this variability is reported in Myers
et al., [8]; various research groups report divergent number of follicles within the same strain, showing evidence of biological variability, albeit using a variety of counting methods. The vari-ability presented specifically in the C57Bl/6 mouse line in the same age groups is particularly
remarkable. It is on the basis of this variability that Faddy and Gosden [7] emphasize the
re-quirement for much larger datasets than those currently used, to assess properly the follicle numbers within ovaries of specific species, strain and age. Our work aims at assessing how the biological variability, i.e. dispersion of the distribution, affects counting experiments, and at as-sisting in choosing an adequate number of animals and sampling frequency; this will allow, on one hand, avoiding inaccurate follicle estimates and drawing ambiguous conclusions from un-derpowered studies, and on the other hand, reducing the unnecessary use of tissue and experimental workload.
We have developed computer algorithms to computationally generate mouse ovaries, based on spatial and morphological characteristics derived from measurements performed on actual ovarian sections of neonatal mice. Herein, we report how the deviation of the follicle-number estimates from their actual mean is affected by the number of ovaries and sampling
frequency used.
Methods and Algorithms
In this work we use the term‘simulated’ovary to indicate a computer model made of spheres
in a 3-dimensional space, the size and the spatial distribution of which closely resemble those of follicles within a real ovary. More specifically, the sizes of these spherical structures are based on the average sizes of actual follicles measured on ovarian sections of C57Bl/6 mice, for
different developmental stages [10and11], namely primordial, primary and secondary.
Transi-tional follicles (the stage between primordial and primary) were not modelled in this work due to the fact that this stage is still equivocal among researchers, both from a morphological and a
developmental point of view [10]. Furthermore, due to the fact that we are examining neonatal
mouse ovaries, any mature follicles, i.e. from pre-antral stage onwards, were not modelled. The spherical structures in the simulated ovary contain co-centric spheres, corresponding to the oo-cyte, nucleus and nucleolus of the follicle. The sizes of the spheres are assigned based on
experi-mental measurements which depend on the developexperi-mental stage of the follicles, the animal’s
age as well as the species. It must be stressed that the simulated ovary is contingent on the ex-periment that needs to be simulated.
Biological data
The raw data for the modelling were collected from published data of the neonatal mouse ova-ries. Actual follicle number estimates were obtained from the data published by Kerr's group
[12], presented inTable 1. Follicle sizes and spatial data were obtained by Da Silva-Buttkus
et al., [11], for day 8 and day 12 ovarian sections of C57Bl/6 mice; follicle diameters and follicle
We need to emphasise here two important issues. Firstly, we are using the follicle-number
of day 7 mice (Table 1), although associating them to the spatial and size characteristics of day
8 mouse follicles (Table 2). Given the inherent variation in the time of birth and time of
sacri-fice for the neonatal mice, we assume that follicle distributions of day 8 mice are approximately
similar to those of day 7 mice. Secondly, the follicle diameters,Df, were measured only on those
follicles showing a clear sharp nucleus on the section, disregarding any follicles that had a fuzzy or imperceptible nuclear profile. The diameter is determined as the average between two
per-pendicular segments taken on the follicle profile (see methods in [11]). The diameters of the
oocyte,Do, were additionally measured on ovarian sections from randomly selected follicles,
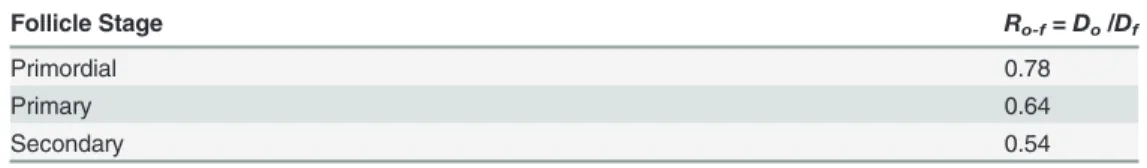
which present an oocyte in their cross-sectional profile. The following diameter ratios were
then calculated:Ro-f=Do/Df, whereDoandDfare the average oocyte and follicle diameters,
re-spectively; these ratios are developmental-stage dependent, as reported inTable 3, and were
used to generate the simulated ovaries.
Computer generation of simulated ovaries
The following subsections will illustrate how simulated ovaries are generated; the relative com-puter algorithms were implemented in Fortran 77, unless otherwise stated.
Generating follicles numbers and diameters
In order to generate a simulated ovary of specific age we randomly select the number of follicles for each developmental stage. We assume that follicle numbers follow a Gaussian distribution,
with mean and standard deviation reported inTable 1: a random number (Nstage) of follicles is
obtained for the given developmental stage. We then generate each follicle by randomly assign-ing to it a diameter. We assume that follicle diameters follow a Gaussian distribution, with
mean and standard deviation reported inTable 2. The diameter of the oocyte for each follicle is
Table 1. Average follicle numbers in whole neonatal C57Bl/6 mouse ovaries.
Age in days
Total primordial follicles (±SEM)
Total primary follicles (±SEM)
Total secondary follicles (±SEM)
7 1987±203 569±35 5±4
12 2317±289 362±34 328±34
Average follicle numbers in whole neonatal mouse ovaries (mean±standard error of the mean): data reported by Kerret al. [12]. 6 mice were used to estimate day 7 follicle numbers and 7 mice to estimate day 12 follicle numbers.
doi:10.1371/journal.pone.0120242.t001
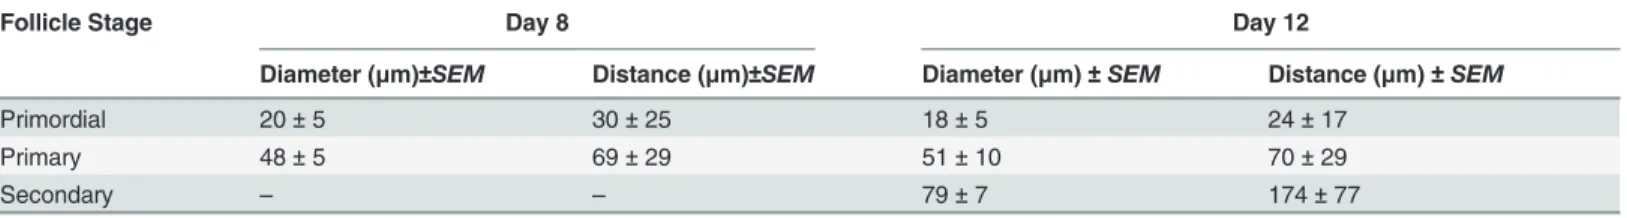
Table 2. Average folliclediameteranddistancefrom ovarian epithelium wall.
Follicle Stage Day 8 Day 12
Diameter (μm)±SEM Distance (μm)±SEM Diameter (μm)±SEM Distance (μm)±SEM
Primordial 20±5 30±25 18±5 24±17
Primary 48±5 69±29 51±10 70±29
Secondary – – 79±7 174±77
Average folliclediameteranddistancefrom ovarian epithelium wall (mean±standard error of the mean). Data from neonatal C57Bl/6 mouse ovarian
section analysis [11].
assigned according to the ratio values reported inTable 3. This is repeated untilNstagefollicles are generated.
Inserting follicles into the simulated ovary
The process described in the previous subsection generatesNtot_fol=∑Nstagespheres of
differ-ent sizes, which need to be inserted in a virtual spherical volume (the simulated ovary) without
overlapping, and with a spatial arrangement typical of follicles in an actual ovary [11and13].
Firstly, the volume of the simulated ovary,Vovary, has to be selected. For this purpose, the total
volume occupied by the follicles,Vtot_fol, is calculated as the sum of the volumes of each follicle,
Vi fol:
Vtot fol¼
X
Ntot fol
i¼1 Vi
fol ð1Þ
For simplicity, the simulated ovary is assumed to be spherical, with a volumeVovary. The value
to be assigned toVovaryis calculated as inEq. 2:
Vovary¼ aVtot fol ða > 1Þ ð2Þ
whereais an arbitrary parameter (a>1), which is adjusted in order to accommodate all the
fol-licles and to ensure that the simulated is realistic, as it is explained below.
In order to insert a follicle into the simulated ovary volume, a radial-direction of the ovary is
randomly chosen (see page 111 of [14]). The follicle is placed along the chosen direction, at a
distance from the ovarian wall randomly picked from a Gaussian distribution, with mean and
standard deviation as reported inTable 2.
Once all theNtot_folfollicles are inserted in the virtual spherical volume, the follicle profile
density,ρprofile, is calculated on the equatorial section of the simulated ovary:
rprofile¼
X
Np
i¼1 Ai
profile=Asection ð3Þ
whereAsectionis the area of the equatorial ovarian section,Aiprofileis the area occupied by
folli-cle-profilei, andNpis the number of follicle profiles on an equatorial section (see alsoFig. 1
below). The simulated ovary is accepted if the profile density is within 10% of the one measured
from real sections (seeTable 4and Supporting Information in [11]); otherwise a new ovary is
generated with a different choice of the parametera(Eq. 2). Out of all the simulated ovaries we
have generated in this work, the value ofawas found to range between 2.3–2.6, in order to get
a density within the specified 10% requirement. The overall procedure ensures that each
simu-lated ovary is made of a number of follicles and spatial properties similar to those found in an actual ovarian section.
350 simulated ovaries of day 8 and 12 were generated to perform the analyses herein; this number of ovaries allows sampling adequately all the relevant Gaussian distributions men-tioned above, and ensures realistic follicle numbers, diameters and spatial arrangement. Table 3. Ratios between oocyte and the follicle diameter,Ro-f.
Follicle Stage Ro-f=Do/Df
Primordial 0.78
Primary 0.64
Secondary 0.54
Assessing errors on follicle-number estimates
The primary objective of this work is to assess the error when estimating follicle numbers in neonatal C57Bl/6 mouse ovaries. For this purpose, the simulated ovaries are computationally analysed in order to reproduce follicle counting experiments. The ovaries are virtually sec-tioned and their follicle-number is estimated by applying the unbiased stereological technique,
more specifically the disector and the fractionator ([14,15and16], see alsoS1 Supporting
In-formation). Thein-silicostereological technique produces estimates of follicle numbers,
pri-mordial or primary, for different sample sizes,N, and sampling frequencies,f. We usef= 1/5
(count 1 section out of 5),f= 1/20 andf= 1/50.
The unique advantage of the simulated ovaries is that the total number of follicles isa priori
known; therefore, it can be used for a direct comparison with its estimates. We recall that we
generated simulated ovaries with follicle numbers following a distribution of known mean,μ,
and standard deviationσ. In this work we want to provide anestimateof the standard error of
the mean,SEMN,ffor the number of follicles, when using a sample ofNovaries and a sampling
frequencyf. ThisSEMN,fis effectively an estimate of the error of follicle numbers when
per-forming a real counting experiment withNovaries and sampling frequencyf.
In order to estimate theSEMN,fwith sufficient statistical power, we generatedLsamples, of
Novaries each. Each sample,i, provides a different sample mean,mNi;f (the arithmetic average
of theNestimates of the follicle-number). ThemNi;f themselves are values of a statistical
vari-able following its own distribution with standard deviationsNm;f. ThissNm;f is exactly what we
want to estimate. Note that it is impossible to calculate exactlysNm;f, as this would require the
entire population in the distribution to be taken into account; therefore we can only provide an estimate using the following formula:
sNm;f sN;f ¼
ffiffiffiffiffiffiffiffiffiffiffiffiffiffiffiffiffiffiffiffiffiffiffiffiffiffiffiffiffiffi XL
i¼1
ðmNi;f mÞ
2
L
s
ð4Þ
InEq. 4,μis the mean originally used to generate Gaussian distribution of the follicle
num-bers in the simulated ovaries, which can be found inTable 1. We stress here that, since the true
mean of the distribution is known,Lis reported in the denominator ofEq. 4, rather thanL-1,
which is used commonly when analysing experimental data, where the true population mean is
not known. Furthermore, if we were to use a low value ofL, theSEMN,fwould depend on the
chosen set of simulated ovaries; to eliminate this dependence, we useL= 10,000 samples by
ap-plying the bootstrapping approach ([17], see alsoS2 Supporting Information). Samples ofN
ovaries (N= 1, 2, 3, 4. . ., 20) are generated by picking, with replacement, from the pool of 350
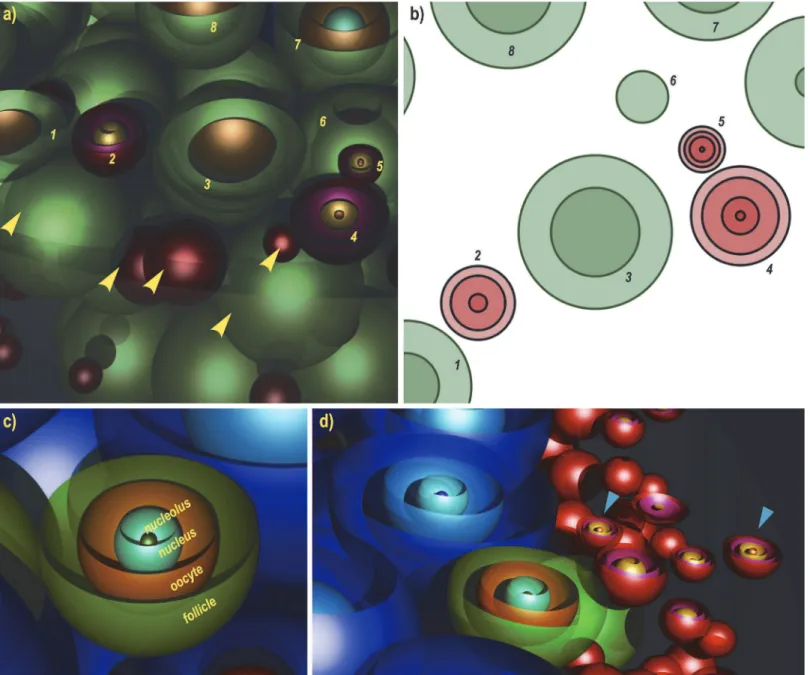
Fig 1. Local follicle distribution in the 3-dimensional simulated ovarian volume.3-D renderings of day 8 and day 12 simulated ovaries, created using the Perspective of Vision Ray tracer (www.povray.org). Red spheres are primordial follicles, green are primary and blue are secondary follicles. Each follicle has a unique diameter, randomly selected from a specific distribution as explained in methods. Images a) and b) show the whole ovary (day 8 and day 12, respectively); the distribution of follicles inside the 3D volume of these ovaries is shown in the images c) (day 8) and d) (day 12). The resulting
two-dimensional equatorial cross-sections are shown the images e) (day 8) and f) (day 12), drawn in MS Excel. Follicle numbers for Day 8 simulated ovary: 2058 Primordial, 768 Primary, 5 Secondary. Follicle numbers for Day 12 simulated ovary: 2245 Primordial, 428 Primary, 389 Secondary.
doi:10.1371/journal.pone.0120242.g001
Table 4. Profile density,ρprofile, calculated from actual ovarian sections [11].
Ovary age Actualρprofile(Eq. 3)
Day 8 0.47
Day 12 0.64
ovaries. Each sample yields an estimate of the follicle number mean,mNi;f.Eq. 4is applied to
obtain an estimate of the standard error of the mean:SEMN,f~sN,f. This is repeated for each
of the 20 groups made of 10,000 samples ofNovaries. The bootstrapping procedure is
recom-mended when the theoretical distribution of a statistical variable of interest is complicated [18],
as in the case of the simulated ovary. Furthermore, if we were to generate simulated ovaries
on-the-fly, we would need to generate 10,000×(1+2+3+. . .+20) = 2,100,000 ovaries for each age,
which is impractical even for a computational procedure.
Results
Structure of the simulated ovary
Fig. 1illustrates two simulated ovaries produced using the algorithm described in the Methods
and Algorithms section and visualised in 3D (using the Persistence of Vision Ray tracer;www.
povray.org). In these illustrations the oocyte, nucleus and nucleolus of the follicles have been
added, in order to show the internal appearance of the follicle profiles upon sectioning (Figs.1
and2). InFig. 1C and 1D, the hemispheres (virtual half sectioning) show the internal
distribu-tion of the follicles in three dimensions; the corresponding two dimensional cross-secdistribu-tions
pro-duced from the same location of the simulated ovaries are shown inFig. 1E and 1F.Fig. 2A and
2Bpresent a‘cortical’area close to the edge of a day 8 ovary, where the follicle density is high.
Fig. 2Cshows internal structures, i.e. oocyte nucleus and nucleolus, for illustrative purposes.
Fig. 2Dshows a secondary, a primary and two primordial follicles with all internal structures visible (day 12 ovary).
Estimating the Standard Error of the Mean (
SEM
)
Thein-silicounbiased stereological technique for estimating numbers of follicles is applied to
the simulated ovaries.L= 10,000 samples, each containingNovaries, are chosen and for each
sample a follicle-number mean,mNi;f, is estimated using a specific sampling frequency,f. The
standard error of the mean,SEMN,f, is estimated according toEq. 4, for different sample sizes
(namelyN= 1, 2, 3, 4. . ., 20 ovaries), for different counting frequencies (f= 1/5,f= 1/20 and
f= 1/50), different ages and follicle stages.
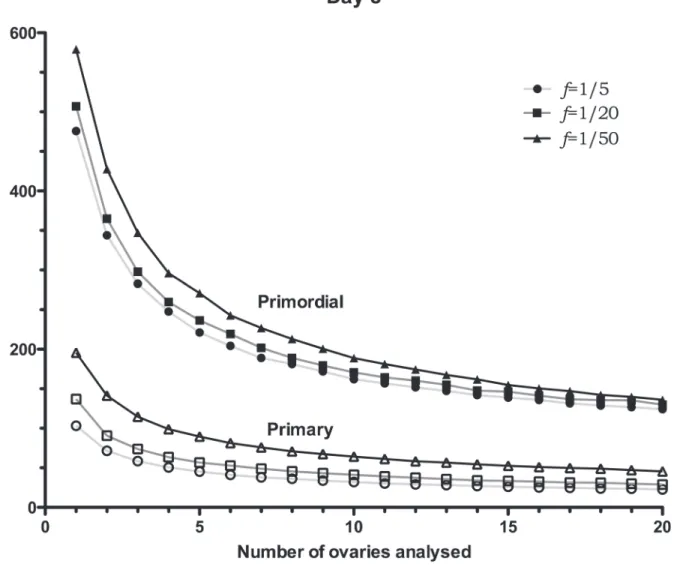
Fig. 3reports theSEMs of day 8 mouse ovaries for primordial and primary follicles; as
ex-pected,Fig. 3shows a decreasing trend in theSEMas the number of ovaries used increases. For
instance, the graph shows that in the case in which two ovaries are used andf= 1/5, theSEM
for the primordial follicle number is equal to 344 follicles, which corresponds to a relative
devi-ation (SEM/mean) of 17% (given that the mean number of primordial follicles is 2000),
where-as, for 10 ovaries, the relative deviation (SEM/mean) drops to around 8%. It is, also, interesting
to notice how the sampling frequency affects theSEMs. In the case in which two ovaries are
used, theSEMfor the primordial follicle-number is equal to 364 follicles forf= 1/20 (SEM/
mean = 18.2%), while forf= 1/50,SEM= 428 (SEM/mean = 21%), which corresponds to an
extra error of 64 follicles.
As expected, a similar trend is obtained when counting primary follicles in day 8 ovaries, (Fig. 3); in fact, theSEMdecreases as the sample size increases. Indicatively,SEM/mean = 13%
when using two ovaries and a sampling frequencyf= 1/5, which drops to 8% when using 10
ovaries andf= 1/50. A further drop to 6% occurs when the frequency is increased tof= 1/5,
which is negligible considering the significant increase in lab work to achieve this.
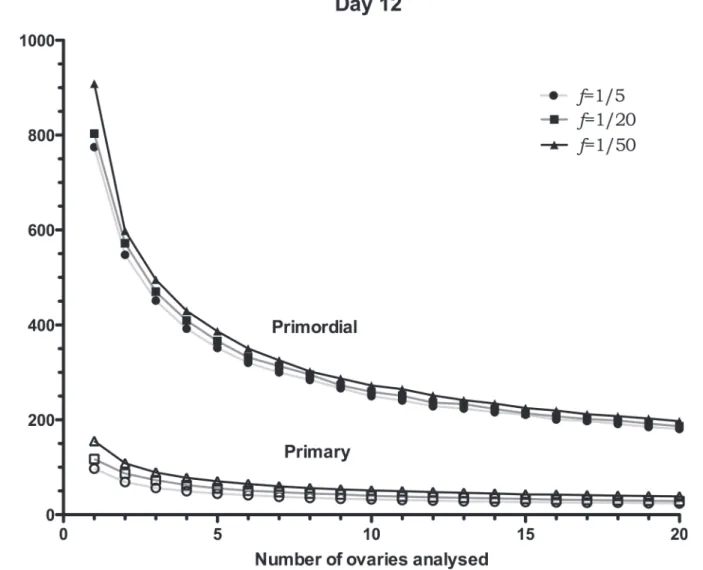
TheSEMs for day 12 ovaries are reported inFig. 4, in agreement with those of day 8; as the
(Table 1), theSEMs reported are greater, especially for smaller sample sizes. Interestingly,
Fig. 4shows that if four or less ovaries are used to estimate the number of primordial follicles in a day 12 mouse, regardless of the sampling frequency, there would be an error of around 400 follicles, a finding which is quite significant when compared with the average follicle number, 2300. Errors of this magnitude may be crucial when performing experiments to distinguish two follicle-number distributions, when the difference may be due to developmental age, effects from drugs or radiation, or the effect of a mutation. A potential application of the simulated Fig 2. Details of 3D illustration of a simulated ovary.Part of a day 8 simulated ovary, a) and its corresponding cross section, b). Primordial (red) and primary (green) follicles numbered respectively in both a) and b) are virtually sectioned. Yellow arrows point at follicles in the immediate vicinity of the numbered ones, albeit not appearing in the 2D section. Oocyte, nucleus and nucleolus have been added to the model for illustrative purposes, c). These structures can also be simulated based on real measurements, in order to be used in the stereological counting. d) shows an example of a secondary, a primary and two primordials (blue arrows) with all internal profiles visible (day 12 ovary).
ovary would be to investigate the accuracy of the follicle number estimates in a mouse ovary where the follicle number is significantly different from a control.
Discussion and Conclusions
The accurate estimation of follicle numbers in mammalian ovaries is a crucial and still
chal-lenging task in the field of reproductive biology [19]. The accuracy of these estimates is affected
by two factors: the biological variability within a given mouse line and the frequency used to sample the ovary. A quantitative approach has been presented in this work, which simulates
mouse ovaries of a specific age and strain and reproduces counting experimentsin-silico. This
approach can be applied for ovaries of any mammal, provided that minimal information about follicle-number distributions and spatial arrangement are available. The simulated ovary is a computational tool designated to assist the investigator in improving efficiency when perform-ing countperform-ing experiments, both in terms of use of tissue and laboratory time.
Fig 3. Day 8SEMs of follicle-number estimates.SEMs of follicle-number estimates for day 8 simulated ovaries. TheSEMs, calculated using 10,000 samples, are reported for different number of ovaries (N= 1, 2. . .and 20 ovaries), and sampling frequencies,f.SEMs are reported for primordials (filled symbols) and primaries (non-filled symbols). Distribution properties (μ±SEM): Primordial: 2000±203, Primary: 570±35 (seeTable 1).
We have presented quantitatively how the accuracy in estimating the mean follicle number
is affected by varying the number of ovaries and choosing different counting frequency—Figs.
3and4. Those figures can be used for better experiment planning. For instance, while on one
hand, a high number of ovaries may be required to reduce the error down to a given threshold, on the other hand, our work shows how to reduce the number of sections analysed, which may result in an overall less labour-intensive experiment. As an example, if an accuracy of 10% is re-quired (error of around 200 follicles for a population with a mean of 2000), at least 6 ovaries
must be used (Fig. 3), but the sampling frequency needs to be high,f= 1/5, i.e. count 1 section
out of 5. Usingf= 1/50, rather thanf= 1/5 would require 9 ovaries (Fig. 3), but would
signifi-cantly reduce the ovarian sections to count, and therefore lab time, as fewer sections in total
would be required. In order to appreciate the reduction in labour time, let’s assume a set of
neo-natal mouse ovaries of 600μm diameter, containing 2000 follicles on average. Selecting a sec-tion thickness of 5μm, each ovary would produce approximately 120 serially-cut secsec-tions.
Referring toFig. 3, estimating the follicle number with an error of 200 follicles, one can either
Fig 4. Day 8SEMs of follicle-number estimates.SEMs of follicle-number estimates for day 12 simulated ovaries. TheSEMs, calculated using 10,000 samples, are reported for different number of ovaries (N= 1, 2. . .and 20 ovaries) and sampling frequencies,f.SEMs are reported for primordials (filled symbols) and primaries (non-filled symbols). Distribution properties (μ±SEM). Primordials: 2300±289, primaries: 360±34 (seeTable 1).
sample 10 ovaries counting one every 5 sections, or use 15 ovaries counting one every 50 sec-tions. In the first case, 240 sections would be sampled, whereas in the latter, only 36 sections would be required to reach a similar accuracy.
It is interesting to compare theSEMresults in Figs.3and4to the experimental results by
Kerret al. [12], also reported inTable 1. InFig. 3theSEMfor primordial follicles is 204 (6
ova-ries andf= 1/5), while the experimentalSEMis 203; for primary follicles theSEMfromFig. 3
is 41, while the experimentalSEMis 35. For day 12,Fig. 4, theSEMfor primordial follicles is
300 (7 ovaries andf= 1/5), while the experimentalSEMis 289; for primary follicles the SEM
fromFig. 4is 37, while the experimentalSEMis 34. The close match between the calculated
and experimentalSEMs corroborates the validity of the simulated ovary.
Sometimes, a caveat for a sufficient number of animals is the challenge to harvest them; mice need to be bred, which can be expensive and time-consuming. Furthermore, if the study involves a mutation that affects the health of the mouse, as well as fertility, it may be difficult to collect a large number of ovaries. In those cases in which the number of ovaries cannot be cho-sen arbitrary, the simulated ovary can provide insight on how a higher a number of sections can improve the counting accuracy. This applies particularly to experiments performed using
human ovaries, which are extremely rare and challenging to obtain (e.g. the data set in [20]).
Therefore, careful experiment planning and best use of tissue is of strategic importance to en-sure that follicle numbers are estimated with the required accuracy. Hence, the proposed ap-proach can be applied in the planning phase, to estimate the requirements in terms of tissue and laboratory time; it may well be that the higher time demand in using more ovaries can be offset by lowering the sampling frequency.
Finally, the simulated ovary approach can be adapted for and applied to other organs char-acterised by a large number of individual functional units (e.g. neuronal and glial cells in the brain). In fact, the study of the development of these organs, or the effects of toxins, radiation exposure, environment or genes on their function, directly relates to the accurate counting of their functional units.
Supporting Information
S1 Supporting Information. Application of the unbiased stereological technique. (DOCX)
S2 Supporting Information. Schematic of bootstrapping approach.Schematic representa-tion of the bootstrapping approach for generating random samples of simulated ovaries. (DOCX)
Author Contributions
Conceived and designed the experiments: AS GM. Performed the experiments: AS GM. Ana-lyzed the data: AS GM. Contributed reagents/materials/analysis tools: AS GM. Wrote the paper: AS GM.
References
1. Finch CE, Holmes DJ. Ovarian aging in developmental and evolutionary contexts. Annals of the New York Academy of Sciences. 2010. p. 82–94.
2. Falender AE, Shimada M, Lo YK, Richards JS. TAF4b, a TBP associated factor, is required for oocyte development and function. Dev Biol. 2005; 288:405–19. PMID:16289522
4. Perez GI, Knudson CM, Leykin L, Korsmeyer SJ, Tilly JL. Apoptosis-associated signaling pathways are required for chemotherapy-mediated female germ cell destruction. Nat Med. 1997; 3:1228–32. PMID:
9359697
5. Gougeon A, Ecochard R, Thalabard JC. Age-related changes of the population of human ovarian folli-cles: increase in the disappearance rate of non-growing and early-growing follicles in aging women. Biol Reprod. 1994; 50(3):653–63. PMID:8167237
6. Gougeon A. Regulation of ovarian follicular development in primates: facts and hypotheses. Endocr Rev. 1996; 17:121–55. PMID:8706629
7. Faddy M, Gosden R. Numbers of Ovarian Follicles and Testing Germ Line Renewal Facts and Fallacies ND ES SC CE Key words. 2007;(August):1951–2.
8. Myers M, Britt KL, Wreford NGM, Ebling FJP, Kerr JB. Methods for quantifying follicular numbers within the mouse ovary. Reproduction. 2004; 127:569–80. PMID:15129012
9. Canning J, Takai Y, Tilly JL. Evidence for genetic modifiers of ovarian follicular endowment and devel-opment from studies of five inbred mouse strains. Endocrinology. 2003; 144:9–12. PMID:12488324
10. Picton HM. Activation of follicle development: The primordial follicle. Theriogenology. 2001. p. 1193–
210.
11. Da Silva-Buttkus P, Marcelli G, Franks S, Stark J, Hardy K. Inferring biological mechanisms from spatial analysis: prediction of a local inhibitor in the ovary. Proc Natl Acad Sci U S A. 2009; 106(2):456–61. doi:
10.1073/pnas.0810012106PMID:19122142
12. Kerr JB, Duckett R, Myers M, Britt KL, Mladenovska T, Findlay JK. Quantification of healthy follicles in the neonatal and adult mouse ovary: evidence for maintenance of primordial follicle supply. Reproduc-tion. 2006; 132(1):95–109. PMID:16816336
13. Sforza C, Vizzotto L, Ferrario VF, Forabosco A. Position of follicles in normal human ovary during defin-itive histogenesis. Early Hum Dev. 2003; 74:27–35. PMID:14512179
14. Howard VC, Reed GM. Unbiased Stereology. Three—Dimensional Measurement in Microscopy. BIOS Scientific Publishers Limited; 1998.
15. Sterio DC. The unbiased estimation of number and sizes of arbitrary particles using the disector. J Microsc. 1984; 134:127–36. PMID:6737468
16. Gundersen HJ, Jensen EB. Stereological estimation of the volume-weighted mean volume of arbitrary particles observed on random sections. J Microsc. 1985; 138:127–42. PMID:4020857
17. Press WH, Teukolsky SA, Vetterling WT, Flannery BP. Numerical Recipes 3rd Edition: The Art of Sci-entific Computing. Sample page from NUMBERICAL RECIPES IN C. 2007.
18. Adèr HJ, Mellenbergh GJ, Hand DJ. Advising on research methods: A consultant’s companion. Hui-zen, The Netherlands: Johannes van Kessel Publishing.; 2008.
19. Charleston JS, Hansen KR, Thyer AC, Charleston LB, Gougeon A, Siebert JR, et al. Estimating human ovarian non-growing follicle number: The application of modern stereology techniques to an old prob-lem. Hum Reprod. 2007; 22:2103–10. PMID:17548367