215
Abstract
The applications of Gy’s formula are appropriate for calculating variances of the fundamental sampling error (FSE) at any stage of the sampling protocol and before samples are collected as well. However, the formula can be inaccurate because general factors are used to estimate the ore characteristic. In order to allow the calculation of fundamental sampling error and the minimum representative sample masses without using Gy’s factors, there are experiments to calibrate the sampling parameters, name-ly: the heterogeneity test (HT); the sampling tree experiment (STE) and the segrega-tion free analysis (SFA). The present work describes the experimental procedure for the three calibration methods using bauxite and shows the correlation between them.
Keywords: sampling protocols; fundamental sampling error; bauxite.
Resumo
A fórmula de Gy é apropriada para calcular a variância do erro fundamental de amostragem (FSE), em qualquer estágio do protocolo de amostragem e, mesmo, antes de a amostra ser coletada. Entretanto a fórmula pode ser inacurada por utilizar fatores aproximados para todos os tipos de minérios. Para calcular a variância do erro fundamental de amostragem e as massas mínimas das amostras sem usar os fatores de Gy, existem experimentos para calibrar os parâmetros de amostragem, a saber: teste de heterogeneidade (HT); experimento da árvore (STE) e análise de segregação livre (SFA). O presente trabalho descreve os procedimentos experimentais para a bauxita, utilizando esses três métodos de calibração, e apresenta a correlação entre eles.
Palavras chave: Protocolos de amostragem, erro fundamental de amostragem, bauxita. Daniel Armelim Bortoleto
Department of Mining and Petroleum Engineering, University of São Paulo, Brazil
Ana Carolina Chieregati
Doutor Professor
Department of Mining and Petroleum Engineering, University of São Paulo, Brazil
Antônio Henrique Rietra Pereira
Alcoa World Alumina, Juruti Mine, Brazil [email protected]
Raiza Cavalcante Oliveira
Alcoa World Alumina, Juruti Mine, Brazil [email protected]
The application of sampling
theory in bauxite protocols
Teoria da amostragem aplicada aos protocolos de
bauxita
Mining
Mineração
1. Introduction
Sampling theory of broken material ores cannot be mentioned without a direct reference to Gy’s fundamental contribu-tions (Gy, 1998). According to Minnnitt
(2007) apud François-Bongarçon (1998), the fundamental sampling error (FSE) is the smallest achievable residual average error, because of the physical and
chemi-cal composition as well as the particle size distribution. FSE can be determined by Gy´s formula, applicable to all kinds of ore (Equation 1):
(1)
Where Ms is the mass of selected sample, ML is the mass of the original lot, c is the mineralogical factor, f is the shape
factor, g is the granulometric factor, l is the liberation factor and dN is the “top size”. Furthermore, the formula allows
2. Methodology
(2)
Heterogeneity test (HT)
Initially, a 500 kg sample repre-senting the typical aluminium ore was selected at the mine, then crushed and screened in four size fractions: “-38.1 mm +25.4 mm”; “-25.4 mm +12.7 mm”;
“-12.7 mm +6.3 mm”; “-6.3 mm +1.2 mm”. For each size fraction, 50 groups of at least 50 fragments each, collected one by one at random, were selected. Once samples were weighted and analyzed, the
mass Mq and grade aq for each group of fragments, as well as the average masses Mq and weighted average grades aQ were calculated according to Equation 3 (Koyama et al., 2010).
(3)
The estimated constant factor of constitutional heterogeneity, EST IHL, was calculated according to Equation
4, for each of the four size fractions. These factors generate a regression line calculated using the four resulting
points, which allows estimating the parameters K and alpha of Equation 2 (Pitard, 1993).
(4)
The heterogeneity test allows the experimental calibration of the
sam-pling constants K and alpha, which must be calibrated for each particular
ore at a particular grade.
Sampling tree experiment (STE)
The sampling tree experiment pro-posed by François-Bongarçon (Minnitt (2007) apud François-Bongarçon 1995 and 1998) follows a detailed analysis of the application of Gy´s formula to deter-mine the fundamental sampling error. A representative 60 kg sample was collected at the mine. The primary crushing stage using a jaw crusher reduces the ore nomi-nal size to a uniform 95% passing 25.4 mm. One quarter of the total lot is split out
and forms the irst nominal size fraction. The remainder of the ore is then crushed to 95% passing in 6.3 mm and the lot is then split into three equal portions. One of these portions is set aside and constitutes the second nominal size fraction. The remaining two fractions are recombined, crushed to 95% passing 2.0 mm and split into two portions of equal mass. One por-tion is set aside as the third nominal size fraction and the remaining one, crushed to
95% passing 0.1 mm, composes the fourth nominal size fraction. This procedure gen-erates four portions of more or less equal mass, about 15 kg. Using a rifle splitter, each of these portions is now split into 32 sub-samples per fraction. All samples are weighted and chemically analysed. Ac-cording to Minnitt et al. (2007), the form of Gy´s equation can be changed by taking the logarithms of both sides, transposing to Equation 5.
(5)
estimate the sampling constants K and alpha of Equation 2 are described as
follows, where K is a speciic constant to a given ore type at a given grade, and
alpha, is the exponent of original Gy´s cubic formula
Segregation free analysis (SFA)
Both the heterogeneity test and the sample tree experiment suffer from weaknesses that cast suspicion on the derived values for K and alpha. Minnitt
et al. (2011) proposed a new test called segregation free analysis (SFA). The nominal (average) fragment size, dN, for a fragment passing between two screens
is given by Equation 6, where USS is the upper screen size and LSS is the lower screen size.
(6)
The material, 300 kg of crushed bauxite collected from many cuts in the sampling station, was classiied at 14 size fractions: “-38.1 mm +25.4mm”, “-25.4 mm +12.7mm”; “-12.7 mm +6.3 mm”; “-6.3 mm +1.4 mm”; “-1.4 mm
+0.84 mm”; “-0.84 mm +0.60 mm”; “-0.60 mm +0.5 mm”; “-0.5 mm +0.3 mm”; “-0.3 mm +0.23 mm”; “-0.23 mm +0.15 mm”; “-0.15 mm +0.10 mm”; “-0.10 mm +0.07 mm”; “-0.07 mm + 0.05 mm”; “-0.05 mm + 0.03 mm”.
Each size fraction was split using a rifle splitter into a series of 32 samples and sent to the chemical laboratory. The variance of the sample series associated with each fragment size was calculated and plotted to produce a straight line
ln(s2
217
The granulometric factor g is re-placed here by g’, where g’ = g’(r) is read off the curve of granulometric factor
g’ vs ratio r = dMAX/dMIN, for closely screened materials.
The liberation factor is the
transi-tion between the liberated, calculable variance, to the non-liberated one given by Equation 8.
(8)
Equation 9 results from substi-tuting Equation 8 in Equation 7 and
taking the log on both sides. The linear regression built using the 14 resulting
points gives the sampling parameters K and alpha.
(9)
3. Results and discussion
EST IHL was calculated using Equation 4. Table 1 shows the results
of EST IHL for each fragment size (shown in cm). The granulometric
factor for calibrated material is 0.55 (Gy, 1998).
Table 1
EST IHL results for corresponding nominal size
Figure 1
Correlation between IHL and the fragment nominal size
Figure 1 shows the correlation between the nominal size and EST IHL. The equation of the power trendline
(y=c*x^b) built for the four fragment sizes gives the sampling parameters K (c of the trendline equation) and alpha
(b of the trendline equation).
According to Figure 1, the estimates for K and alpha are 0.0638 and 2.34 respectively. which can be used to calculate K, alpha
and liberation size, dl. Provided that the screen sizes are chosen such that the
ratio r = dMAX/dMIN is reasonably con-sistent, all points representing different
dMAX values on the calibration curve will
represent the formula for the relative variance given by Equation 7.
dN 3.32 2.09 1.05 0.5
EST IHL 0.823 0.337 0.149 0.008
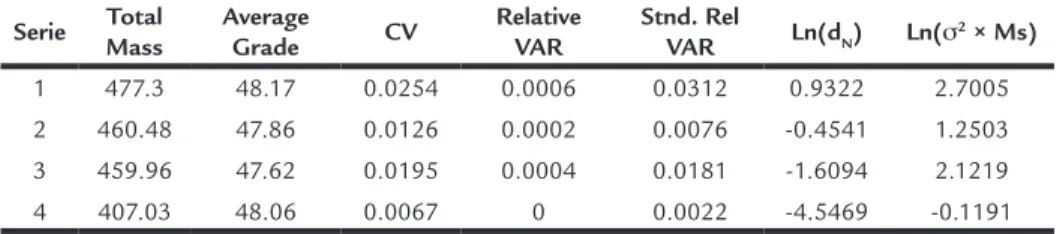
Sampling tree experiment (STE)
The alumina content and the sample masses were submitted to a
statistical treatment as described by Minnitt et al. (2007) and are presented
in Table 2.
Heterogeneity test (HT)
ln(S2
rel MS) = αln(dMAX)+ln(K)
Serie Total Mass
Average Grade CV
Relative VAR
Stnd. Rel
VAR Ln(dN) Ln(σ 2 × Ms)
1 477.3 48.17 0.0254 0.0006 0.0312 0.9322 2.7005
2 460.48 47.86 0.0126 0.0002 0.0076 -0.4541 1.2503 3 459.96 47.62 0.0195 0.0004 0.0181 -1.6094 2.1219
4 407.03 48.06 0.0067 0 0.0022 -4.5469 -0.1191 Table 2STE statistical results
(7)
Where relative variance is CV2
(coefficient of variation), standard
relative variance (σ2) is the product
between average grade and relative
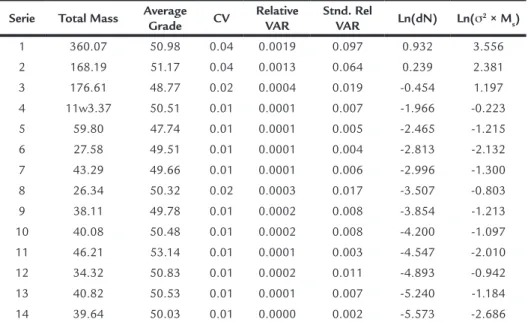
Table 3 SFA statistical results Figure 2
K and alpha calibration curve for a 47.8% Al2O3 ore.
The exponential function of the intercept on the y-axis provides an
estimate of K. According to the sam-pling tree experiment, the estimates
for K and alpha are 8.54 and 0.46 respectively.
Segregation free analysis (SFA)
The alumina content and the sample masses for the 14 size fractions were submitted to a statistical treatment as
described by Minnitt et al. (2011) and are presented in Table 3. The relative variance is CV2 (coeficient of variation), standard
relative variance (σ2) is the product
be-tween average grade and relative variance and Ms is the sample average mass.
The 14 fragment sizes were used to build the regression line on Figure 3, according Equation 9.
Serie Total Mass Average Grade CV
Relative VAR
Stnd. Rel
VAR Ln(dN) Ln(σ
2 × M s)
1 360.07 50.98 0.04 0.0019 0.097 0.932 3.556
2 168.19 51.17 0.04 0.0013 0.064 0.239 2.381
3 176.61 48.77 0.02 0.0004 0.019 -0.454 1.197
4 11w3.37 50.51 0.01 0.0001 0.007 -1.966 -0.223
5 59.80 47.74 0.01 0.0001 0.005 -2.465 -1.215 6 27.58 49.51 0.01 0.0001 0.004 -2.813 -2.132
7 43.29 49.66 0.01 0.0001 0.006 -2.996 -1.300 8 26.34 50.32 0.02 0.0003 0.017 -3.507 -0.803
9 38.11 49.78 0.01 0.0002 0.008 -3.854 -1.213 10 40.08 50.48 0.01 0.0002 0.008 -4.200 -1.097
11 46.21 53.14 0.01 0.0001 0.003 -4.547 -2.010 12 34.32 50.83 0.01 0.0002 0.011 -4.893 -0.942
13 40.82 50.53 0.01 0.0001 0.007 -5.240 -1.184
14 39.64 50.03 0.01 0.0000 0.002 -5.573 -2.686
Figure 3
K and alpha calibration curve for a 50.2% Al2O3 ore
the regression line (Figure 2) according to Equation 5.
According to SFA, the estimates for K and alpha are 5.49 and 0.76 respectively.
Comparison between sampling protocols using HT, STE and SFA
219
Table 5
Sampling protocol comparing the three heterogeneity experiments
4. Conclusions
Table 4
Factors used in Gy’s relative variance equation
Table 5 shows the sampling and sample preparation protocol for Juruti’s mine and the relative standard deviation
of the fundamental sampling error (last 4 columns, in %), sFSE, of each stage us-ing Gy’s factors (Gy,1998) as well as the
results of HT, STE, SFA.
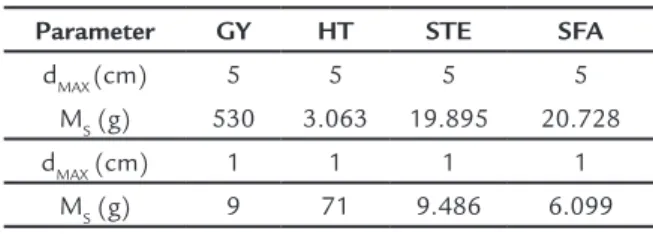
Considering Equation 2, a maxi-mum relative standard deviation of the fundamental error of 3% and a high value
for the initial mass ML, the minimum sample mass to represent the primary sample at the mine, where dMAX is 5 cm,
can be calculated. The last line of table 6 shows the same calculations for a dMAX of 1 cm.
Table 6
Minimum sample masses (Ms) for the primary sample at the mine
This paper presented a comparison of different methods to estimate the variance of the fundamental sampling error, minimum sample masses and the sampling parameters by different meth-ods. An appropriate sampling protocol for any type of ore requires experimen-tal test work in order to determine the deposit’s heterogeneity. The heterogene-ity test (HT) has been used for several decades and has proved to be an excel-lent method to calculate the minimum representative sample masses and to optimize sampling protocols during the beginning of mining projects and during operation as well. However, the new pro-posed tests show signiicant differences
which should be taken into account. The comparison between the results of STE and SFA shows the relationship between the fundamental sampling error and the grouping and segregation error. SFA was developed aiming to eliminate the re-sidual grouping and segregation variance which biases the calibration curve and should present smaller variances than STE. However, for higher diameters, SFA presents higher values of s2SFE, suggesting that the fundamental sam-pling error makes the most important role for coarser particles. Based on the results, the company decided to adopt the segregation free analysis for deining its sampling protocols due to two major
reasons: (1) the SFA proved to reduce the grouping and segregation error and (2) the SFA presented higher minimum sample masses than the heterogeneity test, making this method safer than the HT with respect to the representative-ness of samples. The results showed that optimizing sampling protocols is not a simple task and more than one experimental test should be performed to conirm what the minimum sample masses should be. This paper is a study for bauxite and may be not applicable to other types of ore. The authors highly recommend other companies to compare the different approaches and deine the most suitable for their operations.
Factor c f g di Al2O3 λM λG IHL
Values 3.6 0.5 0.25 0.00036 48.1% 3.98 2.65 0.0085 d2.5
Step ML (g) MS (g) dN (cm) sFSE GY sFSE HT sFSE STE sFSE SFA
Primary Samping 1.5E+10 15000 5 0.5628 1.3461 3.4618 3.5328
Crushing 15000 15000 2.54 0.0000 0.0000 0.0000 0.0000
Primary Quartering 15000 2500 2.54 0.5397 1.3632 6.6183 6.1023
Grinding 2500 2500 0.2 0.0000 0.0000 0.0000 0.0000
Secondary Quartery 2500 200 0.2 0.0836 0.2592 13.6578 8.6044
Pulverization 200 200 0.015 0 0 0 0
TOTAL 0.784 % 1.933 % 15.567 % 11.125 %
Parameter GY HT STE SFA
dMAX (cm) 5 5 5 5 MS (g) 530 3.063 19.895 20.728 dMAX (cm) 1 1 1 1
MS (g) 9 71 9.486 6.099
5. Acknowledgments
The authors acknowledge Alcoa World Alumina and University of São Paulo for their support in conducting the research and producing this paper.
6. References
GY, P.M. Sampling for analytical purposes. West Sussex, England: JohnWiley & Sons, 1998. (Translated by A.G. Royle).
PITARD, F.F. Pierre Gy´s sampling theory and sampling practice. (2. ed.). CRC Press, Boca Raton, 1993.
Received: 08 September 2013 - Accepted: 23 March 2013. p. 63-68, 2010.
MINNITT, R.C.A., RICE, P.M., SPANGENBERG C.. Part 2: Experimental calibra-tion of sampling parameters K and alpha for Gy´s formula by the sampling tree me-thod. The Journal of The Southern African Institute of Mining and Metallurgy, p. 513-518, 2007.
MINNITT, R.C.A., FRANÇOIS-BONGARÇON, D., PITARD, F.F. 2011. Segrega-tion Free Analysis for calibraSegrega-tiong the constants K and α for use in Gy´s formula. In: WORLD CONFERENCE ON SAMPLING AND BLENDING, 5. Gecamin, Santiago, p.133-150.
MINNITT, R.C.A. APUD FRANÇOIS-BONGARÇON, D. Gy´s Formula: Conclu-sions of a new phase of research. Proceedings Australian Association of Geoscien-tists. v.22, 1998.