www.biogeosciences.net/12/5583/2015/ doi:10.5194/bg-12-5583-2015
© Author(s) 2015. CC Attribution 3.0 License.
Identifying climatic drivers of tropical forest dynamics
M. Aubry-Kientz1, V. Rossi2,3,4, F. Wagner2,5, and B. Hérault2
1Université des Antilles et de la Guyane, UMR Ecologie des Forêts de Guyane, Campus agronomique
de Kourou, Kourou, France
2CIRAD, UMR Ecologie des Forêts de Guyane, Campus agronomique de Kourou, Kourou, France 3CIRAD, UPR Bsef, Montpellier, France
4Université de Yaoundé I, UMMISCO (UMI209), BP337, Yaoundé, Cameroon
5Remote sensing division, National Institute for Space Research-INPE, São José dos Campos, SP, Brazil
Correspondence to:B. Hérault ([email protected])
Received: 25 November 2014 – Published in Biogeosciences Discuss.: 11 February 2015 Revised: 18 May 2015 – Accepted: 9 September 2015 – Published: 1 October 2015
Abstract. In the context of climate change, identifying and then predicting the impacts of climatic drivers on tropical forest dynamics is becoming a matter of urgency. To look at these climate impacts, we used a coupled model of tropi-cal tree growth and mortality, tropi-calibrated with forest dynamic data from the 20-year study site of Paracou, French Guiana, in order to introduce and test a set of climatic variables. Three major climatic drivers were identified through the variable selection procedure: drought, water saturation and tempera-ture. Drought decreased annual growth and mortality rates, high precipitation increased mortality rates and high temper-ature decreased growth. Interactions between key functional traits, stature and climatic variables were investigated, show-ing best resistance to drought for trees with high wood den-sity and for trees with small current diameters. Our results highlighted strong long-term impacts of climate variables on tropical forest dynamics, suggesting potential deep impacts of climate changes during the next century.
1 Introduction
Tropical forests are characterized by high annual precipita-tion and high evapotranspiraprecipita-tion. Nevertheless, strong sea-sonal variations in rainfall inputs, partly driven by atmo-spheric movements related to the monsoon or latitudinal changes in the inter-tropical conversion zone, occur in most tropical regions around the world (Feng et al., 2013). Such seasonality implies various changes of the availability of re-sources, such as water and light, necessary to tree
devel-opment and to forest functioning. The seasonality of tree growth and tree mortality is increasingly studied in tropical forests, with some studies having succeeded in linking sea-sonal tree demography to climate seasea-sonality (Wagner et al., 2012; Grogan and Schulze, 2012; Brando et al., 2010). Tree growth is mainly related to water availability, resulting in growth during the wet months and static or even contracted states during the dry season months (Grogan and Schulze, 2012). The use of a convenient water availability proxy like the relative extractable water (REW; Wagner et al., 2011) shows that low levels of REW rather than lack of rainfall per se are the key drivers of the decrease in growth rate, or even of the stop, at a seasonal time step (Wagner et al., 2012).
At another timescale, long-term forest dynamic changes may also be related to exceptional climate events. Effects of unusual dry periods on tree growth and mortality may en-lighten us about the long-term processes linking water avail-ability and tree dynamics. After the intense 2005 drought in Amazonia, the forest suffered an additional mortality, lead-ing to a huge loss of alive tree biomass (Phillips et al., 2009). Similar major mortality events were observed in Panama (Condit, 1995), in Chinese rain forests (Tan et al., 2013) or in South-East Asia (Slik, 2004). Water exclusion experiments in Brazil provide results in line with a deep impact of drought on tree mortality (Nepstad et al., 2007; da Costa et al., 2010; Brando et al., 2008).
rates when compared to what is observed from a seasonal point of view or to some spectacular events. This gap is also due to the lack of sites in tropical forests where annual reg-ular inventories of tree growth and death are performed and where precise climatic data on the same timescale are avail-able. Moreover, the potential links between inter-annual cli-mate variations and tropical forest dynamics should be stud-ied from a multi-decadal long-term perspective in order to be representative of the climatic variability and of the variability of forest dynamic responses (Clark et al., 2010).
Some climatic variables (mainly water stress, water satu-ration and temperature) are expected to play a role in forest dynamics regarding the tree’s physiological processes. Wa-ter stress due to drought is well documented (Phillips et al., 2009; Allen et al., 2010). Water insufficiency leads gener-ally to higher mortality rates and lower growth (Choat et al., 2012). Water stress needs to be estimated, and diverse esti-mators may be found in the literature (Wagner et al., 2011; Toledo et al., 2011; Aragão et al., 2007; Malhi et al., 2009). The length of the dry season seems to be the simplest esti-mator. The relative extractable water (REW) described in the study of Wagner et al. (2011) estimates the quantity of water available for tree development and has been proved to have high performance in predicting intra-annual forest dynamics in Wagner et al. (2012). Although water availability is ex-pected to reduce growth and increase mortality, these impacts have to be investigated on an inter-annual timescale. Rain may also be responsible for water saturation, a phenomenon that is far less studied but that can have an effect on tree mor-tality or growth. For instance, Ferry et al. (2010) underlined a higher mortality rate in waterlogged areas. Inter-annual vari-ations of rain quantities can lead to more or less waterlogged soils, independent of their topographical location, implying instability that can cause cascading tree falls.
The effects of temperature are less consensual; some stud-ies suggested that tropical forests can be near a high temper-ature threshold and that these systems may be more vulnera-ble to climate change than previously believed (Clark et al., 2003). For instance, Clark et al. (2003) showed a negative correlation between 16-year diameter increments and annual means of daily minimal temperature in La Selva, Costa Rica, while Toledo et al. (2011) found a positive correlation be-tween annual diameter growth and temperature in Bolivia. An explanation for such apparently conflicting results was proposed by Dong et al. (2012): the effects of variability in solar radiation and daily minimum temperature on tree growth appear to be largely independent.
In this study, we use a modeling approach in order to mechanistically link climate conditions and functional plant traits to tree growth and survival (Zuidema et al., 2013). Functional traits have been recently used to include func-tional diversity in models of tree growth (Hérault et al., 2011; Rüger et al., 2012; Wagner et al., 2014) and tree mortality (Aubry-Kientz et al., 2013). We first question the potential relationships existing between climate variables computed
on a 2-year time step and forest dynamics. We identify inde-pendent variable responsible for the inter-annual variation of growth and mortality rates. These variables are then included in a coupled growth–mortality model to test their multivari-ate effects. Finally, we include in the model some interac-tions between functional traits (wood density and tree size) and climate predictors to test for a potential differentiated re-sponse depending on the individual functional identity. First, tree species having high wood density have been reported to better resist drought events as compared to lower density ones (Phillips et al., 2010). Part of these differences is re-lated to differences in hydraulic failure, as wood density is linked to xylem structure. Second, the current tree size also influences resistance to drought events or other climatic per-turbations (Nepstad et al., 2007; Condit et al., 2004). Two main hypotheses are debated. First, small, young trees that are not well established and that do not have deep roots may be more sensitive and may suffer under stressful water condi-tions. Second, large, older trees may feel water stress because they must maintain their photosynthesis activities and carry water from tree roots to a higher altitude in the forest canopy.
2 Materials and methods 2.1 Data collection
Three data sets were used in this study. The study site is located in Paracou, French Guiana (5◦18′N, 52◦55′W). The forest is typical of Guianan rain forests and the domi-nant tree families are Fabaceae, Chrysobalanaceae, Lecythi-daceae, and Sapotaceae. More than 700 species of trees ≥10 cm DBH (diameter at breast height) have been de-scribed at the site.
Mean annual precipitation averages 2980 mm (30-year pe-riod), and the site receives nearly two-thirds of its annual pre-cipitation during the long rainy season between mid-March and mid-June (Wagner et al., 2011), and less than 100 mm per month from August to November (Fig. 1).
2.1.1 Tree dynamic
Figure 1.Ombrothermic diagram of the Paracou forest, data from the 2001–2014 time period (precipitation in meters) on the left, tem-perature in◦C on the right.
2012, a large part of the trees that died during the study pe-riod (1991–2011) have only a vernacular name and no botan-ical determination. The method of Aubry-Kientz et al. (2013) is used to handle this uncertainty and to integrate the infor-mation on botanical determination contained in the vernacu-lar names of trees that were not identified.
2.1.2 Functional traits
The second data set was a collection of five functional traits of 335 Guianan tree species that occur at the Paracou site (Table 1). These 335 species represent 79 % of the total num-ber of individual trees included in this study. We used the procedure described in Aubry-Kientz et al. (2013) to assign functional trait values to trees for which (i) the species is known but trait values were not available, (ii) the species was not determined at the species level and (iii) the tree was dead before being identified. Traits are related to leaf eco-nomics, stem economics and life history and are extracted from a large database (Baraloto et al., 2010a, b). The leaf economics reflects a trade-off between investments in pro-ductive leaves with rapid turnover versus costly physical leaf structure with a longer payback. The stem economics defines a similar trade-off at the stem level: dense wood versus high wood water content and thick bark (Baraloto et al., 2010b). Life-history strategies describe how trees allocate resources to different organs and how these allocations translate into a species’ ability to compete for resources and finally to grow, survive, reproduce and disperse (Rüger et al., 2012). Some of these functional traits are accurate proxies of growth trajec-tories (Herault et al., 2010; Hérault et al., 2011) and mortality rates (Aubry-Kientz et al., 2013).
2.1.3 Climate
The third data set consists of climate data (Table 2). Six vari-ables were provided by the Climatic Research Unit (CRU) at the University of East Anglia (Mitchell and Jones, 2005), consisting in month-by-month variations in climate over the last century calculated on high-resolution grids (0.5×0.5◦; Mitchell and Jones, 2005). We used the aggregated variables (mean or sum, depending of the nature of the observed pro-cess) for 2 years, from July to July, to include the dry season (mid-August to mid-November). Selected variables that may have an impact on forest dynamics are the cloud cover (Cld), the potential evapotranspiration (Pet), the precipitation (Pre), the daily mean temperature (Tmp), the vapor pressure (Vap) and the wet day frequency (Wet).
Three other climate variables were computed using the rel-ative extractable water (REW) computed with a water bal-ance model developed by Wagner et al. (2011) calibrated at our study site and taking the daily precipitation from the CRU into account; this REW index takes values between 0 and 1 at our study site, corresponding to the available water for trees. This REW index is used to compute Nbunder, the
number of days under a REW threshold of 0.4, which is the threshold recommended in Wagner et al. (2011);Aunder, the
area over the REW curve and under the threshold of 0.4; and Aover, the area situated under the REW curve and over the
threshold of 0.95. NbunderandAunder are built to be
indica-tors of drought, whileAoveris related to soil water saturation.
All climate variables are centered to allow an easier interpre-tation of the results.
2.2 Model
The model used in this study consists of a model coupling growth and mortality processes at the whole community scale. The model is build taking advantage of two prelimi-nary studies where the growth (Hérault et al., 2011) and the mortality (Aubry-Kientz et al., 2013) sub-models were de-veloped. The likelihood is computed using the distribution probability of mortality (Eqs. 3 and 4) and the computed growth rate (Eqs. 5 and 6). A vigor index is added into the mortality process, taking the past growth of the two previ-ous years into account (Aubry-Kientz et al., 2015). We added the climate variables into the two processes to highlight the links between some climate drivers and one particular pro-cess. Because the final forest dynamic model was not lin-ear, we build a Markov chain Monte Carlo algorithm under a Bayesian framework to infer the parameter posterior distri-butions. Growth and mortality processes were linked through tree vigor and are parameterized simultaneously. If tree i stays alive, it grows at a growth rate AGRi,s,t, and its diame-ter DBHi,t−1becomes DBHi,t. The joint model likelihood is then
n
Y
t=1
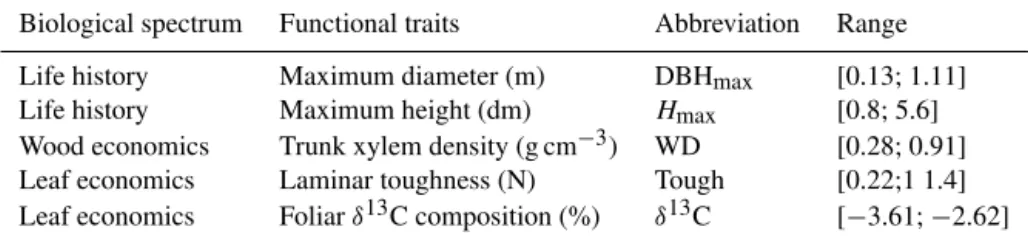
Table 1.The five functional traits used in the growth–mortality model. Descriptions of the traits, abbreviations used in this study and ranges observed in our data set.
Biological spectrum Functional traits Abbreviation Range
Life history Maximum diameter (m) DBHmax [0.13; 1.11] Life history Maximum height (dm) Hmax [0.8; 5.6] Wood economics Trunk xylem density (g cm−3) WD [0.28; 0.91] Leaf economics Laminar toughness (N) Tough [0.22;1 1.4] Leaf economics Foliarδ13C composition (%) δ13C [−3.61;−2.62]
Table 2. The climate variables included in the growth–mortality model. Descriptions of the climate variables, abbreviations used in this study, ranges observed over 2 years in our data set, and sources used to compute the variables: CRU means that the variable is provided by the Climate Research Unit (Mitchell and Jones, 2005), and REW means that the variable is computed from the water balance model of Wagner et al. (2011).
Variable Abbreviation Range over 2 years Source
Cloud cover (%) Cld [56.8 ; 60.7] CRU
Potential evapotranspiration (mm) Pet [80.4; 84.4] CRU
Precipitation (mm) Pre [5486.3; 6207.3] CRU
Daily mean temperature (◦C) Tmp [26.1; 26.9] CRU
Vapor pressure (HPA) Vap [705.7; 724.7] CRU
Wet day frequency (days) Wet [385.2; 432.1] CRU Number of days with REW<0.4 Nbunder [89; 170] REW Area over REW and<0.4 Aunder [9.1; 32.9] REW Area under REW and>0.95 Aover [8.3; 12.5] REW
if treeistays alive during the length of the studied period,
pi,s,k× k−1
Y
t=1
f (DBHi,t|DBHi,t−1)×(1−pi,s,t)
(2)
if treeidies between timek−1 and timek, where
– f (DBHi,t|DBHi,t−1)is the probability density for a tree
with diameter DBHi,t−1at timet−1 to have a diameter
DBHi,t at timet; this quantity is used to compute the vigor estimator.
– pi,s,tis the probability of dying between timet−1 and timet, which depends on the vigor estimator, added in the model by multiplying the vigor estimator byθ1.
The model computes a mortality probabilitypi,s,t and a pre-dicted growth rateAGR[i,s,t−1.
pi,s,t=logit−1 γ1×clim1+θ1×Vigori,s,t +θ2×
DBHi,s,t−1
DBHmaxs
+θ3×
DBHi,s,t−1
DBHmaxs
2
+θ4×Hmaxs+θ5×WDs+θ6×Toughs
(3) with
Vigori,s,t =log
AGRi,s,t−1+1
[
AGRi,s,t−1+1
!
, (4)
and
log(AGR[i,s,t−1+1)=(γ2×clim2+θ7×DBHmaxs +θ8×WDs+θ9×Hmaxs+θ10×δ13Cs)
×exp
−
1 2
log DBHi,t−2 θ11×DBHmaxs
θ12×WDs
2
, (5)
and
log(AGRi,s,t−1+1)=log(AGR[i,s,t−1+1)+εi, (6) with
εi ∼N(0, θ13), (7)
wherepi,s,t is the probability of dying of treeiof speciess between timet−1 andt;AGR[i,s,t−1is the predicted growth
between timet−2 and timet−1. AGRi,s,t−1is the observed
growth between timet−2 and timet−1; DBHmaxs,Hmaxs, WDs, Toughsandδ13Csare functional traits of speciessto
which treei belongs (Table 1);θ1, θ2,· · ·θ13are parameters
to be estimated, andεi is an individual error term following a normal distribution;γ1 andγ2 are the parameter vectors
linking the climate predictors with the processes of mortality and growth respectively; clim1and clim2are the vectors of
2.3 Variable selection
To identify the different axes of variation of our climate data set and avoid including collinear variables in the model, we realized a principal component analysis (PCA) on the climate variables.
We included all climate variables one by one in each pro-cess of the model and computed the partial likelihood for each sub-model of growth or mortality we obtained. This provides a first result about the importance of each climate variable. Depending on these results and on their degree of collinearity from the PCA, we selected some climate vari-ables and included them in the growth model and in the logit function of mortality.
2.4 Model inference
We implemented a Markov chain Monte Carlo algorithm to estimate the model parameters (Robert and Casella, 2004). A random walk was used as a proposal distribution to sam-ple new values of parameters that were or were not selected, using the ratio of Metropolis–Hasting. Only standard devia-tion was sampled in an inverse-gamma posterior distribudevia-tion with a Gibbs sampler. The functional traits used as demo-graphical predictors were uncertain because botanical deter-mination was incomplete for the older censuses, and not all values of functional traits were available for all species. We used the method developed in Aubry-Kientz et al. (2013) to handle these uncertainties. All the algorithms and statistical treatments were implemented with R software (Core Team, 2014).
2.5 Functional trait and forest dynamic responses Functional traits were introduced in the final model with an interaction term by multiplying a climatic variable with a functional trait. We did not test all possible interactions but, based on results from a literature survey, we investigated biologically meaningful interactions only (Table 3). We in-cluded in the model an interaction between wood density and the drought estimator Aunder, an interaction between DBH
andAunder, and an interaction between DBH and
precipita-tion Pre.
Species vary over 1 order of magnitude in their wood density (WD), ranging from 0.08 to 1.39 g cm3(Iida et al., 2012), and the encountered range of wood density is partic-ularly large in species-rich tropical rain forests (Chave et al., 2006, 2009). Wood density is a key functional trait because of its importance for mechanical stability, defense against her-bivores, hydraulic conductivity, photosynthetic carbon gain and diameter growth rates of plants (Poorter et al., 2008). High wood density implies thin and short xylem vessels with small pit pores, which decrease the risk of embolism and cavitation. Trees with high wood density are then expected to be less sensitive to drought. The termAundermultiplied by
(WDmax-WD) accounts for the effect of drought on trees with
low wood density. This term is added in growth and mortality to test this effect (Table 3).
3 Results
3.1 Variable selection
The variable selection was realized using the literature, the PCA results, and the results of the univariate analysis. 3.1.1 PCA
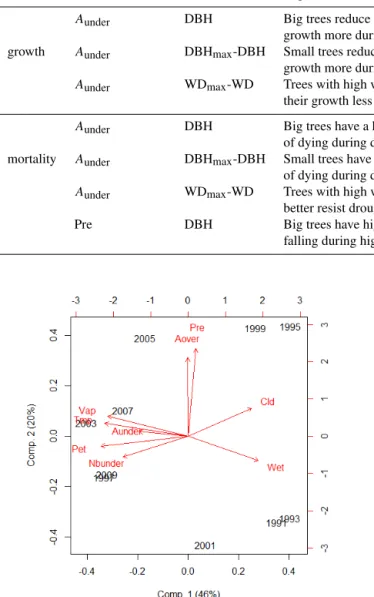
The PCA underlines one principal axis, explaining 46 % of the inertia and strongly negatively correlating with variables Tmp and Pet. The variables Wet and Cld are positively cor-related with this axis, while Vap, Aunder and Nbunder are
negatively correlated with this axis (Fig. 2). The second axis (20 %) is strongly negatively correlated with Pre and Areaover. The third axis (12 %) is essentially negatively
cor-related withAunder.
3.1.2 Univariate analyses
When the climate variables are included one by one in each model, all climate variables but precipitation (Pre) had an ef-fect in the growth process, while only few had an efef-fect in the mortality process (Table 4). The climates variables asso-ciated with the mortality process are Pre, NbunderandAunder.
In the growth model,Aunder is the best predictor according
to the likelihood. In the mortality process, the best value of likelihood is obtained when Nbunderis included.
3.1.3 Variable selection
The Pet and temperature are indicators of the energy that the system receives and are expected to play a role in tree growth (Clark et al., 2003; Dong et al., 2012). These vari-ables are strongly correlated (r=0.8) and negatively corre-lated with the first axis of the PCA (Pet, C= −0.45 and Tmp, C= −0.44). This is not surprising, as Pet is computed using the temperature (Allen et al., 1998). As these two variables are strongly correlated, we finally included only temperature, which had a better likelihood score than Pet when it is in-cluded in the growth model. Neither Pet nor the temperature had an effect if included in the mortality process.
The second axis of the PCA is related to water satura-tion and is correlated with Pre (C= −0.68) andAover(C= −0.61).Aoveronly had an effect when included in the growth
Table 3.Functional variability of expected responses to climate variables based on the literature. The functional variability is included in the model with an interaction term, i.e., multiplying a climatic variable with a given tree feature. Most hypotheses were not verified, but two significant effects are highlighted: large trees reduce their growth more during dry years, and trees with high wood density reduce their growth less during dry years.
Process Climatic variable Tree feature Expected effect based on literature Reference Result from this study
Aunder DBH Big trees reduce their Condit et al. (2004) as expected
growth more during drought
growth Aunder DBHmax-DBH Small trees reduce their Hanson et al. (2001) no result growth more during drought
Aunder WDmax-WD Trees with high wood density reduce Markesteijn (2010) as expected their growth less during drought
Aunder DBH Big trees have a higher probability Nepstad et al. (2007) no result of dying during drought
mortality Aunder DBHmax-DBH Small trees have a higher probability Hanson et al. (2001) no result of dying during drought
Aunder WDmax-WD Trees with high wood density Phillips et al. (2009) no result better resist drought
Pre DBH Big trees have higher probability of Ferry et al. (2010) no result falling during high precipitation
Figure 2.Results of the principal component analysis performed on climatic variables (red arrows) where census years are plotted to see the interannual climate variability in the Paracou data set. The first axis (46 % of variance) is mainly driven by the variables Pet (po-tential evapotranspiration) and tmp (temperature). The second axis (20 % of variance) is mainly driven byAover(area over REW and
<0.4) and Pre (precipitation) and may be interpreted as an axis rep-resenting soil water saturation. The third axis (not represented here, 13 % of variance), is mainly driven byAunder(area under REW and
>0.95), which is an indicator of water stress.
The third axis of the PCA is strongly correlated with the drought estimatorAunder, which is the best climate driver of
growth regarding the likelihood and the effect size. Aunder
also had an effect on the mortality process and is finally in-cluded in the two processes in the final model.
Figure 3.Climatic drivers of tree dynamics. Observed mean growth (mm per 2 years) is plotted against temperature(a)and against the water stress(b). Observed mortality rate (proportion per 2 years) is plotted in abscissa against precipitation(c)and against the water stress(d).
3.2 Full model inference
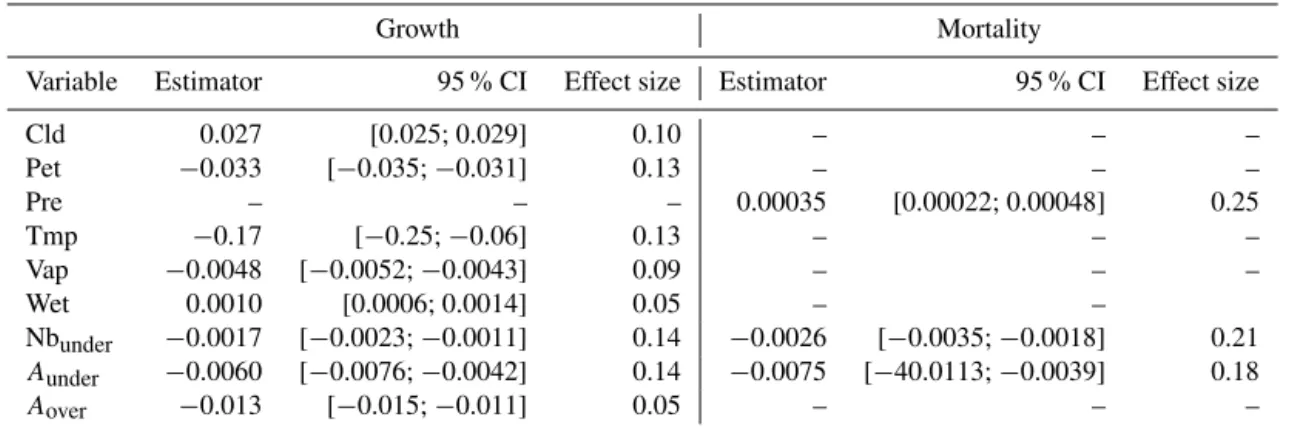
Table 4.Results of the estimation process for each demographic parameter associated with the climate variables. The variables were added in the growth process or in the mortality process in a univariate way, i.e., one by one, and all parameters were estimated using a Metropolis– Hastings algorithm. Effect sizes were estimated by multiplying the amplitude of the observed variable to the absolute value of the estimator. Only significant results are represented.
Growth Mortality
Variable Estimator 95 % CI Effect size Estimator 95 % CI Effect size
Cld 0.027 [0.025; 0.029] 0.10 – – –
Pet −0.033 [−0.035;−0.031] 0.13 – – –
Pre – – – 0.00035 [0.00022; 0.00048] 0.25
Tmp −0.17 [−0.25;−0.06] 0.13 – – –
Vap −0.0048 [−0.0052;−0.0043] 0.09 – – –
Wet 0.0010 [0.0006; 0.0014] 0.05 – –
Nbunder −0.0017 [−0.0023;−0.0011] 0.14 −0.0026 [−0.0035;−0.0018] 0.21
Aunder −0.0060 [−0.0076;−0.0042] 0.14 −0.0075 [−40.0113;−0.0039] 0.18
Aover −0.013 [−0.015;−0.011] 0.05 – – –
(2011); that is, maximum growth rates increase with increas-ing DBHmax, and decreasing WD,Hmaxandδ13C (Table 5).
Maximum growth rate is attained for a tree diameter equal to 0.794×DBHmax. The parameters linking the probability
of mortality toHmax, WD and Tough converged around
neg-ative values, meaning that the probability of dying is lower when the tree is high, has a high wood density and/or high laminar toughness. The drought estimator (Aunder) converged
to negative values in the growth and mortality processes; thus growth and mortality computed at our biannual timescale are lower when the drought estimatorAunder is higher. The
parameter linking mortality with precipitation (Pre) is pos-itive. This finding implies that mortality rate is higher dur-ing 2-year timescale with high precipitation. In our data set, the highest total precipitation was, albeit non-significantly, rather related to the highest proportion of tree-fall deaths (Fig. 5). The parameter linking temperature (tmp) and growth takes negative values; thus growth values are lower during the warmest periods.
3.3 Functional variability of responses
In the growth process, interaction between (WDmax-WD) and
drought is negative (Table 3), implying that trees with lower WD are more sensitive to drought and reduce their growth more. Moreover, interactions linking the current diameter and drought are also negative; thus larger trees are more sen-sitive to drought and reduce their growth more compared to smaller trees. None of the interaction terms included in the mortality process had an effect (Table 3).
4 Discussion
In this study, we questioned the importance of the climate drivers of tropical forest dynamics by using a community growth–mortality modeling framework. First, one can note
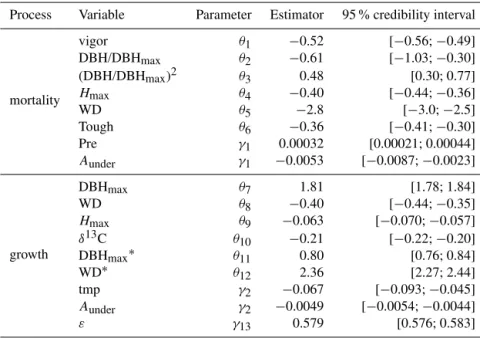
Table 5.Result of the estimation process for the final model. The Metropolis–Hastings algorithm was run with 2000 iterations, burning of 1000 iterations, thinning of 10 iterations. In the growth process, variables with∗are included in the exponential kernel.
Process Variable Parameter Estimator 95 % credibility interval
mortality
vigor θ1 −0.52 [−0.56;−0.49]
DBH/DBHmax θ2 −0.61 [−1.03;−0.30]
(DBH/DBHmax)2 θ3 0.48 [0.30; 0.77]
Hmax θ4 −0.40 [−0.44;−0.36]
WD θ5 −2.8 [−3.0;−2.5]
Tough θ6 −0.36 [−0.41;−0.30]
Pre γ1 0.00032 [0.00021; 0.00044]
Aunder γ1 −0.0053 [−0.0087;−0.0023]
growth
DBHmax θ7 1.81 [1.78; 1.84]
WD θ8 −0.40 [−0.44;−0.35]
Hmax θ9 −0.063 [−0.070;−0.057]
δ13C θ10 −0.21 [−0.22;−0.20]
DBHmax∗ θ11 0.80 [0.76; 0.84]
WD∗ θ12 2.36 [2.27; 2.44]
tmp γ2 −0.067 [−0.093;−0.045]
Aunder γ2 −0.0049 [−0.0054;−0.0044]
ε γ13 0.579 [0.576; 0.583]
4.1 Water stress
The water stress during the dry season, estimated withAunder,
negatively impacts the growth and mortality processes. Trees will thus grow less quickly and have a lower probability of dying during 2-year periods with the most intense dry sea-sons. The reduction of growth is expected, and has many eco-physiological causes. Indeed, water is essential for sap fluxes and for photosynthesis efficiency. The reduction of growth is furthermore linked with the current DBH and the species’ wood density (Table 3). Big trees are more sensitive to water stress than small trees. This was expected in light of the re-sults obtained after rainfall exclusion (da Costa et al., 2010). Indeed, maintenance costs are higher for big trees, making these trees more vulnerable to the driest periods. Regarding the wood density, species with high values are more resis-tant to drought. This is consistent with our hypothesis that high wood density implies thin and short xylem vessels and thus decreases the risk of embolism and cavitation. As the ability of trees to recover from periods of sustained drought is strongly related to their embolism resistance (Choat et al., 2012), a tree with high wood density will be more able to maintain growth during dry years. For similar reasons, we expected a positive impact ofAunderon mortality rates.
Ex-perimental trough-fall exclusions conducted in Tapajós and Caxiuanã indeed demonstrated that 50 % rainfall exclusion led to very high mortality rates (Nepstad, 2002). Our re-sults show no positive effect of drought intensity on mortal-ity rates (Table 4) and look contradictory to Nepstad (2002). However, the natural variability of the drought intensity (to-tal rainfall from 5486 to 6207 mm) in our data set is hardly comparable to the experimental 50 % reduction in total
rain-fall. Moreover, our modeling framework prevented us from seeing long-term effects induced by repeated drought events because the drought variable values depend only on the last 2-year climate. One may also expect that standing death is more frequent during the driest periods but, when plotting tree mode of death against drought estimator (Aunder), no
ev-idence was observed for a potential trend (Fig. 5). To con-clude, our results confirmed that the relationship between drought and mortality may be challenging to estimate and to link with their underlying causes at an inter-annual timescale. 4.2 Water saturation
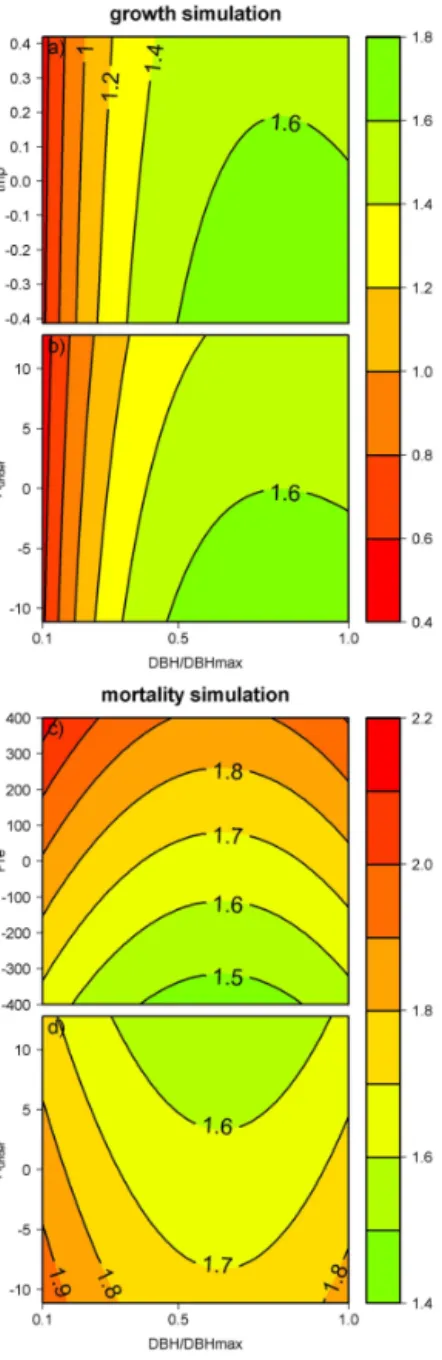
Figure 4. Climatic drivers of tree dynamics. Simulations are made using median values for tree functional traits. Growth (in mm per 2 years) is computed with varying temperature (a)and with varying water stress (b) and is plotted against the on-togeny (DBH/DBHmax). Growth rises with reduced temperature and reduced water stress. This is more noticeable for large val-ues of DBH/DBHmax, which means for large, old trees. Mortal-ity (% per 2 years) is computed with varying precipitation(c)and with varying water stress (d) and is plotted against the ontogeny (DBH/DBHmax). Mortality rate rises with rising precipitation and reduced water stress. This illustration clearly shows the effects of climate variables and ontogeny on tree growth and mortality, but the median functional traits used do not represent a real “mean” tree. To evaluate more precisely the dynamics for two different species, we plotted the same curves forOxandra AsbeckiiandHevea guianensis
in Appendix A.
Figure 5.Proportion of dead trees caused by tree fall plotted against the climate variable Pre(a)and proportion of dead trees caused by standing death plotted against the climate variableAunder(b). About 50 % of tree deaths are tree fall; this proportion is quite higher but not significant (Fstatistic test,P =0.079) during 2-year periods with high precipitation. No significant correlation (F statis-tic test,P =0.814) between the mode of death and the drought in-tensityAunderwas noted.
depth are generally low in sandy soils and soils with high moisture content. Our results highlight that the time varia-tion in soil water saturavaria-tion is also very important and should be reassessed.
4.3 Temperature
Temperature is identified as predictor of trees’ decreasing growth. As the temperature rises, the velocity of reacting molecules increases, leading to more rapid reaction rates but also to damage of the tertiary structures of the enzymes and reduced enzyme activity and reaction rates (Fitter and Hay, 2001; Lloyd and Farquhar, 2008). These two processes are responsible for a bell-shaped curve of growth response to temperature (Fitter and Hay, 2001). Temperature can affect photosynthesis through modulation of the rates of activity of photosynthetic enzymes and the electron transport chain, and in a more indirect manner, through leaf temperatures defining the magnitude of the leaf-to-air vapor pressure difference, a key factor influencing stomatal conductances (Lloyd and Far-quhar, 2008). In tropical forests, as temperatures are already high, rising temperatures may imply lower growth, consistent with results from Clark et al. (2003).
Figure 6.Predictions of growth and mortality depending of climatic drivers for Oxandra asbeckii and Hevea guianensis. Simulations are made using the functional traits values of the species Oxan-dra asbeckii (left) andHevea guianensis(right). Growth (in mm per 2 years) is computed with varying temperature (first line) and with varying water stress (second line) and is plotted against the ontogeny (DBH/DBHmax). Growth rises with reduced temperature and reduced water stress. This is more noticeable for large values of DBH/DBHmax, which means large, old trees. Mortality (% per 2 years) is computed with varying precipitation (third line) and with varying water stress (fourth line) and is plotted against the ontogeny (DBH/DBHmax). Mortality rate rises with rising precipitation and reduced water stress.
temperature effect found in the extant literature (Dong et al., 2012). Finally, we need to acknowledge that we do not know much about how forest dynamics will behave in the next cen-tury under temperature conditions that will be so different from what is actually observed. In this context, manipulative warming experiments are increasingly vital to better predict the future of tropical forest dynamics (Cavaleri et al., 2015).
5 Conclusions
Appendix A: Growth and mortality simulations for OxandraandHevea
Simulations presented in Fig. 4 are realized using median values for tree functional traits. These median values do not have any ecological meaning, and the figure was realized only to show how climatic drivers impact the tree growth and mortality in reality (Fig. 3) and in our model (Fig. 4). To show more realistic simulations, the same patterns are plot-ted for two species that differ in their ecological strategies in Fig. 6. The first column shows the simulated dynamics of
Oxandra asbeckii, a relatively small tree. The second column
Acknowledgements. Funding came from the Climfor Project (Fon-dation pour la Recherche sur la Biodiversité) and from the Guyasim Project (European structural funding, PO-feder). The funders had no role in study design, data collection and analysis, decision to publish or preparation of the manuscript. This work also benefited from an “Investissement d’Avenir” grant managed by the Agence Nationale de la Recherche (CEBA, ref ANR-10-LABX-0025) and from a grant from the Centre de Coopération Internationale en Recherche Agronomique pour le Développement.
Edited by: K. Thonicke
References
Allen, C. D., Macalady, A. K., Chenchouni, H., Bachelet, D., Mc-Dowell, N., Vennetier, M., Kitzberger, T., Rigling, A., Bres-hears, D. D., Hogg, E. T. H., Gonzalez, P., Fensham, R., Zhang, Z., Castro, J., Demidova, N., Lim, J.-H. H., Allard, G., Run-ning, S. W., Semerci, A., and Cobb, N.: A global overview of drought and heat-induced tree mortality reveals emerging cli-mate change risks for forests, Forest Ecol. Manag., 259, 660– 684, doi:10.1016/j.foreco.2009.09.001, 2010.
Allen, R. G., Pereira, L. S., Raes, D., and Smith, M.: Crop evap-otranspiration – Guidelines for computing crop water require-ments – FAO Irrigation and drainage paper 56, 1–15, 1998. Aragão, L. E. O. C., Malhi, Y., Roman-Cuesta, R. M., Saatchi, S.,
Anderson, L. O., and Shimabukuro, Y. E.: Spatial patterns and fire response of recent Amazonian droughts, Geophys. Res. Lett., 34, L07701, doi:10.1029/2006GL028946, 2007.
Aubry-Kientz, M., Hérault, B., Ayotte-Trépanier, C., Bar-aloto, C., and Rossi, V.: Toward trait-based mortal-ity models for tropical forests., PloS One, 8, e63678, doi:10.1371/journal.pone.0063678, 2013.
Aubry-Kientz, M., Rossi, V., Boreux, J.-J., and Hérault, B.: A joint individual-based model coupling growth and mortality reveals that tree vigor is a key component of tropical forest dynamics, Ecol. Evolut., 5, 2457–2465, doi:10.1002/ece3.1532, 2015. Baraloto, C., Paine, C. E. T., Patiño, S., Bonal, D., Hérault, B.,
and Chave, J.: Functional trait variation and sampling strategies in species-rich plant communities, Funct. Ecol., 24, 208–216, doi:10.1111/j.1365-2435.2009.01600.x, 2010a.
Baraloto, C., Paine, C. E. T., Poorter, L., Beauchene, J., Bonal, D., Domenach, A. M., Hérault, B., Patino, S., Roggy, J. C., and Chave, J.: Decoupled leaf and stem economics in rain forest trees, Ecol. Lett., 13, 1338–1347, 2010b.
Brando, P. M., Nepstad, D. C., Davidson, E. A., Trumbore, S. E., Ray, D., and Camargo, P.: Drought effects on littefall, wood pro-duction and belowground carbon cycling in an Amazon Forest: result of a throughfall reduction experiment, Philos. T. R. Soc. A, 363, 1839–1848, doi:10.1098/rstb.2007.0031, 2008.
Brando, P. M., Goetz, S. J., Baccini, A., Nepstad, D. C., Beck, P. S. A., and Christman, M. C.: Seasonal and inter-annual variability of climate and vegetation indices across the Amazon., P. Natl. Acad. Sci. USA, 107, 14685–14690, doi:10.1073/pnas.0908741107, 2010.
Brienen, R. J. W., Phillips, O. L., Feldpausch, T. R., et al.: Long-term decline of the Amazon carbon sink, Nature, 519, 344–348, doi:10.1038/nature14283, 2015.
Cavaleri, M., Reed, S., Smith, W., and Wood, T.: Urgent need for warming experiments in tropical forests, Glob. Change Biol., 1– 11, doi:10.1111/gcb.12860, 21, 2111–2121, 2015.
Chave, J., Muller-Landau, H. C., Baker, T. R., Easdale, T. a., ter Steege, H., and Webb, C. O.: Regional and phylogenetic variation of wood density across 2456 Neotropical tree species, Ecological applications: a publication of the Ecological Society of America, 16, 2356–67, 2006.
Chave, J. J., Coomes, D., Jansen, S., Lewis, S. L., Swenson, N. G., and Zanne, A. E.: Towards a worldwide wood eco-nomics spectrum., Ecol. Lett., 12, 351–66, doi:10.1111/j.1461-0248.2009.01285.x, 2009.
Choat, B., Jansen, S., Brodribb, T. J., Cochard, H., Delzon, S., Bhaskar, R., Bucci, S. J., Feild, T. S., Gleason, S. M., Hacke, U. G., Jacobsen, A. L., Lens, F., Maherali, H., Martínez-Vilalta, J., Mayr, S., Mencuccini, M., Mitchell, P. J., Nardini, A., Pitter-mann, J., Pratt, R. B., Sperry, J. S., Westoby, M., Wright, I. J., and Zanne, A. E.: Global convergence in the vulnerability of forests to drought, Nature, 491, 752–5, doi:10.1038/nature11688, 2012. Clark, D. A., Piper, S. C., Keeling, C. D., and Clark, D. B.: Tropical rain forest tree growth and atmospheric carbon dynamics linked to interannual temperature variation dur-ing 1984-2000., P. Natl. Acad. Sci. USA, 100, 5852–5857, doi:10.1073/pnas.0935903100, 2003.
Clark, D. B., Clark, D. A., and Oberbauer, S. F.: Annual wood pro-duction in a tropical rain forest in NE Costa Rica linked to cli-matic variation but not to increasing CO2, Glob. Change Biol., 16, 747–759, doi:10.1111/j.1365-2486.2009.02004.x, 2010. Condit, R.: Research in large, long-term tropical forest plots, Trends
in Ecol. Evolut., 10, 18–22, doi:10.1016/S0169-5347(00)88955-7, 1995.
Condit, R., Aguilar, S., Hernandez, A., Perez, R., Lao, S., Angehr, G., Hubbell, S. P., and Foster, R. B.: Tropical forest dynamics across a rainfall gradient and the impact of an El Nino dry season, J. Trop. Ecol., 20, 51–72, 2004.
Core Team, R.: R: A Language and Environment for Statistical Computing, http://www.r-project.org/ (last access: 29 September 2015), 2014.
Corlett, R. T.: Impacts of warming on tropical low-land rainforests, Trends in Ecol. Evolut., 26, 606–613, doi:10.1016/j.tree.2011.06.015, 2011.
da Costa, A. C. L., Galbraith, D., Almeida, S., Portela, B. T. T., da Costa, M., Silva Junior, J. a. D. A., Braga, A. P., de Gonçalves, P. H. L., de Oliveira, A. a. R., Fisher, R., Phillips, O. L., Met-calfe, D. B., Levy, P., and Meir, P.: Effect of 7 yr of experi-mental drought on vegetation dynamics and biomass storage of an eastern Amazonian rainforest., New Phytol., 187, 579–91, doi:10.1111/j.1469-8137.2010.03309.x, 2010.
de Toledo, J. J., Magnusson, W. E., Castilho, C. V., and Nasci-mento, H. E. M.: Tree mode of death in Central Amazonia: Effects of soil and topography on tree mortality associated with storm disturbances, Forest Ecol. Manag., 263, 253–261, doi:10.1016/j.foreco.2011.09.017„ 2012.
Feng, X., Porporato, A., and Rodriguez-Iturbe, I.: Changes in rain-fall seasonality in the tropics, Nature Climate Change, 3, 811– 815, doi:10.1038/nclimate1907,2013.
Ferry, B., Morneau, F., Bontemps, J. D., Blanc, L., and Freycon, V.: Higher treefall rates on slopes and waterlogged soils result in lower stand biomass and productivity in a tropical rain forest, J. Ecol., 98, 106–116, 2010.
Fitter, A. H. and Hay, R. K.: Environmental physiology of plants, Academic P edn., 367 pp., London, 2001.
Grogan, J. and Schulze, M.: The Impact of Annual and Seasonal Rainfall Patterns on Growth and Phenology of Emergent Tree Species in Southeastern Amazonia, Brazil, Biotropica, 44, 331– 340, 2012.
Hanson, P. J., Todd, D. E., and Amthor, J. S.: A six-year study of sapling and large-tree growth and mortality responses to natu-ral and induced variability in precipitation and throughfall, Tree Physiol., 21, 345–58, 2001.
Herault, B., Ouallet, J., Blanc, L., Wagner, F., and Baraloto, C.: Growth responses of neotropical trees to logging gaps, J. Appl. Ecol., 47, 821–831, doi:10.1111/j.1365-2664.2010.01826.x, 2010.
Hérault, B., Bachelot, B., Poorter, L., Rossi, V., Bongers, F., Chave, J., Paine, C. E. T., Wagner, F., and Baraloto, C.: Functional traits shape ontogenetic growth trajectories of rain forest tree species, J. Ecol., 99, 1431–1440, doi:10.1111/j.1365-2745.2011.01883.x, 2011.
Iida, Y., Poorter, L., Sterck, F. J., Kassim, A. R., Kubo, T., Potts, M. D., and Kohyama, T. S.: Wood density explains architec-tural differentiation across 145 co-occurring tropical tree species, Funct. Ecol., 26, 274–282, 2012.
Joetzjer, E., Douville, H., Delire, C., and Ciais, P.: Present-day and future Amazonian precipitation in global climate mod-els: CMIP5 versus CMIP3, Climate Dynamics, 41, 2921–2936, doi:10.1007/s00382-012-1644-1, 2013.
Lloyd, J. and Farquhar, G. D.: Effects of rising temperatures and [CO2] on the physiology of tropical forest trees., Philos. T. R. Soc. B, 363, 1811–7, doi:10.1098/rstb.2007.0032, 2008. Malhi, Y., Aragão, L. E. O. C., Galbraith, D., Huntingford, C.,
Fisher, R., Zelazowski, P., Sitch, S., Mcsweeney, C., and Meir, P.: Exploring the likelihood and mechanism of a climate-change-induced dieback of the Amazon rainforest, P. Natl. Acad. Sci. USA, 106, 20610–20615, 2009.
Markesteijn, L.: Drought tolerance of tropical tree species; Func-tional Traits, Trade-offs and Species Distribution, Ph.D. thesis, Wageningen University, 204 pp., 2010.
Mitchell, T. D. and Jones, P. D.: An improved method of con-structing a database of monthly climate observations and as-sociated high-resolution grids, Int. J. Climatol., 25, 693–712, doi:10.1002/joc.1181, 2005.
Nepstad, D. C.: The effects of partial throughfall exclusion on canopy processes, aboveground production, and biogeochem-istry of an Amazon forest, J. Geophys. Res., 107, 8085, doi:10.1029/2001JD000360, 2002.
Nepstad, D. C., Tohver, I. M., Ray, D., Moutinho, P., and Cardinot, G.: Mortality of large trees and lianas following experimental drought in an Amazon forest, Ecology, 88, 2259–69, 2007. Phillips, O. L., Aragao, L., Lewis, S. L., Fisher, J. B., Lloyd, J.,
Lopez-Gonzalez, G., Malhi, Y., Monteagudo, A., Peacock, J., Quesada, C. A., van der Heijden, G., Almeida, S., Amaral, I.,
Arroyo, L., Aymard, G., Baker, T. R., Banki, O., Blanc, L., Bonal, D., Brando, P., Chave, J., de Oliveira, A. C. A., Cardozo, N. D., Czimczik, C. I., Feldpausch, T. R., Freitas, M. A., Gloor, E., Higuchi, N., Jimenez, E., Lloyd, G., Meir, P., Mendoza, C., Morel, A., Neill, D. A., Nepstad, D., Patino, S., Penuela, M. C., Prieto, A., Ramirez, F., Schwarz, M., Silva, J., Silveira, M., Thomas, A. S., ter Steege, H., Stropp, J., Vasquez, R., Zela-zowski, P., Davila, E. A., Andelman, S., Andrade, A., Chao, K.-j. J., Erwin, T., Di Fiore, A., Honorio, E., Keeling, H., Killeen, T. J., Laurance, W. F., Cruz, A. P. n., Pitman, N. C. A., Vargas, P. N. n., Ramirez-Angulo, H., Rudas, A., Salamao, R., Silva, N., Terborgh, J., Torres-Lezama, A., Aragão, L. E. O. C., López-gonzález, G., Heijden, G. V. D., Bánki, O., Cristina, A., Oliveira, A. D., Jiménez, E., Patiño, S., Peñuela, M. C., Ramírez, F., Steege, H., Vásquez, R., Dávila, E. A., Fiore, A. D., C, E. H., Ramírez-angulo, H., and Salamão, R.: Drought sensitivity of the Amazon Rainforest, Science, 323, 1344–1347, 2009.
Phillips, O. L., van der Heijden, G., Lewis, S. L., López-González, G., Aragão, L. E. O. C., Lloyd, J., Malhi, Y., Monteagudo, A., Almeida, S., Dávila, E. A., Amaral, I., Andelman, S., Andrade, A., Arroyo, L., Aymard, G., Baker, T. R., Blanc, L., Bonal, D., de Oliveira, A. C. A., Chao, K. J., Cardozo, N. D., da Costa, L., Feldpausch, T. R., Fisher, J. B., Fyllas, N. M., Freitas, M. A., Galbraith, D., Gloor, E., Higuchi, N., Honorio, E., Jiménez, E., Keeling, H., Killeen, T. J., Lovett, J. C., Meir, P., Mendoza, C., Morel, A., Vargas, P. N. n., Patiño, S., Peh, K. S. H., Cruz, A. P. n., Prieto, A., Quesada, C. a., Ramírez, F., Ramírez, H., Rudas, A., Salamão, R., Schwarz, M., Silva, J., Silveira, M., Ferry Slik, J. W., Sonké, B., Thomas, A. S., Stropp, J., Ta-plin, J. R. D., Vásquez, R., and Vilanova, E.: Drought-mortality relationships for tropical forests, New Phytol., 187, 631–646, doi:10.1111/j.1469-8137.2010.03359.x, 2010.
Poorter, L., Wright, S. J., Paz, H., Ackerly, D. D., Condit, R., Ibarra-Manríquez, G., Harms, K. E., Licona, J.-C., Martínez-Ramos, M., Mazer, S. J., Muller-Landau, H. C., Peña Claros, M., Webb, C. O., and Wright, I. J.: Are functional traits good predictors of demographic rates? Evidence from five Neotropical forests, Ecology, 89, 1908–1920, 2008.
Reed, S. C., Wood, T. E., and Cavaleri, M. A.: Tropical forests in a warming world, New Phytol., 193, 27–29, 2012.
Robert, C. P. and Casella, G.: Monte Carlo statistical methods, Springer, 2 edn., 649 pp., 2004.
Rüger, N., Wirth, C., Wright, S. J., and Condit, R.: Functional traits explain light and size response of growth rates in tropical tree species, Ecology, 93, 2626–2636, 2012.
Slik, J. W. F.: El Niño droughts and their effects on tree species com-position and diversity in tropical rain forests, Oecologia, 141, 114–120, doi:10.1007/s00442-004-1635-y, 2004.
Stocker, T., Qin, D., Plattner, G., Tignor, M., Allen, S., Boschung, J., Nauels, A., Xia, Y., Bex, B., and Midgley, B.: IPCC, 2013: climate change 2013: the physical science basis. Contribution of working group I to the fifth assessment report of the intergov-ernmental panel on climate change, Cambridge University Press, 1535 pp., 2013.
of inventory and eddy flux data, J. Geophys. Res.-Atmos., 118, 9393–9400, doi:10.1002/jgrd.50675, 2013.
Toledo, M., Poorter, L., Peña Claros, M., Alarcón, A., Balcázar, J., Leaño, C., Licona, J. C., Llanque, O., Vroomans, V., Zuidema, P. A., and Bongers, F.: Climate is a stronger driver of tree and forest growth rates than soil and disturbance, J. Ecol., 99, 254– 264, doi:10.1111/j.1365-2745.2010.01741.x, 2011.
Wagner, F., Hérault, B., Stahl, C., Bonal, D., and Rossi, V.: Model-ing water availability for trees in tropical forests, Agr. Forest Me-teorol., 151, 1202–1213, doi:10.1016/j.agrformet.2011.04.012, 2011.
Wagner, F., Rossi, V., Stahl, C., Bonal, D., and Hérault, B.: Water Availability Is the Main Climate Driver of Neotropical Tree Growth, Plos One, 7, e34074, doi:10.1371/journal.pone.0034074, 2012.
Wagner, F., Rossi, V., Baraloto, C., Bonal, D., Stahl, C., and Hérault, B.: Are Commonly Measured Functional Traits Involved in Trop-ical Tree Responses to Climate?, International J. Ecol., 2014, 1– 10, doi:10.1155/2014/389409, 2014.