BGD
12, 4627–4654, 2015Resilience to temperature and pH
changes in a future climate change
scenario
M. Pančićet al.
Title Page
Abstract Introduction
Conclusions References
Tables Figures
◭ ◮
◭ ◮
Back Close
Full Screen / Esc
Printer-friendly Version Interactive Discussion
Discussion
P
a
per
|
Discussion
P
a
per
|
Discussion
P
a
per
|
Discussion
P
a
per
|
Biogeosciences Discuss., 12, 4627–4654, 2015 www.biogeosciences-discuss.net/12/4627/2015/ doi:10.5194/bgd-12-4627-2015
© Author(s) 2015. CC Attribution 3.0 License.
This discussion paper is/has been under review for the journal Biogeosciences (BG). Please refer to the corresponding final paper in BG if available.
Resilience to temperature and pH
changes in a future climate change
scenario in six strains of the polar diatom
Fragilariopsis cylindrus
M. Pančić1,2, P. J. Hansen3, A. Tammilehto1, and N. Lundholm1
1
Natural History Museum of Denmark, University of Copenhagen, Copenhagen K, Denmark
2
National Institute of Aquatic Resources, DTU Aqua, Section for Marine Ecology and Oceanography, Technical University of Denmark, Charlottenlund, Denmark
3
Marine Biological Section, University of Copenhagen, Helsingør, Denmark
Received: 12 February 2015 – Accepted: 6 March 2015 – Published: 20 March 2015
Correspondence to: M. Pančić([email protected])
BGD
12, 4627–4654, 2015Resilience to temperature and pH
changes in a future climate change
scenario
M. Pančićet al.
Title Page
Abstract Introduction
Conclusions References
Tables Figures
◭ ◮
◭ ◮
Back Close
Full Screen / Esc
Printer-friendly Version Interactive Discussion
Discussion
P
a
per
|
Discussion
P
a
per
|
Discussion
P
a
per
|
Discussion
P
a
per
|
Abstract
The effects of ocean acidification and increased temperature on physiology of six
strains of the polar diatomFragilariopsis cylindrus from Greenland were investigated. Experiments were performed under manipulated pH levels (8.0, 7.7, 7.4, and 7.1) and different temperatures (1, 5 and 8◦C) to simulate changes from present to plausible 5
future levels. Each of the 12 scenarios was run for 7 days, and a significant interac-tion between temperature and pH on growth was detected. By combining increased temperature and acidification, the two factors counterbalanced each other, and there-fore no effect on the growth rates was found. However, the growth rates increased
with elevated temperatures by∼20–50 % depending on the strain. In addition, a gen-10
eral negative effect of increasing acidification on growth was observed. At pH 7.7 and
7.4, the growth response varied considerably among strains. However, a more uniform response was detected at pH 7.1 with most of the strains exhibiting reduced growth rates by 20–37 % compared to pH 8.0. It should be emphasized that a significant inter-action between temperature and pH was found, meaning that the combination of the
15
two parameters affected growth differently than when considering one at a time. Based
on these results, we anticipate that the polar diatomF. cylindruswill be unaffected by
changes in temperature and pH within the range expected by the end of the century. In each simulated scenario, the variation in growth rates among the strains was larger than the variation observed due to the whole range of changes in either pH or
temper-20
ature. Climate change may therefore not affect the species as such, but may lead to
BGD
12, 4627–4654, 2015Resilience to temperature and pH
changes in a future climate change
scenario
M. Pančićet al.
Title Page
Abstract Introduction
Conclusions References
Tables Figures
◭ ◮
◭ ◮
Back Close
Full Screen / Esc
Printer-friendly Version Interactive Discussion
Discussion
P
a
per
|
Discussion
P
a
per
|
Discussion
P
a
per
|
Discussion
P
a
per
|
1 Introduction
The Arctic Ocean is currently experiencing fast environmental changes, such as warm-ing and sea ice loss, as well as sea ice and ecosystem structure changes due to natural and anthropogenic factors (Arrigo, 2014; Nicolaus et al., 2012; Turner and Overland, 2009). According to some models, the average sea surface temperature (SST) in some
5
areas of the global ocean will increase by 1–4◦C over the next 100 years (Alley et al., 2007; Feng et al., 2008), with the largest changes happening in the Arctic (Gradinger, 1995; Hansen et al., 2010). At high latitudes above the Arctic Circle, the average sur-face air warming rate was found to be about 0.7◦C per decade (∼6◦C by the end of the
21st century), which will have a strong impact on the SST of the Arctic Ocean (Comiso,
10
2010). These changes may impact algal communities via changes in physical forcing, biogeochemical cycling, and food web interactions due to loss of habitat (Boras et al., 2010; Fountain et al., 2012; Johannessen and Miles, 2011; Melnikov, 2005). Higher temperatures may intensify heterotrophic processes in sea ice, via increased grazing rates and nutrient regeneration (Melnikov, 2009). Earlier melting of snow cover may
15
accelerate the timing of ice algal blooms, but it is difficult to predict their impact; and
mismatching in timing between the phytoplankton production and the reproductive cy-cle of key Arctic secondary producers could have negative consequences for the entire lipid-driven Arctic marine ecosystem (Søreide et al., 2010). Recent studies on ocean surface warming suggest increased phytoplankton productivity as a consequence of
20
increased temperatures (Feng et al., 2009; Mock and Hoch, 2005; Torstensson et al., 2012). Mock and Hoch (2005) reported that given enough time, the polar diatom Frag-ilariopsis cylindruscould efficiently adjust its photosynthesis to diverse temperatures.
Similarly, Torstensson et al. (2012) showed that an elevated temperature (from 0.5 to 4.5◦C) increased the growth rate of the benthic/sea ice diatomNavicula directa.
25
BGD
12, 4627–4654, 2015Resilience to temperature and pH
changes in a future climate change
scenario
M. Pančićet al.
Title Page
Abstract Introduction
Conclusions References
Tables Figures
◭ ◮
◭ ◮
Back Close
Full Screen / Esc
Printer-friendly Version Interactive Discussion
Discussion
P
a
per
|
Discussion
P
a
per
|
Discussion
P
a
per
|
Discussion
P
a
per
|
fresh surface waters which promote high CO2 solubility (Yamamoto et al., 2012). Ac-cording to Alley et al. (2007), the atmospheric partial pressure of CO2 (pCO2) is likely
to exceed 700 parts per million (ppm) by the year 2100. In the open oceans, where phytoplankton biomass and primary productivity is usually low, this will be accompa-nied by a seawater pH decline from a global preindustrial level of∼8.2 to about 7.8 5
(Alley et al., 2007; Orr et al., 2005; Yamamoto et al., 2012), with low seasonal variability (Feely et al., 2009). However, in coastal ecosystems pH displays large seasonal and diurnal fluctuations due to high primary production, respiration, upwelling and water residence time (Duarte et al., 2013; Thoisen et al., 2015).
To date, experimental data on phytoplankton tolerance to decreasing pH and rising
10
SST are scarce and mostly only available for phytoplankton from temperate coastal waters. Berge et al. (2010) investigated the tolerance of eight temperate phytoplankton species from four groups (dinoflagellates, cryptophytes, diatoms, prymnesiophytes) to lowered pH, and showed that marine phytoplankton was, in general, resistant to climate change in terms of ocean acidification. Similarly, Nielsen et al. (2011) reported that the
15
investigated coastal plankton communities from temperate regions were unaffected by
projected 21 century changes in pH and free CO2. Iglesias-Rodriguez et al. (2008) reported increased calcification and primary production of the coccolithophore hapto-phyteEmiliania huxleyi at elevated CO2 concentrations. On the other hand, Riebesell
et al. (2000) and Feng et al. (2008) showed decreasing calcification rates and
mal-20
formed coccoliths of the same species at increasing acidification. A recent study on ocean acidification in the polar areas showed negative effects on growth rates of the
brine algal community, when exposed to pH below 7.6 (McMinn et al., 2014). Likewise, Torstensson et al. (2012) reported somewhat reduced growth rates of the polar diatom
Navicula directaat increasedpCO2levels (960 ppm; pH∼7.7).
25
Experimental data on combined effects of elevated temperatures and decreased pH
on the growth of phytoplankton from polar waters remain limited and poorly understood (Slagstad et al., 2011). Most studies investigating climate effects on phytoplankton use
BGD
12, 4627–4654, 2015Resilience to temperature and pH
changes in a future climate change
scenario
M. Pančićet al.
Title Page
Abstract Introduction
Conclusions References
Tables Figures
◭ ◮
◭ ◮
Back Close
Full Screen / Esc
Printer-friendly Version Interactive Discussion
Discussion
P
a
per
|
Discussion
P
a
per
|
Discussion
P
a
per
|
Discussion
P
a
per
|
species are genetically and physiologically diverse. Therefore, conclusions based on single strains could potentially be misguiding. The aim of the present study was to sim-ulate pH and temperature changes from present to probable future levels, to be able to evaluate their potential impact on the growth of the polar diatom species Fragilariop-sis cylindrus(Grunow) Krieger, based on six strains of the species.F. cylindrusis one
5
of the most widespread and common diatoms in polar and sub-polar regions (Kang and Fryxell, 1992; Lundholm and Hasle, 2008), and an important species in terms of biomass and primary production during spring blooms in the Arctic Sea (von Quillfeldt, 2000). It is common in pack ice as well as in the water column throughout the year (Kang et al., 1993; Kang and Fryxell, 1992), although its relative abundance
consider-10
ably decreases after late spring (von Quillfeldt, 2000).
2 Materials and methods
2.1 Cultures
Water samples were collected from Disko Bay (69◦11 N, 53◦31 W) on the west coast of Greenland. Six different clonal strains (D3G1, D4D11, D10A12, D5A4, D8F4 and 15
D8G3) of Fragilariopsis cylindrus were isolated into clonal cultures in April (D3G1 – 23 April 2011, D4D11 and D10A12 – 26 April 2011, D5A4 – 29 April 2011) and May (D8F4 and D8G3 – 7 May 2011) 2011 by isolating single cells or single chains. The strains were cultured at 4◦C at 20–30 µmol photons m−2s−1following a light : dark cycle of 16 : 8 h, and the medium used was L1 (Guillard and Hargraves, 1993) based on
20
autoclaved 0.2 µm filtered seawater with a salinity of 33.
2.1.1 Experimental setup
The experiments were carried out at three different temperatures, 1, 5, and 8◦C, and
four different pH treatments, pH 8.0, 7.7, 7.4, and 7.1. The experiments were designed
to ensure that the cells were kept in the exponential growth phase; hence, for the total
BGD
12, 4627–4654, 2015Resilience to temperature and pH
changes in a future climate change
scenario
M. Pančićet al.
Title Page
Abstract Introduction
Conclusions References
Tables Figures
◭ ◮
◭ ◮
Back Close
Full Screen / Esc
Printer-friendly Version Interactive Discussion
Discussion
P
a
per
|
Discussion
P
a
per
|
Discussion
P
a
per
|
Discussion
P
a
per
|
duration of the experiments, maximum growth rates were observed. The first set of experiments with six strains (D3G1, D4D11, D10A12, D5A4, D8F4 and D8G3) was carried out at 5◦C and all four pH treatments. Based on these results, the second set of experiments was carried out with a reduced number of strains (D3G1, D4D11 and D10A12) at 8◦C and with all the pH treatments, and the last set with the same reduced
5
number of strains at 1◦C. The cells were exposed to 90–100 µmol photons m−2s−1, following a light : dark cycle of 16 : 8 h.
For acclimation, each of the six strains was grown in L1 medium, based on 0.2 µm filtered seawater, with a pH value of 8.0, at a temperature of 5◦C, and at a light intensity of 90–100 µmol photons m−2s−1for two days. Three of the strains were acclimated to
10
8 and 1◦C, in steps of
∼2◦C per day. After two days of acclimation, pH of the cultures
was lowered to pH 7.7, 7.4 and 7.1 in steps of 0.3 pH units every 24 h by addition of strongly acidified L1 medium (pH 0.49±0.02). The pH level of the acidified L1 medium
was lowered by using gaseous CO2(Air Liquid Denmark A/S. UN 1013 Carbon Dioxide, Class 2, 2A, ADR). During the days of acclimation to different temperatures and pH 15
treatments, the strains were grown in 65 mL flasks with L1 medium and exposed to the same light intensity (90–100 µmol photons m−2
s−1
) following a light : dark cycle of 16 : 8 h. The L1 growth medium was selected to ensure nutrient-replete conditions for the algal cultures during the experiment (Lundholm et al., 2004).
The experimental flasks (65 mL) were inoculated with a cell concentration of 1000
20
cells mL−1and L1 medium of the pH-specific value. All experiments were performed in triplicates. For enumeration of cells, 2 mL were withdrawn and fixed with 30 µL of acidic Lugol’s solution (2 % final concentration). Before sub-sampling, each flask was gently rotated vertically at least 15 times to ensure that the cells were equally distributed. Sub-sampling was carried out at approximately 10 a.m. every day, starting with those grown
25
BGD
12, 4627–4654, 2015Resilience to temperature and pH
changes in a future climate change
scenario
M. Pančićet al.
Title Page
Abstract Introduction
Conclusions References
Tables Figures
◭ ◮
◭ ◮
Back Close
Full Screen / Esc
Printer-friendly Version Interactive Discussion
Discussion
P
a
per
|
Discussion
P
a
per
|
Discussion
P
a
per
|
Discussion
P
a
per
|
lower pH of the samples. The pH level was measured before and after dilution. For cell counting, an inverted light microscope (OLYMPUS CKX31, 100× magnification)
and a Sedgewick-Rafter chamber were used, and a minimum of 400 cells from each sample was counted, corresponding to a deviation of ±10 % using 95 % confidence
limits (Utermöhl, 1958). Sampling was initiated on day 3 to allow the experimental
5
cultures to acclimate to the experimental conditions and to overcome the initial lag phase (day 0–2). Thus, the time period from day 0 to day 3 was considered as part of the acclimation period and not included in the results.
Temperature and pH were measured using a WTW pH 340i pH-meter with a SenTix 41 electrode, with a sensor detection limit of 0.01. The pH electrode was calibrated
10
weekly (2 point calibration) using Sentron buffers of pH 7.0 and 10.0 dilutions.
2.1.2 Dissolved inorganic carbon and nutrients
The concentration of dissolved inorganic carbon (DIC) in fresh media (all four pH treat-ments) was measured in triplicate. Measurements were done using an infrared gas analyzer (IRGA) and a bicarbonate standard solution (2 mmol L−1), as described in
15
Nielsen et al. (2007). The concentration of carbon species (bicarbonate ion HCO−3, carbonate ion CO23−, and dissolved carbon dioxide CO2 (aq) and carbonic acid
H2CO3) in the media was calculated from pH, salinity, temperature and DIC, using the CO2SYS.XLS program (set of constants: K1, K2 from Mehrbach et al., 1973 refit by Dickson and Millero, 1987; KHSO4from Dickson, 1990;pH scaleas seawater scale
20
(mol kg−1-SW), Lewis and Wallace, 2014).
Samples (3mL×50 mL) for measurements of inorganic nutrients (nitrate NO−3,
phos-phate PO34− and silicate Si(OH)4) were taken from L1 medium (pH 8.0) and frozen
immediately. The samples were analyzed at the Institute for Bioscience, University of Aarhus, following procedures of Hansen and Koroleff(2007).
BGD
12, 4627–4654, 2015Resilience to temperature and pH
changes in a future climate change
scenario
M. Pančićet al.
Title Page
Abstract Introduction
Conclusions References
Tables Figures
◭ ◮
◭ ◮
Back Close
Full Screen / Esc
Printer-friendly Version Interactive Discussion
Discussion
P
a
per
|
Discussion
P
a
per
|
Discussion
P
a
per
|
Discussion
P
a
per
|
2.1.3 Maximum growth rates
Assuming exponential growth of the cells, the maximum growth rates were calculated from the logarithmic curves of cell growths (logarithmic cumulative cell concentrations vs. days) using the equation
lnN1=lnN0+µ(t1−t0) , (1) 5
whereN0andN1are the number of cells at timet0andt1.
The maximum growth rate for a given strain and pH treatment at a specific temper-ature was calculated employing linear regression for the steepest part of the growth curve. Linear regression was carried out for each replica of the strain at a given ment, and the mean of maximum growth rates of the three replicates at a given
treat-10
ment was taken as the maximum growth rate for that combination of strain and treat-ment. The temperature coefficients, Q10 for the growth rates, as a consequence of
increased temperature by 10◦C, were calculated according to the equation
Q10= µT2
µT
1
!
10
T2−T1
, (2)
whereµT1 andµT2are the maximum growth rates at temperaturesT1=1◦C andT
2=
15
8◦C.
2.2 Molecular characterization
All six F. cylindrus strains (D3G1, D4D11, D10A12, D5A4, D8F4 and D8G3) were used for molecular characterization of ITS1, 5.8S and ITS2 (ITS – Internal transcribed spacer) of the nuclear rDNA. Cells of each of the six strains were concentrated and
20
BGD
12, 4627–4654, 2015Resilience to temperature and pH
changes in a future climate change
scenario
M. Pančićet al.
Title Page
Abstract Introduction
Conclusions References
Tables Figures
◭ ◮
◭ ◮
Back Close
Full Screen / Esc
Printer-friendly Version Interactive Discussion
Discussion
P
a
per
|
Discussion
P
a
per
|
Discussion
P
a
per
|
Discussion
P
a
per
|
2.3 Statistical analyses
All analyses were performed using IBM SPSS Statistics (version 22). Differences
be-tween the treatments were tested using two-way ANOVA, with Bonferroni’s correction and Student’sttest. The normal distribution of data was tested using a Shapiro–Wilk test. Levene’s test verified the equality of variances in the data (homogeneity of
vari-5
ances). The level of significance used was 0.05.
3 Results
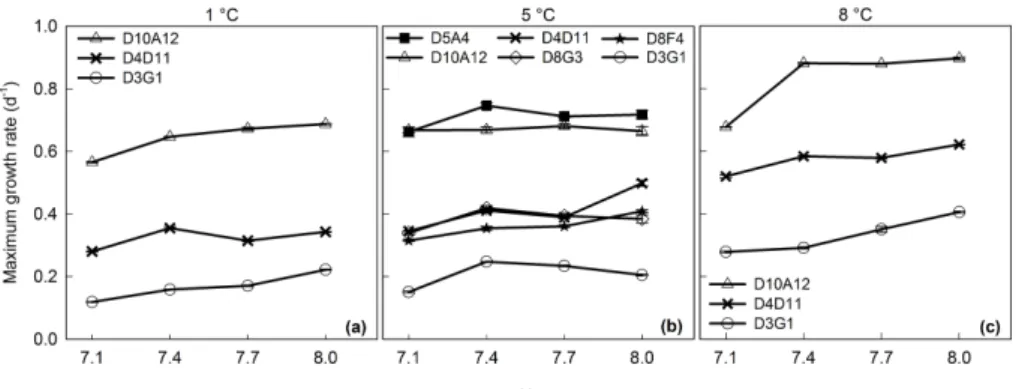
3.1 Growth ofFragilariopsis cylindrusstrains
All strains, cultivated at all combinations of three different temperatures and four diff
er-ent pH treatmer-ents, grew exponer-entially as a function of time, with an acclimation period
10
of three days (Fig. S1 in the Supplement). The differences in growth rates within and
among the strains were tested using two-way ANOVA, and a significant interaction be-tween temperature and pH on growth rate was found (allP values<0.05). This means that the effect of temperature on growth rates depends on pH, and vice versa.
3.1.1 Growth vs. temperature – at four different pH treatments 15
A general positive effect of increased temperature on the growth rates was observed
at all four different pH treatments (Fig. 1). Comparisons of the maximum growth rates
among the three different temperatures showed highest growth rates at 8◦C in all four
pH treatments, followed by those at 5 and 1◦C (Fig. 1). The trend was the same for each
of the three strains, D10A12, D4D11 and D3G1. The resultingQ10 values according
20
to Eq. (2) are shown in Table 1. The Q10 values illustrate that the growth rates, as a consequence of increased temperature by 10◦C are a strain-specific feature, e.g.
BGD
12, 4627–4654, 2015Resilience to temperature and pH
changes in a future climate change
scenario
M. Pančićet al.
Title Page
Abstract Introduction
Conclusions References
Tables Figures
◭ ◮
◭ ◮
Back Close
Full Screen / Esc
Printer-friendly Version Interactive Discussion
Discussion
P
a
per
|
Discussion
P
a
per
|
Discussion
P
a
per
|
Discussion
P
a
per
|
Strain D10A12 showed the overall highest growth rates at the highest temperature (8◦C). At pH 7.1, significant differences were found between the growth rates at 1◦C
and the two higher temperatures (5 and 8◦C). At pH 7.4 and 8.0, significant diff
er-ences were observed among all temperatures, whereas at pH 7.7, significant diff
er-ences were found between 8◦C and the two lower temperatures (P <0.05; Fig. 1a,
5
Fig. S2a). In strains D4D11 and D3G1, significant differences were found between the
growth rates for all combinations of treatment (pairwise comparisons,P <0.05; Fig. 1 b and c, Fig. S2b and c).
3.1.2 Growth vs. pH – at three different temperatures
A general negative effect of increased acidification at three different temperatures on 10
the growth rates was observed (Fig. 2).
At 5◦C, the maximum growth rates were highest in strains D5A4 and D10A12, ir-respective of the pH treatment. The maximum growth rates of the three other strains (D4D11, D8F4 and D8G3) were approximately 50 % smaller than those of D5A4 and D10A12 for every pH value, but approximately twice as high as the lowest growth
15
rates observed in strain D3G1 (Fig. 2b, Table S1 in the Supplement). Within the pH 7.1 treatment, significant differences were observed among the growth rates of all
the strains (P <0.05), except between D8G3 and D4D11, and D5A4 and D10A12 (P >0.05; Fig. S3-IIa). Within the pH 7.4 and 7.7 treatments, significant differences
between the growth rates of each pair of the strains were observed (P <0.05), except
20
between D8G3 and D4D11 (P >0.05; Fig. S3-IIb-c). Within the 8.0 pH treatment, sig-nificant differences were observed among the growth rates of all the strains (P <0.05;
Fig. S3-IId).
Overall we found a decrease in growth rates from pH 8.0 to pH 7.1 at 5◦C (Fig. 2b,
Ta-ble S1), yet with variation among strains. In strain D8F4, the highest maximum growth
25
ob-BGD
12, 4627–4654, 2015Resilience to temperature and pH
changes in a future climate change
scenario
M. Pančićet al.
Title Page
Abstract Introduction
Conclusions References
Tables Figures
◭ ◮
◭ ◮
Back Close
Full Screen / Esc
Printer-friendly Version Interactive Discussion
Discussion
P
a
per
|
Discussion
P
a
per
|
Discussion
P
a
per
|
Discussion
P
a
per
|
served. In strains D8G3 and D3G1, the maximum growth rates increased from pH 8.0 to pH 7.4, and then decreased at pH 7.1. The maximum growth rates in strain D10A12 were approximately the same in all four pH treatments. In D4D11 and D3G1 strains, significant differences between the growth rates were observed for all combinations of
pH treatment (P <0.05), and no significant differences for any pH combination in strain 5
D10A12 (P >0.05). Within strains D8G3 and D5A4, significant differences between
the growth rates were observed for all combinations of pH treatment (P <0.05), except for the pH combination 7.7–8.0 (P >0.05). Similarly, significant differences between
the growth rates for all combinations of the pH treatment (P <0.05) apart from the pH combination 7.4–7.7 were observed in strain D8F4 (pairwise comparisons,P >0.05;
10
Fig. S3-II).
At 1◦C, strain D10A12 exhibited the highest maximum growth rates, irrespective of the pH treatment (Fig. 2a). The maximum growth rates of strains D4D11 and D3G1 were approximately 50 and 70 % smaller than those of D10A12 for every pH value (Fig. 2a, Table S2). Within all four pH treatments, significant differences between the 15
growth rates of each pair of strains were observed (P <0.05).
For all three strains grown at 1◦C, the maximum growth rates at different pH
treat-ments were highest at pH 8.0, and gradually decreased with increased acidification in strains D10A12 and D3G1. In strain D4D11, the maximum growth rates first de-creased from pH 8.0 to pH 7.7, then slightly inde-creased at pH 7.4, and again dede-creased
20
at pH 7.1 (Fig. 2a, Table S2). Within all three strains, significant differences among the
growth rates were observed for all combinations of pH treatment (pairwise compar-isons,P <0.05; Fig. S3-I).
At 8◦C, the maximum growth rates were highest in strain D10A12, irrespective of the pH treatment, followed by strain D4D11 (∼30 % lower) and strain D3G1 (∼60 % lower) 25
(Fig. 2c, Table S3). In all four pH treatments, significant differences were observed
among the growth rates of each pair of the strains (P <0.05).
BGD
12, 4627–4654, 2015Resilience to temperature and pH
changes in a future climate change
scenario
M. Pančićet al.
Title Page
Abstract Introduction
Conclusions References
Tables Figures
◭ ◮
◭ ◮
Back Close
Full Screen / Esc
Printer-friendly Version Interactive Discussion
Discussion
P
a
per
|
Discussion
P
a
per
|
Discussion
P
a
per
|
Discussion
P
a
per
|
significant differences were observed among the growth rates for all combinations of
pH treatments (P <0.05). Significant differences among the growth rates for all
com-binations of the pH treatments except for the pH combination 7.4–7.7 (P>0.05) were observed in strains D10A12 and D4D1 (pairwise comparisons,P <0.05; Fig. S3-III).
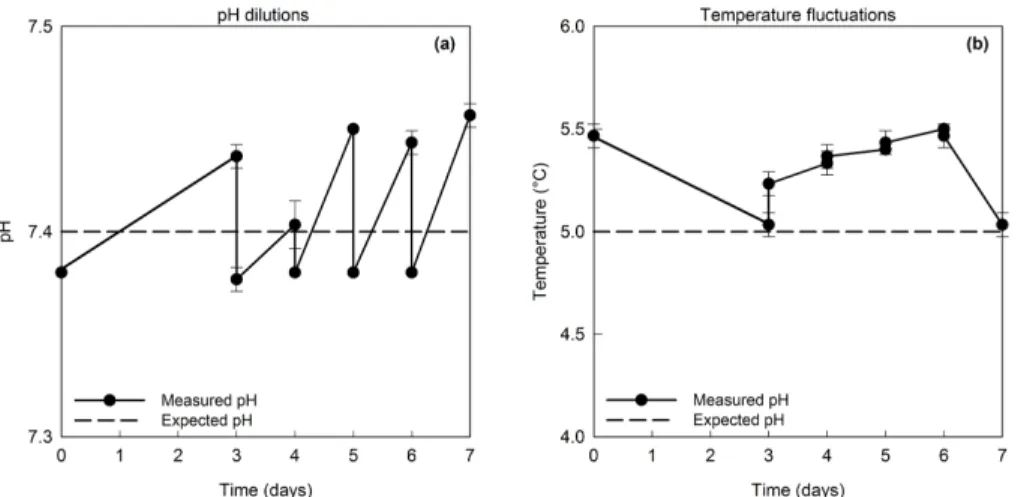
3.2 Experimental temperature, pH, DIC and nutrients
5
Temperature and pH in the experimental treatments fluctuated minimally around the designated values (<0.05◦C and<0.03 units, respectively) (Fig. 3, Table 2). The DIC concentrations increased with decreasing pH of the medium. In all treatments, the concentration of HCO−3 exceeded 90 % of the total inorganic carbon, with the highest share being observed at pH 7.1, and the lowest at pH 8.0. The concentration of CO2
10
(aq) and H2CO3 decreased with increasing pH, from 199.8±4.3 µmol L− 1
at pH 7.1 to 24.3±1.4 µmol L−1at pH 8.0, whereas the concentration of CO23−increased from 16.9±
0.4 µmol L−1at pH 7.1 to 96.7±4.9 µmol L−1 at pH 8.0 (Table S4). The concentrations
of nutrients NO−3, PO34− and Si(OH)4from L1 medium (pH 8.0) were 523.04±5.70 µM,
30.06±0.85 µM and 47.44±4.03 µM, respectively, which fitted the Si : N : P=16 : 16 : 1 15
ratio of marine diatoms (Justićet al., 1995).
3.3 Molecular identification
The sequences of ITS1, 5.8S and ITS2 of all six strains were identical to each other and also identical to strain Real9 of F. cylindrus in Genbank with accession number EF660056, confirming their identity and similarity.
BGD
12, 4627–4654, 2015Resilience to temperature and pH
changes in a future climate change
scenario
M. Pančićet al.
Title Page
Abstract Introduction
Conclusions References
Tables Figures
◭ ◮
◭ ◮
Back Close
Full Screen / Esc
Printer-friendly Version Interactive Discussion
Discussion
P
a
per
|
Discussion
P
a
per
|
Discussion
P
a
per
|
Discussion
P
a
per
|
4 Discussion and conclusions
4.1 Growth of multiple strains of the Arctic diatomFragilariopsis cylindrusat different temperatures and pH
Fragilariopsis cylindrus is an ecologically important polar sea-ice and phytoplankton species, and as a model organism it may help us improve the understanding of the
5
consequences resulting from changes in the atmospheric CO2concentration and con-current SST rise in high-latitude environments. By manipulating temperature and pH levels in laboratory experiments, plausible future climate change scenarios were sim-ulated. Throughout the experiment, the temperature and pH of the experimental treat-ments fluctuated minimally (<0.05◦C and<0.03 units, respectively; Table 2), making
10
the treatments clearly separate from each other, and thus enabling an evaluation of the combined effects of ocean acidification and temperature on several strains of a
mi-croalgal species.
4.1.1 Combined effects of temperature and pH on growth of the multipleF.
cylindrusstrains
15
Future marine phytoplankton will not be exposed solely to a decrease in pH but also to other concurrent changes such as increased SST, which is why it is important to consider cumulative effects of multiple climate stressors (e.g. present study; Schlüter
et al., 2014; Xu et al., 2014). This study showed a statistically significant interaction between pH and temperature on the growth of allF. cylindrusstrains cultivated at four
20
pH treatments and three temperatures (two-way ANOVA,P <0.05). An overall positive effect of increased temperature and alkalinisation on the growth rates at the same time
was detected forF. cylindrus, despite the variability in strain-specific responses (Figs. 1 and 2).
The variation in the growth rates within a single species suggests variation in
evo-25
BGD
12, 4627–4654, 2015Resilience to temperature and pH
changes in a future climate change
scenario
M. Pančićet al.
Title Page
Abstract Introduction
Conclusions References
Tables Figures
◭ ◮
◭ ◮
Back Close
Full Screen / Esc
Printer-friendly Version Interactive Discussion
Discussion
P
a
per
|
Discussion
P
a
per
|
Discussion
P
a
per
|
Discussion
P
a
per
|
why it is important to take intra-specific diversity into account when trying to under-stand the physiology and evolution of natural populations (Collins et al., 2014). This study showed that different strains ofF. cylindrus can be affected by climate change
in different ways. At a temperature of 5◦C and different pH treatments, some strains
experienced positive, negative or no effects when treated with specific pH treatment. In 5
contrast, a more general pattern in growth rates was observed at 1 and 8◦C at specific pH treatments – (1) the growth rates of all three strains increased with alkalinity (from pH 7.1 to 8.0), and at the same time (2) all three strains exhibited highest growth rates at pH 8.0 which further increased with elevated temperature (from 1 to 8◦C). These two observed patterns illustrate that the combination of both parameters counterbalances
10
each other. Here is why: if the growth rates of the three strains observed at pH 8.0 and temperature 1◦C, which represent the present conditions in the Arctic environments, are compared with the growth rates obtained at pH 7.7 and temperature 5◦C, which are the conditions expected by the year 2100, no effect of the elevated temperature and
acidification can be found (e.g. D3G1 µ=0.22±0.00 and µ=0.23±0.00, respectively). 15
Similar results were observed forF. cylindrus strain from the Antarctic when exposed to pH 7.8 and temperature of 6◦C (Xu et al., 2014).
In contrast, if one parameter is examined at a time, a general positive effect of
in-creased temperature (see Sect. 4.1.2), and a general negative effect of increased
acid-ification (see Sect. 4.1.3) is found. However, one has to take into consideration that the
20
largest variability was found among the strains. Some strains showed better perfor-mance than others when cultivated in the same conditions, indicating that these strains may display high resilience to the changes in pH and temperature predicted for the 21 century (e.g. present study; Kremp et al., 2012; Langer et al., 2009). Climate change may therefore lead to alterations in strain composition, with the strains exhibiting high
25
BGD
12, 4627–4654, 2015Resilience to temperature and pH
changes in a future climate change
scenario
M. Pančićet al.
Title Page
Abstract Introduction
Conclusions References
Tables Figures
◭ ◮
◭ ◮
Back Close
Full Screen / Esc
Printer-friendly Version Interactive Discussion
Discussion
P
a
per
|
Discussion
P
a
per
|
Discussion
P
a
per
|
Discussion
P
a
per
|
4.1.2 Effects of temperature on growth of the multipleF. cylindrusstrains
A change of temperature had significant effects on F. cylindrusgrowth rates (Fig. 2).
The increasing growth rates correlated to elevated temperatures despite the variabil-ity in strain-specific responses. One of the fastest growing strains (D10A12) generally exhibited 50 % higher growth rates than the other strains, irrespective of the treatment.
5
The growth rates were always highest at 8◦C regardless of pH. The slowest growing strain (D3G1) displayed the biggest differences in growth rates when cultured at
ele-vated temperatures, with∼50 % higher growth rates at 8◦C compared to those at 1◦C.
The fastest growing strain (D10A12) exhibited∼20 % higher growth rates at 8◦C
com-pared to 1◦C. The resultingQ
10 values were found to be strain-specific, ranging from
10
1.29 to 3.35 (1–8◦C; Table 1). These results are in agreement with findings onF. cylin-drusexhibiting increased growth rates at elevated temperatures by approximately 45 % (Q10=2.28) in the temperature range of −1–7◦C (Mock and Hoch, 2005). Likewise,
Torstensson et al. (2012) reported that at elevated temperatures (from 0.5 to 4.5◦C) the growth rates of the benthic/sea ice diatomNavicula directaincreased by
approxi-15
mately 43 %. As similar data on polar phytoplankton are restricted, the present study provides important information for evaluating the effects of temperature increase in
po-lar areas.Fragilariopsis cylindrus, a polar microalgal representative, is well-adapted to a wide range of temperatures due to the phenotypic variation among strains and tem-perature adaptation of individual strains. We found that increased temtem-peratures had
20
greatest impact on the slowest growing strain (Table 1, Fig. 2).
The noteworthy variability in strain-specific responses, with growth rates varying up to∼65 % suggests that some strains perform better when exposed to perturbations
in the environment than others (Fig. 2, Tables S1–3). This high phenotypic plasticity in terms of temperature tolerance could be explained by the large temperature
fluctua-25
BGD
12, 4627–4654, 2015Resilience to temperature and pH
changes in a future climate change
scenario
M. Pančićet al.
Title Page
Abstract Introduction
Conclusions References
Tables Figures
◭ ◮
◭ ◮
Back Close
Full Screen / Esc
Printer-friendly Version Interactive Discussion
Discussion
P
a
per
|
Discussion
P
a
per
|
Discussion
P
a
per
|
Discussion
P
a
per
|
by DiskoBasis/Arctic Station, Faculty of Science, University of Copenhagen), and from
−1.8 to 6.7◦C during the year (Hansen et al., 2012) with an average SST of 1.8±1.2◦C
(March–December; DiskoBasis/Arctic Station). Similar intra-specific variation has also been observed among strains of the diatomSkeletonema marinoifrom two geographic areas. Kremp et al. (2012) reported thatS. marinoistrains from the North Sea, which
5
also experience large temperature fluctuations in their natural environment, uniformly exhibited higher growth rates at elevated temperatures (at 24 compared to 20◦C), in-dicating that the ability to adjust to varying temperature is advantageous for species. In contrast, S. marinoi strains from the temperate Adriatic Sea, where the tempera-ture is known to be more stable, responded to elevated temperatempera-tures in different ways, 10
with some strains being unaffected and others being positively or negatively affected
by temperature changes (Kremp et al., 2012). The present study confirms previous no-tion of high intra-specific variability within species, and emphasizes, that this variano-tion might be even larger than the variation observed due to changing environmental fac-tors, stressing the need for several strains when exploring the environmental effects on 15
species.
4.1.3 Effects of pH on growth of the multipleF. cylindrusstrains
Acidification results in both decreasing pH and increasing CO2 concentration. Gener-ally, rising CO2 is considered to facilitate photosynthetic carbon fixation by some
phy-toplankton groups (Riebesell, 2004). The direct effect of changes in environmental pH 20
is less clear but recent studies have shown that it can affect intracellular pH and
mem-brane potential, as well as enzyme activity (McMinn et al., 2014). In the present study, the concentration of DIC and the carbon species at pH 8.0 corresponded well to the concentrations found in the ocean surface;∼2 mmol L−1DIC, with∼90 % HCO−3,∼9 %
CO23−, and∼1 % CO2 (aq) and H2CO3 (Feely et al., 2009; Riebesell, 2004). DIC
in-25
creased with increased acidification from∼2.15 mmol L−1at pH 8.0 to∼2.65 mmol L−1
BGD
12, 4627–4654, 2015Resilience to temperature and pH
changes in a future climate change
scenario
M. Pančićet al.
Title Page
Abstract Introduction
Conclusions References
Tables Figures
◭ ◮
◭ ◮
Back Close
Full Screen / Esc
Printer-friendly Version Interactive Discussion
Discussion
P
a
per
|
Discussion
P
a
per
|
Discussion
P
a
per
|
Discussion
P
a
per
|
The present study found a general negative effect of increasing acidification on F.
cylindrus growth, and similarly to what was observed for temperature, a significant variability among the strains was observed (Fig. 1). A decrease in pH to 7.7, which is the expected global change in pH by the end of this century, and further decrease to 7.4, negatively affected growth of most of the strains. Reduced growth rates by 2–23 % 5
for a pH of 7.7 and 4–29 % for 7.4, were observed (compared to pH 8.0). On the other hand, some strains were unaffected by the increased seawater acidity, and some of
them were even positively affected (the growth rates increased up to 15 % for a pH of
7.7 and 25 % for a pH of 7.4 compared to pH 8.0). A further decrease in pH to 7.1 re-duced the growth rates of most of the strains by 20–37 %, as compared to those at pH
10
8.0. Similarly, McMinn et al. (2014) reported that the brine algal community experienced significantly reduced growth rates at pH 7.6, and when treated at pH 7.2, the growth decreased by 50 % compared to a pH of 8.0. Reduced growth rates due to increased acidification were also observed inNavicula directa. At apCO2level of 960 ppm (corre-sponding to pH∼7.7), the diatom experienced reduced growth by 5 % as compared to 15
380 ppm (corresponding to pH∼8.1) (Torstensson et al., 2012). Similar to our results,
a recent study on ocean acidification in the Arctic marine ecosystem found decreased growth rates of the polar phytoplankton community when exposed to increased seawa-ter acidity; community growth rates gradually decreased with increasing acidification (from 8.0 to 7.4) with a greater reduction at pH 7.1, where the community experienced
20
reduced growth rates by 55 % as compared to pH 8.0 (Thoisen et al., 2015).
To date, studies on phytoplankton responses to ocean acidification have mainly been focused on temperate or tropical regions, and only a few studies have been carried out in polar regions (e.g. present study; McMinn et al., 2014; Thoisen et al., 2015; Torstensson et al., 2012). However, increasedpCO2(∼1000 ppm, which corresponds
25
to pH∼7.7) affected tropical phytoplankton communities, which were found to respond
BGD
12, 4627–4654, 2015Resilience to temperature and pH
changes in a future climate change
scenario
M. Pančićet al.
Title Page
Abstract Introduction
Conclusions References
Tables Figures
◭ ◮
◭ ◮
Back Close
Full Screen / Esc
Printer-friendly Version Interactive Discussion
Discussion
P
a
per
|
Discussion
P
a
per
|
Discussion
P
a
per
|
Discussion
P
a
per
|
respectively). They speculated that common natural pH fluctuations in coastal regions made phytoplankton more pH-tolerant in these areas and therefore growth was not af-fected. Similar pH fluctuations were observed in the Arctic coastal waters (Disko Bay) during the spring bloom in 2012, with a pH gradient of 7.5–8.3. The pH fluctuation was found to be caused by the transition from the polar night period and the
dom-5
inating respiration processes (pH ∼7.5) to the polar day period with the increasing
phytoplankton biomass and concomitant photosynthesis (Thoisen et al., 2015). The present study showed thatF. cylindrusis generally well-adapted to acidification down to ∼ pH 7.4, although with notable strain-specific response variability. Some strains
(e.g. D10A12, D4D11, D5A4, and D8G3) were slightly affected by the lower pH (−10 % 10
<µ<+10 %), whereas others (e.g. D3G1, D8F4) responded with greater reduction in
the growth rates (<29 %). Similar observations on the strain-specific response were also reported among other phytoplankton species (Kremp et al., 2012; Langer et al., 2009). Thus, these observations suggest that shifts in dominance among strains due to ocean acidification might be expected.
15
Long-term adaptation to environmental parameters of F. cylindrus strains was not considered in this study. However, the adaptation is expected to increase phenotypic plasticity (Schlüter et al., 2014) of the strains, and therefore the ability of the species to adapt to future climate conditions should increase even more.
The Supplement related to this article is available online at
20
doi:10.5194/bgd-12-4627-2015-supplement.
Acknowledgements. We thank the Arctic station in Qeqertarsuaq, Greenland, for providing ex-cellent research facilities and data on ocean temperature, and help in any way. Funding was provided by the Carlsberg Foundation (2012_01_0556), a grant DFF – 1323-00258 from the Danish Research Council to NL, and a grant Ad futura (11010-306) from Slovene Human
Re-25
BGD
12, 4627–4654, 2015Resilience to temperature and pH
changes in a future climate change
scenario
M. Pančićet al.
Title Page
Abstract Introduction
Conclusions References
Tables Figures
◭ ◮
◭ ◮
Back Close
Full Screen / Esc
Printer-friendly Version Interactive Discussion
Discussion
P
a
per
|
Discussion
P
a
per
|
Discussion
P
a
per
|
Discussion
P
a
per
|
References
Alley, R. B., Berntsen, T., Bindoff, N. L., Chen, Z., Chidthaisong, A., Friedlingstein, P.,
Gre-gory, J. M., Hegerl, G. C., Heimann, M., Hewitson, B., Hoskins, B. J., Joos, F., Jouzel, J., Kattsov, V., Lohmann, U., Manning, M., Matsuno, T., Molina, M., Nicholls, N., Overpeck, J., Qin, D., Raga, G., Ramaswamy, V., Ren, J., Rusticucci, M., Solomon, S., Somerville, R.,
5
Stocker, T. F., Stott, P. A., Stouffer, R. J., Whetton, P., Wood, R. A., and Wratt, D.:
Sum-mary for policymakers, in: Climate change 2007: The physical science basis. Contribution of Working Group I to the Fourth Assessment Report of the Intergovernmental Panel on Climate Change, edited by: Solomon, S., Qin, D., Manning, M., Chen, Z., Marquis, M., Averyt, K. B., Tignor, M., and Miller, H. L., Cambridge University Press, Cambridge, United Kingdom and
10
New York, NY, USA, 1–18, 2007.
Arrigo, K. R.: Sea ice ecosystems, Annual Review of Marine Science, 6, 439–467, 2014. Beaufort, L., Probert, I., de Garidel-Thoron, T., Bendif, E. M., Ruiz-Pino, D., Metzl, N., Goyet, C.,
Buchet, N., Coupel, P., Grelaud, M., Rost, B., Rickaby, R. E. M., and de Vargas, C.: Sensitivity of coccolithophores to carbonate chemistry and ocean acidification, Nature, 476, 80–83,
15
2011.
Berge, T., Daugbjerg, N., Andersen, B. B., and Hansen, P. J.: Effect of lowered pH on marine
phytoplankton growth rates, Mar. Ecol.-Prog. Ser., 416, 79–91, 2010.
Boras, J. A., Sala, M. M., Arrieta, J. M., Sa, E. L., Felipe, J., Agusti, S., Duarte, C. M., and Vaque, D.: Effect of ice melting on bacterial carbon fluxes channelled by viruses and protists 20
in the Arctic Ocean, Polar. Biol., 33, 1695–1707, 2010.
Collins, S., Rost, B., and Rynearson, T. A.: Evolutionary potential of marine phytoplankton under ocean acidification, Evol. Appl., 7, 140–155, 2014.
Comiso, J.: Polar Oceans from space, in: Atmospheric and Oceanographic Sciences Library, edited by: Mysak, L. A., and Hamilton, K., Springer Science+Business Media, New York, NY 25
10013, USA, 223–294, 2010.
Dickson, A. G.: Standard potential of the reaction: AgCl(s)+12H
2(g)=Ag(s)+HCl(aq), and
and the standard acidity constant of the ion HSO−4 in synthetic sea water from 273.15 to 318.15 K, J. Chem. Thermodyn., 22, 113–127, 1990.
Dickson, A. G. and Millero, F. J.: A comparison of the equilibrium constants for the dissociation
30
BGD
12, 4627–4654, 2015Resilience to temperature and pH
changes in a future climate change
scenario
M. Pančićet al.
Title Page
Abstract Introduction
Conclusions References
Tables Figures
◭ ◮
◭ ◮
Back Close
Full Screen / Esc
Printer-friendly Version Interactive Discussion
Discussion
P
a
per
|
Discussion
P
a
per
|
Discussion
P
a
per
|
Discussion
P
a
per
|
Duarte, C. M., Hendriks, I. E., Moore, T. S., Olsen, Y. S., Steckbauer, A., Ramajo, L., Carstensen, J., Trotter, J. A., and McCulloch, M.: Is ocean acidification an open-ocean syn-drome? Understanding anthropogenic impacts on seawater pH, Estuar. Coast, 36, 221–236, 2013.
Feely, R. A., Doney, S. C., and Cooley, S. R.: Ocean acidification: present conditions and future
5
changes in a high-CO2world, Oceanography, 22, 36–47, 2009.
Feng, Y., Warner, M. E., Zhang, Y., Sun, J., Fu, F. X., Rose, J. M., and Hutchins, D. A.: Inter-active effects of increasedpCO
2, temperature and irradiance on the marine coccolithophore
Emiliania huxleyi(Prymnesiophyceae), Eur. J. Phycol., 43, 87–98, 2008.
Feng, Y. Y., Hare, C. E., Leblanc, K., Rose, J. M., Zhang, Y. H., DiTullio, G. R., Lee, P. A.,
10
Wilhelm, S. W., Rowe, J. M., Sun, J., Nemcek, N., Gueguen, C., Passow, U., Benner, I., Brown, C., and Hutchins, D. A.: Effects of increasedpCO
2 and temperature on the North
Atlantic spring bloom. I. The phytoplankton community and biogeochemical response, Mar. Ecol.-Prog. Ser., 388, 13–25, 2009.
Fountain, A. G., Campbell, J. L., Schuur, E. A. G., Stammerjohn, S. E., Williams, M. W., and
15
Ducklow, H. W.: The disappearing cryosphere: impacts and ecosystem responses to rapid cryosphere loss, Bioscience, 62, 405–415, 2012.
Gao, K. S., Xu, J. T., Gao, G., Li, Y. H., Hutchins, D. A., Huang, B. Q., Wang, L., Zheng, Y., Jin, P., Cai, X. N., Hader, D. P., Li, W., Xu, K., Liu, N. N., and Riebesell, U.: Rising CO2 and increased light exposure synergistically reduce marine primary productivity, Nat. Clim.
20
Chang., 2, 519–523, 2012.
Gradinger, R.: Climate change and biological oceanography of the Arctic Ocean, Philos. T. R. Soc. A., 352, 277–286, 1995.
Guillard, R. R. L. and Hargraves, P. E.:Stichochrysis immobilisis a diatom, not a chrysophyte, Phycologia, 32, 234–236, 1993.
25
Hansen, H. P. and Koroleff, F.: Determination of nutrients, in: Methods of Seawater Analysis,
Wiley-VCH Verlag GmbH, 69469 Weinheim, Germany, 159–228, 2007.
Hansen, J., Ruedy, R., Sato, M., and Lo, K.: Global surface temperature change, Rev. Geophys., 48, 1–29, 2010.
Hansen, M. O., Nielsen, T. G., Stedmon, C. A., and Munk, P.: Oceanographic regime shift during
30
1997 in Disko Bay, Western Greenland, Limnol. Oceanogr., 57, 634–644, 2012.
Arm-BGD
12, 4627–4654, 2015Resilience to temperature and pH
changes in a future climate change
scenario
M. Pančićet al.
Title Page
Abstract Introduction
Conclusions References
Tables Figures
◭ ◮
◭ ◮
Back Close
Full Screen / Esc
Printer-friendly Version Interactive Discussion
Discussion
P
a
per
|
Discussion
P
a
per
|
Discussion
P
a
per
|
Discussion
P
a
per
|
brust, E. V., and Boessenkool, K. P.: Phytoplankton calcification in a high-CO2 world, Sci-ence, 320, 336–340, 2008.
Johannessen, O. M. and Miles, M. W.: Critical vulnerabilities of marine and sea ice-based ecosystems in the high Arctic, Reg. Environ. Change, 11, 239–248, 2011.
Justić, D., Rabalais, N. N., and Turner, R. E.: Stoichiometric nutrient balance and origin of 5
coastal eutrophication, Mar. Pollut. Bull., 30, 41–46, 1995.
Kang, S. H. and Fryxell, G. A.:Fragilariopsis cylindrus(Grunow) Krieger: the most abundant diatom in the water column assemblages of Antarctic marginal ice-edge zones, Polar. Biol., 12, 609–627, 1992.
Kang, S.-H., Fryxell, G. A., and Roelke, D. L.: Fragilariopsis cylindrus compared with other
10
species of the diatom family Bacillariaceae in Antarctic marginal ice-edge zones, in: Supple-ment to Nova Hedwigia; Progress in Diatom Studies: Contributions to Taxonomy, Ecology and Nomemclature, edited by: Sims, P. A., Beihefte zur Nova Hedwigia, J. Cramer in der Gebrueder Borntraeger Verlagsbuchhandlung, Berlin, Germany; E. Schweizerbart’sche Ver-lagsbuchhandlung, Johannesstrasse 3A, D-7000 Stuttgart, Germany, 335–352, 1993.
15
Kremp, A., Godhe, A., Egardt, J., Dupont, S., Suikkanen, S., Casabianca, S., and Penna, A.: In-traspecific variability in the response of bloom-forming marine microalgae to changed climate conditions, Ecology and Evolution, 2, 1195–1207, 2012.
Langer, G., Nehrke, G., Probert, I., Ly, J., and Ziveri, P.: Strain-specific responses of Emil-iania huxleyi to changing seawater carbonate chemistry, Biogeosciences, 6, 2637–2646,
20
doi:10.5194/bg-6-2637-2009, 2009.
Lewis, E. and Wallace, D.: available at: http://cdiac.ornl.gov/oceans/co2rprt.html (last access: 24 February 2014), Program developed for CO2 system calculations, 1998.
Lundholm, N. and Hasle, G. R.: Are Fragilariopsis cylindrus and Fragilariopsis nanabipolar diatoms? – Morphological and molecular analyses of two sympatric species, Nova Hedwigia
25
Beihefte, 133, 231–250, 2008.
Lundholm, N., Hansen, P. J., and Kotaki, Y.: Effect of pH on growth and domoic acid production
by potentially toxic diatoms of the generaPseudo-nitzschiaandNitzschia, Mar. Ecol.-Prog. Ser., 273, 1–15, 2004.
McMinn, A., Muller, M. N., Martin, A., and Ryan, K. G.: The response of Antarctic sea ice algae
30
BGD
12, 4627–4654, 2015Resilience to temperature and pH
changes in a future climate change
scenario
M. Pančićet al.
Title Page
Abstract Introduction
Conclusions References
Tables Figures
◭ ◮
◭ ◮
Back Close
Full Screen / Esc
Printer-friendly Version Interactive Discussion
Discussion
P
a
per
|
Discussion
P
a
per
|
Discussion
P
a
per
|
Discussion
P
a
per
|
Mehrbach, C., Culberso, C. H., Hawley, J. E., and Pytkowic, R. M.: Measurement of the ap-parent dissociation constants of carbonic acid in seawater at atmospheric pressure, Limnol. Oceanogr., 18, 897–907, 1973.
Melnikov, I. A.: Sea ice-upper ocean ecosystems and global changes in the Arctic, Biol. Morya-Vlad.+, 31, 3–10, 2005.
5
Melnikov, I. A.: Recent sea ice ecosystem in the Arctic Ocean: a review, in: Influence of Climate Change on the Changing Arctic and Sub-Arctic Conditions, edited by: Nihoul, J. C. J., and Kostianoy, A. G., NATO Science for Peace and Security Series C-Environmental Security, Springer, Dordrecht, the Netherlands, 57–71, 2009.
Mock, T. and Hoch, N.: Long-term temperature acclimation of photosynthesis in steady-state
10
cultures of the polar diatomFragilariopsis cylindrus, Photosynth. Res., 85, 307–317, 2005. Nicolaus, M., Katlein, C., Maslanik, J., and Hendricks, S.: Changes in Arctic sea ice result in
increasing light transmittance and absorption, Geophys. Res. Lett., 39, 1–6, 2012.
Nielsen, L. T., Lundholm, N., and Hansen, P. J.: Does irradiance influence the tolerance of marine phytoplankton to high pH?, Mar. Biol. Res., 3, 446–453, 2007.
15
Nielsen, L. T., Jakobsen, H. H., and Hansen, P. J.: High resilience of two coastal plankton communities to twenty-first century seawater acidification: evidence from microcosm studies, Mar. Biol. Res., 6, 542–555, 2010.
Nielsen, L. T., Hallegraeff, G. M., Wright, S. W., and Hansen, P. J.: Effects of experimental
seawater acidification on an estuarine plankton community, Aquat. Microb. Ecol., 65, 271–
20
285, 2011.
Orr, J. C., Fabry, V. J., Aumont, O., Bopp, L., Doney, S. C., Feely, R. A., Gnanadesikan, A., Gru-ber, N., Ishida, A., Joos, F., Key, R. M., Lindsay, K., Maier-Reimer, E., Matear, R., Monfray, P., Mouchet, A., Najjar, R. G., Plattner, G. K., Rodgers, K. B., Sabine, C. L., Sarmiento, J. L., Schlitzer, R., Slater, R. D., Totterdell, I. J., Weirig, M. F., Yamanaka, Y., and Yool, A.:
Anthro-25
pogenic ocean acidification over the twenty-first century and its impact on calcifying organ-isms, Nature, 437, 681–686, 2005.
Riebesell, U.: Effects of CO
2enrichment on marine phytoplankton, J. Oceanogr., 60, 719–729,
2004.
Riebesell, U., Zondervan, I., Rost, B., Tortell, P. D., Zeebe, R. E., and Morel, F. M. M.: Reduced
30
BGD
12, 4627–4654, 2015Resilience to temperature and pH
changes in a future climate change
scenario
M. Pančićet al.
Title Page
Abstract Introduction
Conclusions References
Tables Figures
◭ ◮
◭ ◮
Back Close
Full Screen / Esc
Printer-friendly Version Interactive Discussion
Discussion
P
a
per
|
Discussion
P
a
per
|
Discussion
P
a
per
|
Discussion
P
a
per
|
Schlüter, L., Lohbeck, K. T., Gutowska, M. A., Groger, J. P., Riebesell, U., and Reusch, T. B. H.: Adaptation of a globally important coccolithophore to ocean warming and acidification, Nat. Clim. Chang., 4, 1024–1030, 2014.
Slagstad, D., Ellingsen, I. H., and Wassmann, P.: Evaluating primary and secondary production in an Arctic Ocean void of summer sea ice: an experimental simulation approach, Prog.
5
Oceanogr., 90, 117–131, 2011.
Søreide, J. E., Leu, E., Berge, J., Graeve, M., and Falk-Petersen, S.: Timing of blooms, al-gal food quality andCalanus glacialis reproduction and growth in a changing Arctic, Glob. Change Biol., 16, 3154–3163, 2010.
Thoisen, C., Riisgaard, K., Lundholm, N., Nielsen, T. G., and Hansen, P. J.: Effect of acidification 10
on an Arctic phytoplankton community from Disko Bay, West Greenland, Mar. Ecol.-Prog. Ser., 520, 21–34, 2015.
Torstensson, A., Chierici, M., and Wulff, A.: The influence of increased temperature and carbon
dioxide levels on the benthic/sea ice diatomNavicula directa, Polar. Biol., 35, 205–214, 2012. Turner, J. and Overland, J.: Contrasting climate change in the two polar regions, Polar. Res.,
15
28, 146–164, 2009.
Utermöhl, H.: Zur Vervollkommnung der quantitativen Phytoplankton-Methodik, Mitteilungen – Internationale Vereinigung für Theoretische und Angewandte Limnologie, 9, 1–38, 1958. von Quillfeldt, C. H.: Common diatom species in arctic spring blooms: their distribution and
abundance, Bot. Mar., 43, 499–516, 2000.
20
Xu, K., Fu, F. X., and Hutchins, D. A.: Comparative responses of two dominant Antarctic phy-toplankton taxa to interactions between ocean acidification, warming, irradiance, and iron availability, Limnol. Oceanogr., 59, 1919–1931, 2014.
Yamamoto, A., Kawamiya, M., Ishida, A., Yamanaka, Y., and Watanabe, S.: Impact of rapid sea-ice reduction in the Arctic Ocean on the rate of ocean acidification, Biogeosciences, 9,
25
BGD
12, 4627–4654, 2015Resilience to temperature and pH
changes in a future climate change
scenario
M. Pančićet al.
Title Page
Abstract Introduction
Conclusions References
Tables Figures
◭ ◮
◭ ◮
Back Close
Full Screen / Esc
Printer-friendly Version Interactive Discussion
Discussion
P
a
per
|
Discussion
P
a
per
|
Discussion
P
a
per
|
Discussion
P
a
per
|
Table 1.TheQ10values (1–8◦C) for D10A12, D4D11 and D3G1 strains were calculated
accord-ing to Eq. (2), based on the mean maximum growth rates displayed in Table S2 and Table S3.
D10A12 D4D11 D3G1
7.1 1.29 2.42 3.35
7.4 1.54 2.06 2.34
7.7 1.48 2.45 2.81
BGD
12, 4627–4654, 2015Resilience to temperature and pH
changes in a future climate change
scenario
M. Pančićet al.
Title Page
Abstract Introduction
Conclusions References
Tables Figures
◭ ◮
◭ ◮
Back Close
Full Screen / Esc
Printer-friendly Version Interactive Discussion
Discussion
P
a
per
|
Discussion
P
a
per
|
Discussion
P
a
per
|
Discussion
P
a
per
|
Table 2.The average temperatures±SD (◦C) and pH values
±SD in the experimental treat-ments from day 0 to 7;na=12;nb=24.
Average temperatures (◦C)
BGD
12, 4627–4654, 2015Resilience to temperature and pH
changes in a future climate change
scenario
M. Pančićet al.
Title Page
Abstract Introduction
Conclusions References
Tables Figures
◭ ◮
◭ ◮
Back Close
Full Screen / Esc
Printer-friendly Version Interactive Discussion
Discussion
P
a
per
|
Discussion
P
a
per
|
Discussion
P
a
per
|
Discussion
P
a
per
|
Figure 1.The mean maximum growth rates (d−1
) of strains D5A4, D10A12, D4D11, D8G3, D8F4 and D3G1 cultivated at(a) 1◦C, (b)5◦C and(c)8◦C, and all four pH treatments. Error
BGD
12, 4627–4654, 2015Resilience to temperature and pH
changes in a future climate change
scenario
M. Pančićet al.
Title Page
Abstract Introduction
Conclusions References
Tables Figures
◭ ◮
◭ ◮
Back Close
Full Screen / Esc
Printer-friendly Version Interactive Discussion
Discussion
P
a
per
|
Discussion
P
a
per
|
Discussion
P
a
per
|
Discussion
P
a
per
|
Figure 2.The mean maximum growth rates (d−1
) of strains D5A4, D10A12, D4D11, D8G3, D8F4 and D3G1 cultivated at(a) 1◦C, (b)5◦C and(c)8◦C, and all four pH treatments. Error
BGD
12, 4627–4654, 2015Resilience to temperature and pH
changes in a future climate change
scenario
M. Pančićet al.
Title Page
Abstract Introduction
Conclusions References
Tables Figures
◭ ◮
◭ ◮
Back Close
Full Screen / Esc
Printer-friendly Version Interactive Discussion
Discussion
P
a
per
|
Discussion
P
a
per
|
Discussion
P
a
per
|
Discussion
P
a
per
|
Figure 3. (a)An example of pH dilutions in the pH treatment 7.4 at 5◦C, shown as a function