ACPD
9, 8223–8260, 2009New particles from pine emissions
L. Q. Hao et al.
Title Page
Abstract Introduction
Conclusions References
Tables Figures
◭ ◮
◭ ◮
Back Close
Full Screen / Esc
Printer-friendly Version
Interactive Discussion
Atmos. Chem. Phys. Discuss., 9, 8223–8260, 2009 www.atmos-chem-phys-discuss.net/9/8223/2009/ © Author(s) 2009. This work is distributed under the Creative Commons Attribution 3.0 License.
Atmospheric Chemistry and Physics Discussions
This discussion paper is/has been under review for the journalAtmospheric Chemistry and Physics (ACP). Please refer to the corresponding final paper inACPif available.
New particle formation from the oxidation
of direct emissions of pine seedlings
L. Q. Hao1, P. Yli-Piril ¨a2, P. Tiitta1, S. Romakkaniemi1, P. Vaattovaara1,
M. K. Kajos3, J. Rinne3, J. Heijari2, A. Kortelainen1, P. Miettinen1, J. H. Kroll4,
J.-K. Holopainen2, J. Joutsensaari1, M. Kumala3, D. R. Worsnop4, and
A. Laaksonen1,5
1
Department of Physics, University of Kuopio, Kuopio 70211, Finland
2
Department of Environmental Sciences, University of Kuopio, Kuopio 70211, Finland
3
Department of Physics, P.O. Box 68, University of Helsinki, Helsinki 00014, Finland
4
Aerodyne Research, Inc., Billerica, MA, 08121-3976, USA
5
Finnish Meteorological Institute, Helsinki 00101, Finland
Received: 11 March 2009 – Accepted: 16 March 2009 – Published: 27 March 2009
Correspondence to: L. Q. Hao ([email protected])
ACPD
9, 8223–8260, 2009New particles from pine emissions
L. Q. Hao et al.
Title Page
Abstract Introduction
Conclusions References
Tables Figures
◭ ◮
◭ ◮
Back Close
Full Screen / Esc
Printer-friendly Version
Interactive Discussion
Abstract
Measurements of particle formation following the gas phase oxidation of volatile or-ganic compounds (VOCs) emitted by Scots pine (Pinus sylvestris L.) seedlings are reported. Particle nucleation and condensational growth both from ozone (O3) and hydroxyl radical (OH) initiated oxidation of pine emissions (about 20–120 ppb) were
in-5
vestigated in a smog chamber. During experiments, tetramethylethylene (TME) and 2-butanol were added to control the concentrations of O3and OH. Particle nucleation and condensational growth rates were interpreted with a chemical kinetics model. Scots pine emissions mainly included α-pinene, β-pinene, ∆3-carene, limonene, myrcene,
β-phellandrene and isoprene, composing more than 95% of total emissions.
Mod-10
eled OH concentration in the O3+OH induced experiments was at a level of ∼106 molecular cm−3. Our results demonstrate that OH-initiated oxidation of VOCs plays an important role in the nucleation process during the initial new particle formation stage. The highest average nucleation rate of 360 cm−3s−1 was observed for the OH-dominated nucleation events and the lowest aerosol mean formation rate less than
15
0.5 cm−3s−1 for the case with only O3 present as an oxidant. On the other hand, ozonolysis of monoterpenes appears to be much more efficient to the aerosol growth process following nucleation. Higher contributions of more oxygenated products to the SOA mass loadings from OH-dominating oxidation systems were found as compared to the ozonolysis systems. Comparison of mass and volume distributions from the
20
aerosol mass spectrometer and differential mobility analyzer yields estimated effective density of these SOA to be 1.34±0.06 g cm−3 with the OH plus O3 initiated oxidation
systems and 1.38±0.03 g cm−3with the ozonolysis dominated chemistry.
1 Introduction
On the worldwide basis, the annual biogenic VOCs flux is estimated to be in the range
25
re-ACPD
9, 8223–8260, 2009New particles from pine emissions
L. Q. Hao et al.
Title Page
Abstract Introduction
Conclusions References
Tables Figures
◭ ◮
◭ ◮
Back Close
Full Screen / Esc
Printer-friendly Version
Interactive Discussion
act with O3, OH and nitrate radical (NO3), leading to the formation of secondary organic aerosols (SOA). Globally, the annual SOA production from these biogenic precursors is estimated to range from 2.5 to 44.5 Tg C (Tsigaridis and Kanakidou, 2003), composing about 60% of the organic aerosol mass on the global scale and even higher fraction regionally (Kanakidou et al., 2005). SOA can directly affect the Earth’s radiation
bud-5
get by scattering and absorbing incoming solar radiation. Additionally, SOA can affect indirectly the radiation budget by modifying cloud properties through its potential con-tribution to the population of cloud condensation nuclei (CCN). SOA particles may also have adverse effects on human health through their inhalation. Understanding these effects requires a greater knowledge of the mechanisms inducing aerosol formation in
10
the atmosphere.
Monoterpenes and isoprene are important classes of globally emitted organic bio-genic species. Their oxidation leads to low volatile products (low saturation vapor pres-sure) which are believed to be able to nucleate once their saturation ratio increased sufficiently. Compounds with higher saturation pressure, known as semi-volatile
or-15
ganic compounds, will partition into the previously formed particle phase, contributing to the growth and mass loadings of atmospheric aerosols. Thus, the SOA formation from oxidation of monoterpenes (Hoffmann et al., 1997; Jang and Kamens, 1999; Gao et al., 2004; Shilling et al., 2008; Presto and Donahue, 2005; Odum et al., 1996; Yu et al., 1999) and isoprene (Ng et al., 2007; Kroll et al., 2006; Claeys et al., 2004) by OH,
20
O3 and NO3has been intensively studied in laboratory and field campaigns (e.g. Kul-mala et al., 2004; Laaksonen et al., 2008, etc.). These studies have demonstrated that atmospheric oxidation of monoterpenes and isoprene represents significant source of SOA. Despite the important advances that have been made in SOA studies, the SOA formation in the atmosphere is still poorly understood. For example, the roles OH and
25
ACPD
9, 8223–8260, 2009New particles from pine emissions
L. Q. Hao et al.
Title Page
Abstract Introduction
Conclusions References
Tables Figures
◭ ◮
◭ ◮
Back Close
Full Screen / Esc
Printer-friendly Version
Interactive Discussion
reported that OH initiated oxidation allows for nucleation. Moreover, in chamber stud-ies, only a single organic precursor was usually employed as a model compound to simulate the SOA formation in any given experiment. Since the mechanisms of SOA formation from oxidation of biogenic hydrocarbons are complex, it is uncertain into what degree the results from the single monoterpene chamber studies can be extrapolated
5
to the conditions prevailing in the real atmosphere (VanReken et al., 2006). Recent studies have started to address these types of questions. In these studies, aerosol formation events were simulated in more realistic conditions by using the direct bio-genic emissions of macroalgae (McFiggans et al., 2004), white cabbage (Joutsensaari et al., 2005; Pinto et al., 2007), oak and loblolly pine (VanReken et al., 2006) and
10
birch/pine/spruce emissions (Mentel et al., 2009). In some of these studies, new parti-cle formation efficiencies from OH- or O3-induced oxidation was also investigated.
In this study we concentrate on the aerosol particle nucleation in a laboratory using direct VOCs emissions of living Scots pine seedlings. Scots pine was selected be-cause it is one of the dominant tree species in the European boreal forest (R ¨ais ¨anen
15
et al., 2008). Both O3 and OH were used as oxidants in the controlled conditions in these experiments. Our motivation is to evaluate the roles that these oxidants play in the formation of new particles and in the subsequent condensational growth. We also determine aerosol chemical compositions and densities. By using actual pine seedlings as source of VOCs, we are able to get realistic and important information on
20
what process are dominant in atmospheric aerosol formation.
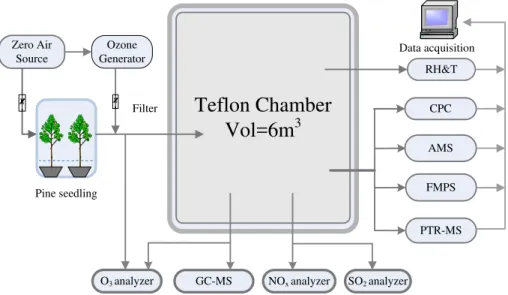
2 Experimental description
The major components of the experimental system consisted of a biogenic emission enclosure, reaction chamber and both gas phase and aerosol particle sampling sys-tems. A block diagram of this system is shown in Fig. 1 and the overall system
compo-25
ACPD
9, 8223–8260, 2009New particles from pine emissions
L. Q. Hao et al.
Title Page
Abstract Introduction
Conclusions References
Tables Figures
◭ ◮
◭ ◮
Back Close
Full Screen / Esc
Printer-friendly Version
Interactive Discussion
2.1 Plant materials
Scots pine seedlings (1 year-old) were obtained from a forest nursery (Finnish Forest Research Institute, Suonenjoki Research Unit, Suonenjoki, Finland) in May and planted in 7.5 l plastic pots in 2:1 (v/v) quartz sand (Ø 0.5–1.2 mm, SP Minerals Partek, Finland) and fertilized sphagnum peat (Kekkil ¨a PP6, Finland). After planting, seedlings were
5
growing in the open field site (Research Garden, University of Kuopio) until the end of July. Then the seedlings were taken in a greenhouse to avoid onset of winter dormancy. In October, prior to the experiments, the seedlings were kept in growth chambers (see Vuorinen et al., 2004 for more detail) in temperature conditions of+22◦C. To simulate herbivore attack on tree bark and to activate the chemical defense of seedlings, 3 cm
10
long and 2 mm deep cuts were made on the base of main stem by a knife. After these preparations, two seedlings were selected as the trial plants and placed carefully in two individual transparent NeoflonTM FEP bags. These bags served as manifolds through which air passed in and out of the enclosure to take the pine emissions. Six lamps (Lival Shuttle Plus, Lival Oy, Sipoo, Finland, 24W, PAR ca. 350 µmol m−2s−1) were
15
utilized to ensure the optimal photosynthesis activity and VOC emissions.
2.2 Reaction chamber experiments
The reaction chamber for this study is a 6 m3rectangular chamber made of Neoflon™ FEP film, which is attached to a stainless steel frame. The height of the chamber is 2.5 m with the bottom area of 1.0×2.4 m2. Prior to every experiment, the chamber
20
was continuously flushed by laboratory compressed clean air for overnight. The com-pressed air was processed through activated charcoal, Purafil™ select and absolute HEPA filter, to get rid of hydrocarbons, NOxand particles.
Prior to experiments, clean air flow took the pine emissions into the chamber through Teflon lines until the desired concentration of terpenes was achieved. In some
experi-25
ACPD
9, 8223–8260, 2009New particles from pine emissions
L. Q. Hao et al.
Title Page
Abstract Introduction
Conclusions References
Tables Figures
◭ ◮
◭ ◮
Back Close
Full Screen / Esc
Printer-friendly Version
Interactive Discussion
chamber. TME was used to produce hydroxyl radical (OH) radical. It was chosen be-cause TME ozonolysis requires neither NOx nor UV photolysis, and it can result in an OH yield near unity (Lambe et al., 2007; Paulson et al., 1997). In one group of the experiments, 2-butanol, used as OH scavenger, was introduced into the chamber in a similar manner as TME. The concentration of 2-butanol injected was approximately
5
600-fold higher than terpenes so that the reaction rate of OH with scavenger exceeded that of OH with parent hydrocarbons by a factor of 100 (Keywood et al., 2004; Docherty et al., 2003; Ziemann et al., 2003). Major products of OH-butanol reaction are 2-butanone (with yield of 69% at room temperature) and acetone (with yield range from 12–29%) (Aschmann et al., 2002; Jim ´enez et al., 2005), which have high vapor
pres-10
sures suggesting that they are too volatile to partition into the particle phase. After injections of above reactants, ozone was generated by a UV lamp O3 generator. The air flow (40 L min−1) enriched with ozone (60–800 ppb) at the inlet of the chamber was added. Ozone and TME were kept separated until inside the chamber because of the short lifetime of OH radical. The beginning of first ozone injection marks the start
15
of each experiment. In all experiments, temperature was controlled in the range of 25±2◦C and relative humidity (RH) in 35
±5%. No seed aerosols were added and the chamber was kept dark with a black polyethylene covering.
2.3 Analysis methods and instrumentation
Nitric oxide (NO), total NOx and SO2 concentration inside the chamber were
mea-20
sured with an AC 30M NOx analyzer and AF21M SO2 analyzer (Environment s.a.), respectively. O3 concentration was monitored at the inlet and inside the chamber by two DASIBI 1008-RS O3 analyzers (Dasibi Environmental Corporation, Glendele, CA, USA). Temperature and RH were measured continuously using a RH and temperature transmitter (Vaisala Humitter Y50). In all the experiments, SO2concentration was lower
25
than the detectable limit of analyzer (∼1 ppb). The low level of SO2concentration would
ACPD
9, 8223–8260, 2009New particles from pine emissions
L. Q. Hao et al.
Title Page
Abstract Introduction
Conclusions References
Tables Figures
◭ ◮
◭ ◮
Back Close
Full Screen / Esc
Printer-friendly Version
Interactive Discussion
chromatography-mass spectrometer (GC-MS, Hewlett-Packard GC model 6890, MSD 5973) for off-line analysis and a proton transfer reaction mass spectrometer (PTR-MS, Ionicon Analytik GmbH) for on-line analysis. VOCs were sampled on about 150 mg Tenax TAadsorbent (Supelco, mesh 60/80) for 15 or 30 min.Then the collected VOCs were analyzed with GC-MS run by temperature-controlled analysis program.
Identifi-5
cation of the compounds was based on the molecular retention time and comparison of mass spectra with those of pure standards. The analysis method used here has been described in detail elsewhere (Pinto et al., 2007; Joutsensaari et al., 2005; Vuori-nen et al., 2004). PTR-MS was used to monitor concentrations of selected parent hydrocarbons and various gas-phase intermediates and products continuously over
10
the course of experiments. A detailed description of PTR-MS technique is given by Lindinger et al. (1998) and De Gouw and Warneke (2007). The calibration procedure and mixing ratio calculations were described in Taipale et al. (2008). During every ex-periment full scan mode was used to see if there were important compounds other than the selected ones that were measured continuously. Ions were monitored with
mass-15
to-charge (m/z) consistent with formaldehyde (m/z=30+1), methanol (32+1), acetone (m/z=58+1), isoprene (m/z=68+1), TME (m/z=84+1), monoterpenes (m/z=136+1) and sesquiterpenes (m/z=204+1).
Aerosol chemical composition and mass size distributions were measured by an Aerodyne Aerosol Mass Spectrometer (AMS). Detailed descriptions of the AMS
mea-20
surements principles and various calibrations, its operation mode and data processing methods can be found in other publications (Jayne et al., 2000; Allan et al., 2003, 2004; Jimenze et al., 2003a, 2003b; Zhang et al., 2004). Briefly, the AMS uses an aerodynamic lens to focus particles into a tight beam that is introduced into a high vacuum tube (10−8Torr). Particles are detected as they impact on a porous tungsten
25
ACPD
9, 8223–8260, 2009New particles from pine emissions
L. Q. Hao et al.
Title Page
Abstract Introduction
Conclusions References
Tables Figures
◭ ◮
◭ ◮
Back Close
Full Screen / Esc
Printer-friendly Version
Interactive Discussion
particle flight of time. MS spectrum is achieved by the difference of background signal and total signal.
Aerosol particle size distributions over a ranger of 5.6–560 nm were measured us-ing a fast mobility particle sizer spectrometer (FMPS, TSI model 3091). FMPS was operated with aerosol and sheath flows of 10 and 40 Lmin−1. The high measurement
5
resolution (sampling in 1 s resolution and averaged in 5 min resolution in this study) enables us to visualize particle size distributions during nucleation events.
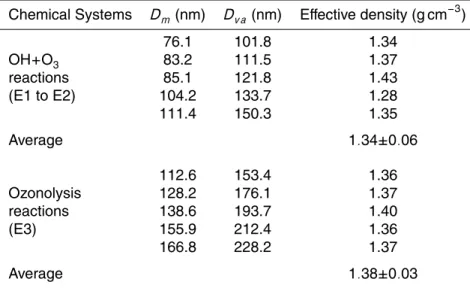
2.4 Effective density
AMS measures the vacuum aerodynamic diameter (Dv a), defined as the diameter of a standard density (ρ0) sphere with the same terminal velocity as the interested
parti-10
cle in a free-molecular regime. FMPS instead provides a measurement of the mobility diameter (Dm), known as the diameter of a sphere with the identical migration velocity of particle in a constant electric field in the atmospheric pressure. The effective density of particle,ρeff, is simply defined as ratio of the vacuum aerodynamic and mobility di-ameter multiplied by unit density (Jimenez et al., 2003b; DeCarlo et al., 2004; Bahreini
15
et al., 2005).
ρeff=ρ0Dv a Dm =ρp
Dv e
Xv eDm (1)
whereρpis the material density andρ0is the unit density (1 g cm−3). Dv eis the diame-ter of a spherical particle having the same volume as the particle under consideration.
Xνeis the dynamic shape factor in the free-molecular regime.
20
For spherical particles, the effective density is equivalent to the particle density, while the effective density can be significantly different for particle with an irregular shape. Note that various definitions of effective density are used in the literature. These def-initions do not yield the same numerical values for irregular particles (DeCarlo et al., 2004). In this study, a series of mobility diameters measured by FMPS was compared
ACPD
9, 8223–8260, 2009New particles from pine emissions
L. Q. Hao et al.
Title Page
Abstract Introduction
Conclusions References
Tables Figures
◭ ◮
◭ ◮
Back Close
Full Screen / Esc
Printer-friendly Version
Interactive Discussion
to their corresponding vacuum aerodynamic diameters measured by AMS in parallel in order to determine the densities of SOA particles.
2.5 Modeling of VOC oxidation
Since new particle formation is initiated by the gas-phase oxidation of VOCs, a kinetic model of VOCs from the oxidation of O3and OH was built to interpret the new particle
5
nucleation and growth events. In this model, the oxidation of VOCs was calculated using the initial measured concentrations of VOCs and known reaction rates. O3 and OH are assumed to be involved in the oxidation reactions of VOCs and TME, taking into account the secondary loss process of OH and O3. In brief, O3and OH initiated oxidation of these VOCs produce condensing and nucleating species, OH radicals and
10
other volatile compounds.
VOCi +O3
kVOCi O3
−→ OH radical+volatile+semivolatile+nonvolatile species, (2)
VOCi +OHk
VOCi
OH
−→ volatile+semivolatile+nonvolatile species. (3)
Once TME is added into the experimental systems, ozonolysis of TME leads to the production of OH radical
15
TME+O3k
TME O3
−→OH+other products. (4)
So, the formation rate of OH radical (fOH) can be calculated using the following equi-tation
fOH=ωikTME
O3 [TME][O3]+ X
i
ω′
ik VOCi
O3 [VOC]i[O3], (5)
where ωi, ω′i denote the yields of hydroxyl radicals from the O3 reactions, and k is
20
ACPD
9, 8223–8260, 2009New particles from pine emissions
L. Q. Hao et al.
Title Page
Abstract Introduction
Conclusions References
Tables Figures
◭ ◮
◭ ◮
Back Close
Full Screen / Esc
Printer-friendly Version
Interactive Discussion
Thus there is a competition in reactions of O3 with TME and monoterpenes during the initial stage of reaction. The average consumption rate of O3can be expressed as
d[O3] dt =
d[O3]inlet dt −γik
TME
O3 [TME][O3]− X
i
γ′
ik VOCi
O3 [VOC]i[O3], (6)
whereγi and γi′ are the correction factors to take into account the secondary loss of ozone with the second-generation products. These correction factors were estimated
5
according to the VOC molecular structures and the complexities of their reactions with O3and OH and further confirmed by a model sensitivity test.
Due to the high reaction rate of OH+TME, the added TME also resulted in OH loss
TME+OHk
TME OH
−→products. (7)
Reactions (2–5,7) give the time-dependent OH concentration as
10
d[OH]
dt =fOH−γ
′′
i k TME
OH [TME][OH]− X
i
γ′′′
i k VOCi
OH [VOC]i[OH], (8)
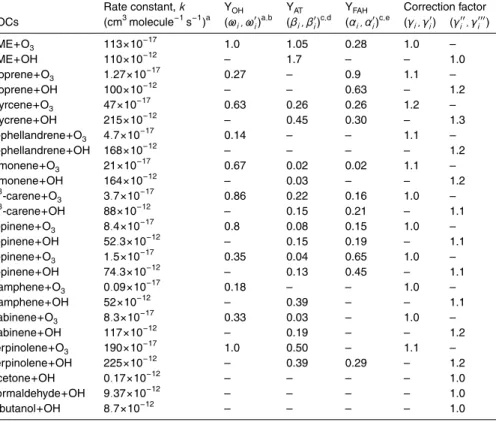
whereγi′′ and γi′′′ are the correction factors to take into account the secondary loss of OH with the second-generation products. All the parameters used in the model are listed in Table 1.
Products from the O3- plus OH-initiated TME oxidation are formaldehyde, methanol
15
and acetone and some minor compounds (Niki et al., 1987; Tuazon et al., 1997; Tuazon et al., 1998). The vapor pressures of these species are too high to take part into aerosol nucleation and growth processes and so are omitted from the model. Berndt et al. (2004) have also shown that ozonolysis of TME in the absence of SO2leads to no observable new particle formation. Thus, in this paper, O3 and OH oxidation rates
20
(excluding the contributions from TME) with VOCs are defined as
rO
3 = X
i
kVOCi
ACPD
9, 8223–8260, 2009New particles from pine emissions
L. Q. Hao et al.
Title Page
Abstract Introduction
Conclusions References
Tables Figures
◭ ◮
◭ ◮
Back Close
Full Screen / Esc
Printer-friendly Version
Interactive Discussion
rOH=X
i
kVOCi
OH [VOC]i[OH]. (10)
New particle formation rate (F) and growth rate (G) can be constrained directly by the oxidation rates of VOCs
F ∼rO
3+rOH, (11)
G∼rO
3+rOH. (12)
5
Similarly, for the loss of other compounds and formation of products, chemical kinetics can be described using the following rate equations
d[VOC]i dt =−
X
i
kVOCi
O3 [VOC]i[O3]− X
i
kVOCi
OH [VOC]i[OH], (13)
d[TME] dt =−k
TME
O3 [TME][O3]−k TME
OH [TME][OH], (14)
d[AT] dt =
X
i
βikVOCi
O3 [VOC]i[O3]+ X
i
β′
ik VOCi
OH [VOC]i[OH]−k AT
OH[AT][OH], (15) 10
d[FAH] dt =
X
i
αikVOCi
O3 [VOC]i[O3]+ X
i
α′
ik VOCi
OH [VOC]i[OH]−k FAH
OH [FAH][OH], (16)
whereβi, βi′ are the yields of acetone (AT) from reactions of O3 and OH with VOCs and TME andαi, αi′are for the formaldehyde (FAH) yield.
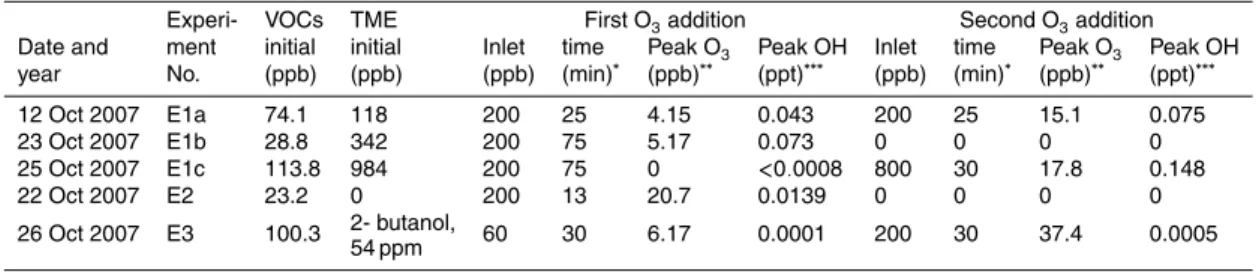
2.6 Summary of experiments performed
Five experiments were carried out in the present study. The initial conditions are
sum-15
ACPD
9, 8223–8260, 2009New particles from pine emissions
L. Q. Hao et al.
Title Page
Abstract Introduction
Conclusions References
Tables Figures
◭ ◮
◭ ◮
Back Close
Full Screen / Esc
Printer-friendly Version
Interactive Discussion
3 Results and discussion
3.1 Scots pine emissions
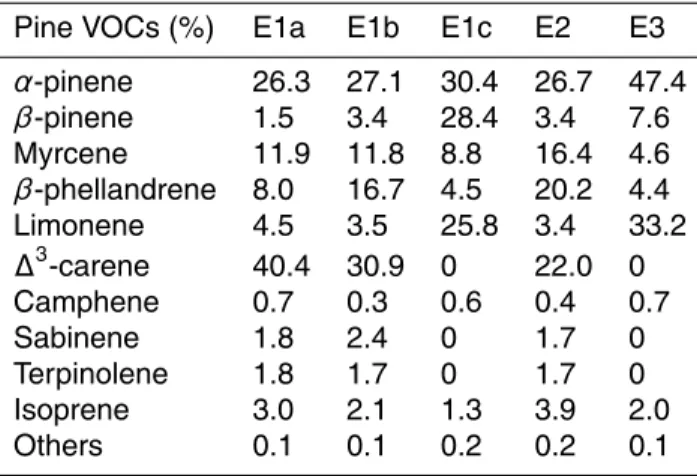
The emitted VOCs from the Scots pine seedlings included monoterpenes, iso-prene and minor amounts of other small molecular compounds, e.g. methanol, with monoterepenes dominating the total emissions in this work. Monoterpenes included
5
α-pinene, β-pinene, ∆3-carene, β-phellandrene, limonene and myrcene, making up more than 95% of the total VOC emissions as tabulated in Table 3. In E1c and E3, there was no detectable∆3-carene and very high contribution ofβ-pinene to total VOC emissions was observed in E1c. The variability in contributions of emission species in every case, specially dominated by α-pinene, limonene and ∆3-carene, might be
10
due to the emission rates of monoterpenes that were sensitive to the ambient envi-ronmental conditions (R ¨ais ¨anen et al., 2008; Tarvainen et al., 2005), but also strongly dependent on the frequency of∆3-carene-rich genotype (Manninen et al., 1998). Field results in Finnish forest have demonstrated the dependence of monoterpene emission rates on environmental temperature and light intensity (R ¨ais ¨anen et al., 2008;
Tar-15
vainen et al., 2005). In all cases, sesquiterpenes in the emitted compounds were lower than 0.05 ppb as determined with PTR-MS measurements. This is consistent with ob-servations in Hyyti ¨all ¨a forest of Finland that sesquiterpene emissions from Scots pine are only 2–5% of the total monoterpene emission rates and emission, with emissions ceasing in September (Tarvainen et al., 2005).
20
According to the measurements made in two locations in Finland, the major emit-ted compounds from Scots pine areα-pinene,β-pinene and∆3-carene, with approx-imate contributions of 60–85% to the total observed monoterpene emission rates, al-though late in the autumnsβ-phellandrene can make 20% of total monoterpene emis-sion (R ¨ais ¨anen et al., 2008). Lindfors and Laurila (2000) estimated that total biogenic
25
ACPD
9, 8223–8260, 2009New particles from pine emissions
L. Q. Hao et al.
Title Page
Abstract Introduction
Conclusions References
Tables Figures
◭ ◮
◭ ◮
Back Close
Full Screen / Esc
Printer-friendly Version
Interactive Discussion
US the main biogenic monoterpene emissions areα-pinene,β-pinene, and limonene (Sakulyanontvittaya et al., 2008). Thus the emission spectrum in this study is very con-sistent with natural Scots pine and the monoterpene distributions in Europe and USA, making this work more representative of the atmospheric reaction conditions than pure VOCs or mixtures of pure VOCs commonly used in chamber experiments.
5
3.2 Formation of new particles
3.2.1 Reaction of emitted VOCs
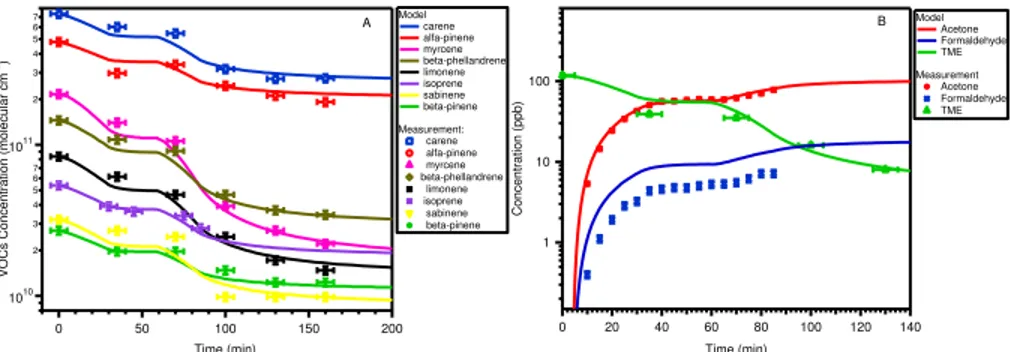
Figure 2 shows the decay profiles of ten kinds of VOCs as tabulated in Table 3 (panel A) and formation curves of gas-phase product of acetone and formaldehyde as functions of time (panel B) in experiment E1a. The modelled concentrations were calculated
10
based on the OH and O3induced chemistry of these VOCs as described in Sect. 2.5. Possbile formation sources of acetone and formaldehyde include O3and OH induced chemisty of TME and emitted VOCs as shown in Eqs. (15) and (16). Degraded products of these ten VOCs will contribute to new particle formation and will be described in following sections. Good agreement between modelled and modeled VOC and product
15
concentrations provides further confirmation to the validity of the model used in this study.
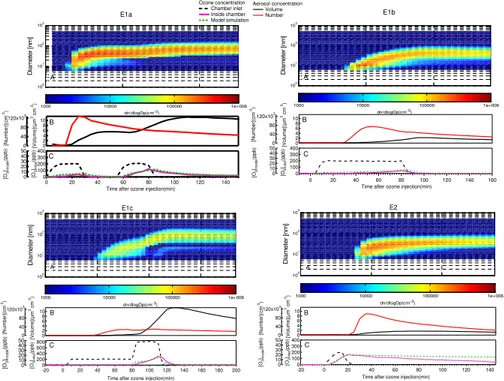
3.2.2 New particle from OH+O3induced chemistry
As the emissions of pine seedlings were oxidized by O3 and OH, various products of different volatility were formed. Homogeneous nucleation occurs when the
non-20
volatile products exceeded their saturation vapor pressure sufficiently. Later on, the semi-volatile species begin condensing on the surface of the pre-formed particle, caus-ing an increase in particle size and aerosol volume concentration. The contour plots of aerosol particle number size distributions, total number/volume concentrations and gas-phase species concentration are illustrated in Fig. 3. In these systems, OH
ACPD
9, 8223–8260, 2009New particles from pine emissions
L. Q. Hao et al.
Title Page
Abstract Introduction
Conclusions References
Tables Figures
◭ ◮
◭ ◮
Back Close
Full Screen / Esc
Printer-friendly Version
Interactive Discussion
cals are produced not only in the course of ozonolysis of TME but also in the ozonolysis of monoterpenes. Both the OH- and O3-initiated oxidation of monoterpenes might con-tribute to the new particle formation. At high concentration of TME, ozonolysis of TME was expected to produce high amount of OH radicals based on Eq. (4). It can be seen that a rapid increase in the particle number concentration occurred and obvious
nu-5
cleation events took place after the first addition of ozone in all cases. However, the maximum number concentration was 27 700 particle cm−3in the highest TME experi-ment (E1c), which was much lower than the 128 000 particle cm−3 in the lowest TME case (E1a). In experiments with two ozone additions, the second ozone injection in-duced very weak increase of aerosol number concentrations, but an intensive increase
10
in aerosol volume concentrations.
3.2.3 New particles from ozonolysis reaction
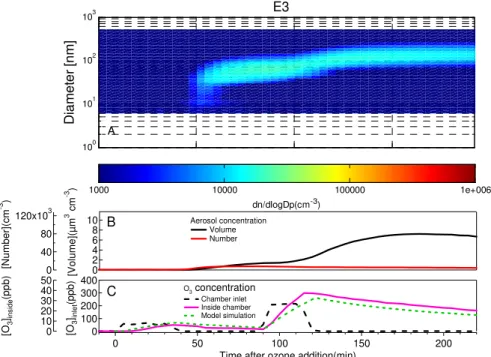
In experiment E3, 2-butanol was added into the chamber to remove the OH in the gas phase. 2-butanol is known to scavenge efficiently the OH radicals and our goal was to ensure that only ozonolysis reactions occur in the system. Figure 4 shows
15
the particle profiles of the ozonolysis experiments. Only a very weak nucleation event was observed in this experiment. The maximum number concentration was only 8120 particle cm−3, being much lower than that was found during OH/O
3initiated cases. On
the other hand, a relatively high increase rate in aerosol volume was observed.
3.2.4 Nucleation and growth rates
20
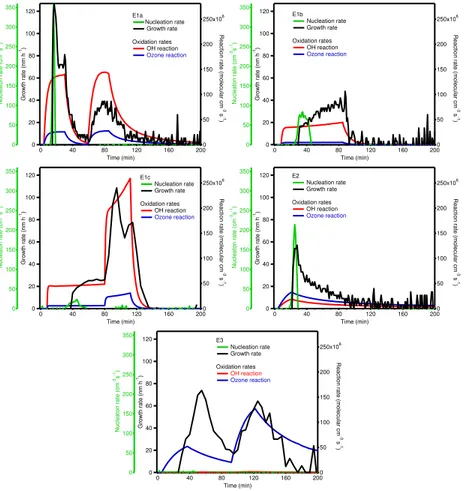
The experiments described here emphasize the variability in new particle formation from initiation by different oxidation sources. The roles of OH- and O3- induced ox-idation in the new particle formation can be interpreted using the chemistry model results. The correlations of instantaneous nucleation and condensational growth rates with the oxidation reaction rates of monoterpenes with OH and O3are shown in Fig. 5.
25
ACPD
9, 8223–8260, 2009New particles from pine emissions
L. Q. Hao et al.
Title Page
Abstract Introduction
Conclusions References
Tables Figures
◭ ◮
◭ ◮
Back Close
Full Screen / Esc
Printer-friendly Version
Interactive Discussion
than 60 min after the beginning of experiment) and growth continued as long as there was VOCs and O3 available. In E1a, very fast aerosol nucleation, with rate as high as 360 cm−3s−1, was observed, consistent with the rapid OH oxidation rates calcu-lated with the model. And in the pure ozonolysis experiment (E3, with OH scavenger present), nucleation rate was very low (<0.5 cm−3s−1), despite the very fast O
3 ox-5
idation rate. These results indicate that OH-initiated oxidation reactions play a very important role in the aerosol nucleation stages and ozonolysis of monoterpenes are less effectively involved in the aerosol nucleation process under these experimental conditions.
As can be seen from Fig. 5, the modeled OH and O3reaction rates also show good
10
correlations with the condensational growth rates in E1–E3 experiments, suggesting that OH and O3 reactions both play roles in particle growth process. Furthermore, in E3, the highest aerosol growth rate of 74 nm h−1was achieved where the OH reaction rate was slow, suggesting that the ozonolysis of VOCs is more efficient for aerosol growth.
15
Nucleation rates were found to be lower even under cases of high OH reaction rates (e.g. E1c and E2). It might be due to the emission spectrum distributions in each exper-iment. The nucleation potential of one biogenic compound depends on the combination of its abundance and its efficiency for nucleation. VanReken et al. (2006) reported that the presence ofβ-pinene probably inhibited particle formation in the Holm oak
(Quer-20
cus ilex) experiment. The high contributions of β-pinene to the total VOC mix might thus lead to the lower nucleation rate in E1c.
Nucleation and growth from the oxidation of monoterpenes by OH and O3has been studied over the past ten years (Bonn and Moortgat, 2002; Burkholder et al., 2007; Hoppel et al., 2001; Griffin et al., 1999; Mentel et al., 2009). Most studies were
25
ACPD
9, 8223–8260, 2009New particles from pine emissions
L. Q. Hao et al.
Title Page
Abstract Introduction
Conclusions References
Tables Figures
◭ ◮
◭ ◮
Back Close
Full Screen / Esc
Printer-friendly Version
Interactive Discussion
a 0.57 m3 spherical glass vessel. By comparisons of the aerosol number and volume concentrations in different cases, they reported that ozonolysis of monoterpenes was much more efficient for nucleation than what was the observed for OH-initiated case. This contradicts our results in which ozonolysis is less effective in nucleation process. Our results are consistent with the results of Burkholder et al. (2007), which find that
5
monoterpene ozonolysis alone (with no OH radical reaction) cannot yield significant particle formation. However, ozonolysis does contribute to particle growth. The re-sults of this study are strong agreement with recent work showing that for the oxidation of pine emissions, ozonolysis does not induce particle formation and OH radicals are essential for the new particle formation (Mentel et al., 2009).
10
3.3 Chemical signatures
Chemical signatures of the newly formed aerosols during the above experiments were investigated utilizing the AMS. Figure 6 displays the average mass spectra of SOA for the first hour and second hour for each experiment. All spectra were normalized to total mass signal. We can see that most of the spectra were characterized by some intense
15
mass fragments atm/z27, 29, 41, 43, 44, 51, 55, 65, 77 and 141. Mass Fragments 27, 29, 41, 43 and 55 represented the ion series of CnH+2n−1and CnH+2n+1and separated by 14 mass units due to loss of CH2, which can indicate the presence of heavily saturated and non-oxidized hydrocarbon-like organic species (Alfarra et al., 2006; Allan et al., 2006). Another potential contribution to mass 43 is an oxygen-containing fragment,
20
CH3CO+. Fragment 44 corresponds to CO+2, which represents highly oxidized classes of compounds containing carbonyl and carboxylic acid functional groups (Alfarra et al., 2006). Peaks at mass 51, 77 and 141 may be from the ozonolysis reaction of VOCs but their identifications are unclear at present.
In the TME experiments (E1b and E1c), mass spectra were dominated by mass
frag-25
ACPD
9, 8223–8260, 2009New particles from pine emissions
L. Q. Hao et al.
Title Page
Abstract Introduction
Conclusions References
Tables Figures
◭ ◮
◭ ◮
Back Close
Full Screen / Esc
Printer-friendly Version
Interactive Discussion
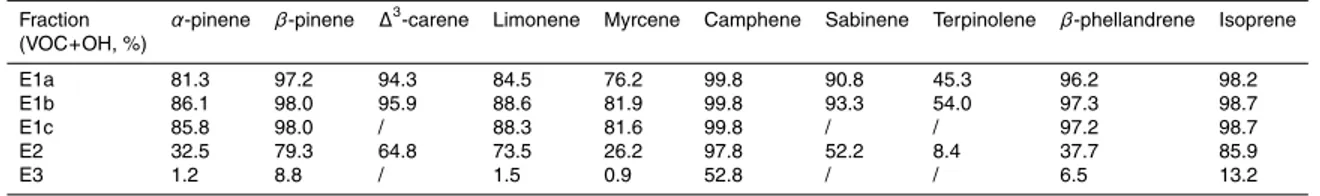
Fig. 6), no fractional contribution bym/z 44 signals was found in the first hour. This in-dicates OH plays a key role in forming species which fragment to givem/z 44 species. The importance of OH reaction for each VOC (as a percentage of total reaction) dur-ing new particle formation is presented in Table 4. Values were calculated from the following equation:
5
fraction=
Rt
0ri ,OH(t)dt Rt
0ri ,OH(t)dt+ Rt
0ri ,O3(t)dt
, (17)
whereri ,OH(t) and ri ,O
3(t) were the reaction rates of VOCi with OH and O3 at time t
(min), respectively.
In all the OH-dominated experiments (E1a–1c), all VOCs but terpinolene reacted primarily (>75%) with OH rather than O3. For E2, both O3- and OH-initiated
oxida-10
tion were important, with the fraction of OH reaction varying from 8.4% (terpinolene) to 97.8% (myrcene). And in ozonolysis case (E3), ozonolysis dominated for all VOCs except camphene. The relative importance of OH reactions in all experiments corre-sponds well to the mass fraction ofm/z 44 ions, strongly suggesting that OH-initiated oxidation leads to the formation of highly oxidized aerosol species. On the other hand,
15
the very high contribution of m/z 43 signal to the mass loadings in E3 suggests that ozonolysis reaction might contribute more to the less oxidized products.
Averaged mass spectra appeared to have highly similar fragmentation patterns dur-ing the second hour, implydur-ing the products formed have broadly similar chemical func-tionality in these experiments. These similarities in the mass spectra were further
20
confirmed in longer reaction time (not shown in Fig. 6), suggesting that once particles were formed, the chemical signature detected by AMS did no change significantly un-der these experimental conditions. However, significant difference for the minor mass fragments occurred, suggesting that the SOA particles might have different chemical compositions.
25
ACPD
9, 8223–8260, 2009New particles from pine emissions
L. Q. Hao et al.
Title Page
Abstract Introduction
Conclusions References
Tables Figures
◭ ◮
◭ ◮
Back Close
Full Screen / Esc
Printer-friendly Version
Interactive Discussion
following a nucleation event exhibited the signals atm/z 27, 29, 41, 43, 44, 51, 55, 57, 77, 91 and 141 (Alfarra et al., 2006; Allan et al., 2006; Salcedo et al., 2006). The similarities in our measurements and the ambient mass spectra indicate that the ex-perimental results are able to reproduce the products distributions of SOA formed in the real atmosphere.
5
3.4 Effective density (ED)
Effective density of SOA particle was calculated followed the approach outlined in Sect. 2.4. In this method, the mobility and vacuum aerodynamic diameters were iden-tified from the peak values by using a log-normal fitting to volume/mass size distribu-tions. Table 5 lists parts of selected particle mobility diameters, the measured
aero-10
dynamic diameters and the corresponding effective density after the initial growth of particles.
The determined effective density from the OH and O3 oxidation induced SOA was 1.34±0.06 g cm−3, nearly identical to the value of 1.38±0.03 g cm−3 of particles from the ozonolysis reaction systems. The results show that the effective density for both
15
types of SOA is not substantially impacted by the initiating oxidants. The density is also found to be independent of the particle size within the accumulation mode. However the effective density showed a dependence on the particle size with Aitken mode in this work and these results need further confirmation. Our reported aerosol densities are in agreement with measured densities of 1.25±0.15 g cm−3of SOAs from real pine
20
emissions (Mentel et al., 2009). These results are also consistent with density mea-surements of 1.2–1.7 g cm−3 for ambient aerosol and laboratory-generated monoter-pene SOA (Shilling et al., 2009; Saathoffet al., 2008; Bahreini et al., 2005; Alfarra et al., 2006; Kostenidou et al., 2007; Kannosto et al., 2008).
Accurate measurements of density are very important to convert the aerosol volume
25
ACPD
9, 8223–8260, 2009New particles from pine emissions
L. Q. Hao et al.
Title Page
Abstract Introduction
Conclusions References
Tables Figures
◭ ◮
◭ ◮
Back Close
Full Screen / Esc
Printer-friendly Version
Interactive Discussion
to be spherical. In their experiments, effective densities were equivalent to the material densities. However, SOA particles are reported to be in solid or waxy phase with densities larger 1.25 g cm−3from the ozonolysis of biogenic emissions (Kostenidou et
al., 2007). Irregular shapes of the solid or waxy aerosol make the effective density lower than the real material density. In this study, our aerosol might be in nonspherical
5
shapes and our ongoing biogenic SOA experiments are investigating this possibility. This will be further discussed in future work.
4 Conclusions
We have studied freshly formed aerosols following the gas phase oxidation of the di-rect emissions of Scots pine (Pinus sylvestris L.) seedlings in a smog chamber. New
10
particle formation following the ozonolysis and O3plus OH initiated oxidation was mea-sured. 2-butanol and TME were used to control the ratios of O3and OH concentrations. Emitted species, aerosol nucleation and condensational growth events, chemical com-positions and density of the new formed particles are measured and investigated in this study.
15
Major emitted VOCs from Scot pine included monoterpenes and isoprene. Ozone plus OH initiated oxidation of these VOCs produced large amounts of new particles. For new aerosol formation, OH-initiated oxidation plays a critical role in a nucleation during the initial stage of new particle formation. Ozonolysis seems to be more efficiently involved in the particle condensational growth, but it does not contribute substantially
20
to nucleation. These results demonstrate that OH oxidation of VOCs could be a source of the new organic particles in the atmosphere.
Mass spectral results show that highly oxidized compounds (m/z 44 signals) con-tribute more to SOA formed from OH radical initiated oxidation of emitted VOCs during the initial stage of nucleation events. Ozonolysis of emitted VOCs produces SOA which
25
indicat-ACPD
9, 8223–8260, 2009New particles from pine emissions
L. Q. Hao et al.
Title Page
Abstract Introduction
Conclusions References
Tables Figures
◭ ◮
◭ ◮
Back Close
Full Screen / Esc
Printer-friendly Version
Interactive Discussion
ing the SOA produced have broadly similar chemical functionality.
From AMS and FMPS data it was determined that the aerosol effective densities are almost identical in these two oxidation systems, implying that the products formed by the different oxidants have roughly similar densities.
The experiments carried out here were designed to match atmospheric conditions
5
as closely as possible, so that the present results may be applicable to new particle formation and growth in the atmosphere, particularly in pristine forested environments. The oxidants (O3 and OH) and organics (monoterpenes) studied are among the most important in the troposphere; concentrations of OH and monoterpenes approached tropospheric levels; and the organics included an atmospherically relevant mixture of
10
monoterpenes (direct vegetation emissions).
Acknowledgements. This work was funded by the Academy of Finland (decision no. 120802,
111543, 123466 and Centre of Excellence Programme). We thank the staff at the Kuopio University Research Garden for maintaining the plants.
References
15
Alfarra, M. R., Paulsen, D., Gysel, M., Garforth, A. A., Dommen, J., Pr ´ev ˆot, A. S. H., Worsnop, D. R., Baltensperger, U., and Coe, H.: A mass spectrometric study of secondary organic aerosols formed from the photooxidation of anthropogenic and biogenic precursors in a re-action chamber, Atmos. Chem. Phys., 6, 5279–5293, 2006,
http://www.atmos-chem-phys.net/6/5279/2006/.
20
Allan, J. D., Alfarra, M. R., Bower, K. N., Coe, H., Jayne, J. T., Worsnop, D. R., Aalto, P. P., Kulmala, M., Hy ¨otyl ¨ainen, T., Cavalli, F., and Laaksonen, A.: Size and composition measure-ments of background aerosol and new particle growth in a Finnish forest during QUEST 2 using an Aerodyne Aerosol Mass Spectrometer, Atmos. Chem. Phys., 6, 315–327, 2006, http://www.atmos-chem-phys.net/6/315/2006/.
25
ACPD
9, 8223–8260, 2009New particles from pine emissions
L. Q. Hao et al.
Title Page
Abstract Introduction
Conclusions References
Tables Figures
◭ ◮
◭ ◮
Back Close
Full Screen / Esc
Printer-friendly Version
Interactive Discussion
A generated method for the extraction of chemically resolved mass spectra from aerodyne aerosol mass spectrometer data, J. Aerosol Sci., 35, 902–922, 2004.
Allan, J. D., Jimenez, J. L., Williams, P. I., Alfarra, M. R., Bower, K. N., Jayne, J. T., Coe, H., and Worsnop, D. R.: Quantitative sampling using an aerodyne aerosol mass spectrom-eter 1. Techniques of data interpretation and error analysis, J. Geophys. Res., 108, 4090,
5
doi:10.1029/2002JD002358, 2003.
Aschmann, S. M., Arey, J., and Atkinson, R.: OH radical formation from the gas-phase reactions of O3with a series of terpenes, Atmos. Environ., 36, 4347–4355, 2002.
Atkinson, R. and Arey, J.: Atmospheric degradation of volatile organic compounds, Chem. Rev., 103, 4605–4638, 2003a.
10
Atkinson, R. and Arey, J.: Gas-phase tropospheric chemistry of biogenic volatile organic com-pounds: a review, Atmos. Environ., 37, S197–S219, 2003b.
Bahreini, R., Keywood, M. D., Ng, N. L., Varutbangkul, V., Gao, S., Flagan, R. C., Seinfeld, J. H., Worsnop, D. R., and Jimenez, J. L.: Measurements of secondary organic aerosol from oxida-tion cycloalkenes, terpenes, and m-Xylene using an aerodyne aerosol mass spectrometer,
15
Environ. Sci. Technol., 39, 5674–5688, 2005.
Berndt, T., B ¨oge, O., and Stratmann, F.: Atmospheric particle formation from the ozonolysis of alkenes in the presence of SO2, Atmos. Environ., 38, 2145–2153, 2004.
Bonn, B. and Moortgat, G. T.: New particle formation duringα- andβ-pinene oxidation by O3,
OH and NO3, and the influence of water vapour: particle size distribution studies, Atmos.
20
Chem. Phys., 2, 183–196, 2002,
http://www.atmos-chem-phys.net/2/183/2002/.
Burkholder, J. B., Baynard, T., Ravishankara, A. R., and Lovejoy, E. R.: Particle nucleation following the O3 and OH initiated oxidation of α-pinene and β-pinene between 278 and
320 K, J. Geophys. Res., 112, D10216, doi:10.1029/2006JD007783, 2007.
25
Claeys, M., Graham, B., Vas, G., Wang, W., Vermeylen, R., Pashynska, V., Cafmeyer, J., Guyon, P.,Andreae, M. O., Artaxo, P., and Maenhaut, W.: Formation of secondary organic aerosols through photooxidation of isoprene, Science, 303, 1173–1176, 2004.
DeCarlo, P. F., Slowik, J. G., Worsnop, D. R., Davidovits, P., and Jimenez, J. L.: Particle mor-phology and density characterization by combined mobility and aerodynamic diameter
mea-30
surements. Part 1: Theory, Aerosol Sci. Technol., 38, 1185–1205, 2004.
ACPD
9, 8223–8260, 2009New particles from pine emissions
L. Q. Hao et al.
Title Page
Abstract Introduction
Conclusions References
Tables Figures
◭ ◮
◭ ◮
Back Close
Full Screen / Esc
Printer-friendly Version
Interactive Discussion
257, 2007.
Docherty, K. S. and Ziemann, P. J.: Effects of stabilized Criegee intermediate and OH radical scavengers on aerosol formation from reactions ofβ-Pinene with O3, Aerosol Sci. Technol.,
37, 877–891, 2003.
Gao, S., Keywood, M., Ng, N. L., Surratt, J., Varutbangkul, V., Bahreini, R., Flagan, R. C.,
5
and Seinfeld, J. H.: Low-molecular-weight and oligomeric components in secondary organic aerosol from the ozonolysis of cycloalkenes andα-Pinene, J. Phys. Chem. A., 108, 10147– 10164, 2004.
Guenther, A., Hewitt, C. N., Erickson, D., Fall, R., Geron, C., Graedel, T., Harley, P., Klinger, L., Lerdau, M., Mckay, W. A., Pierce, T., Scholes, B., Steinbrecher, R., Tallamraju, R., Taylor,
10
J., and Zimmerman, P.: A global-model of natural volatile organic-compound emissions, J. Geophys. Res., 100, 8873–8892, 1995.
Griffin, R. J., Cocker III, D. R., Flagan, R. C., and Seinfeld, J. H.: Organic aerosol formation from the oxidation of biogenic hydrocarbons, J. Geophys. Res., 104, 3555–3567, 1999. Grosjean, E., DeAndrade, J. B., and Grosjean, D.: Carbonyl products of the gas-phase reaction
15
of ozone with simple alkenes, Environ. Sci. Technol., 30, 975–983, 1996.
Hoffmann, T., Odum, J. R., Bowman, F., Collins, D., Klockow, D., Flagan, R., and Seinfeld, J. H.: Formation of organic aerosols from the oxidation of biogenic hydrocarbons, J. Atmos. Chem., 26, 189–222, 1997.
Hoppel, W., Fitzgerald, J., Frick, G., Caffrey, P., Pasternack, L., Hegg, D., Gao, S., Leaitch, R.,
20
Shantz, N., Cantrell, C., Albrechcinski, T., Ambrusko, J., and Sullivan, W.: Particle formation and growth from ozonolysis of a-pinene, J. Geophy. Res., 106, 27603–27618, 2001.
Jayne, J. T., Leard, D. C., Zhang, X. F., Davidovits, P., Smith, K. A., Kolb, C. E., and Worsnop, D. R.: Development of an aerosol mass spectrometer for size and composition analysis of submicron particles, Aerosol Sci. Technol., 33, 49–70, 2000.
25
Jang, M. and Kamens, R. M.: Newly characterized products and composition of secondary aerosols from the reaction of alpha-pinene with ozone, Atmos. Environ., 33, 459–474, 1999. Jim ´enez, E., Lanza, B., Garz ´on, A., Ballesteros, B., and Albaladejo, J.: Atmospheric
degra-dation of 2-Butanol, 2-Methyl-2-butanol, and 2,3-Dimethyl-2-butanol: OH kinetics and UV absorption cross sections, J. Phys. Chem. A., 109, 10903–10909, 2005.
30
ACPD
9, 8223–8260, 2009New particles from pine emissions
L. Q. Hao et al.
Title Page
Abstract Introduction
Conclusions References
Tables Figures
◭ ◮
◭ ◮
Back Close
Full Screen / Esc
Printer-friendly Version
Interactive Discussion
doi:10.1029/2001JD001213, 2003a.
Jimenez, J. L., Bahreini, R., Cocker III, D. R., Zhuang, H., Varutbangkul, V., Flagan, R. C., Seinfeld, J. H., O’Dowd, C. D., and Hoffmann, T.: New particle formation from photooxidation of diiodomethane (CH2I2), J. Geophys. Res., 108, 4318, doi:10.1029/2002JD002452, 2003b.
Joutsensaari, J., Loiv ¨amaki, M., Vuorinen, T., Miettinen, P., Nerg, A.-M., Holopainen, J. K.,
5
and Laaksonen, A.: Nanoparticle formation by ozonolysis of inducible plant volatiles, Atmos. Chem. Phys., 5, 1489–1495, 2005,
http://www.atmos-chem-phys.net/5/1489/2005/.
Kanakidou, M., Seinfeld, J. H., Pandis, S. N., Barnes, I., Dentener, F. J., Facchini, M. C., Van Dingenen, R., Ervens, B., Nenes, A., Nielsen, C. J., Swietlicki, E., Putaud, J. P., Balkanski,
10
Y., Fuzzi, S., Horth, J., Moortgat, G. K., Winterhalter, R., Myhre, C. E. L., Tsigaridis, K., Vignati, E., Stephanou, E. G., and Wilson, J.: Organic aerosol and global climate modelling: a review, Atmos. Chem. Phys., 5, 1053–1123, 2005
Kannosto, J., Virtanen, A., Lemmetty, M., M ¨akel ¨a, J. M., Keskinen, J., Junninen, H., Hussein, T., Aalto, P., and Kulmala, M.: Mode resolved density of atmospheric aerosol particles, Atmos.
15
Chem. Phys., 8, 5327–5337, 2008,
http://www.atmos-chem-phys.net/8/5327/2008/.
Keywood, M. D., Kroll, J. H., Varutbangkul, V., Bahreini, R., Flagan, R. C., and Seinfeld, J. H.: Secondary organic aerosol formation from cyclohexene ozonolysis: Effect of OH scavenger and the role of radical chemistry, Environ. Sci. Technol., 38, 3343–3350, 2004.
20
Kostenidou, E., Pathak, R. K., and Pandis, S. N.: An algorithm for the calculation of secondary organic aerosol density combining AMS and SMPS data, Aerosol Sci. Technol., 41, 1002– 1010, 2007.
Koch, S., Winterhalter, R., Uherek, E., Kolloff, A., Neeb, P., Moortgat, G. K.: Formation of new particles in the gas-phase ozonolysis of monoterpenes, Atmos. Environ., 34, 4031–4042,
25
2000.
Kroll, J. H., Ng, N. L., Murphy, S. M., Flagan, R. C., and Seinfeld, J. H.: Secondary organic aerosol formation from isoprene photooxidation, Environ. Sci. Technol., 40, 1869–1877, 2006.
Kulmala, M., Vehkam ¨aki, H., Pet ¨aj ¨a, T., Dal Maso, M., Lauria, A., Kerminen, V.-M., Birmili, W.,
30
and McMurry, P. H.: Formation and growth rates of ultrafine atmospheric particles: A review of observations, J. Aerosol Sci., 35, 143–176, 2004.
ACPD
9, 8223–8260, 2009New particles from pine emissions
L. Q. Hao et al.
Title Page
Abstract Introduction
Conclusions References
Tables Figures
◭ ◮
◭ ◮
Back Close
Full Screen / Esc
Printer-friendly Version
Interactive Discussion
Lehtinen, K. E. J., Sogacheva, L., Dal Maso, M., Aalto, P., Pet ¨aj ¨a, T., Sogachev, A., Yoon, Y. J., Lihavainen, H., Nilsson, D., Facchini, M. C., Cavalli, F., Fuzzi, S., Hoffmann, T., Arnold, F., Hanke, M., Sellegri, K., Umann, B., Junkermann, W., Coe, H., Allan, J. D., Alfarra, M. R., Worsnop, D. R., Riekkola, M.-L., Hy ¨otyl ¨ainen, T., and Viisanen, Y.: The role of VOC oxidation products in continental new particle formation, Atmos. Chem. Phys., 8, 2657–2665, 2008,
5
http://www.atmos-chem-phys.net/8/2657/2008/.
Lambe, A. T., Zhang, J. Y., Sage, A. M., and Donahue, N. M.: Controlled OH radical produc-tion via Ozone-alkene reacproduc-tions for use in aerosol aging studies, Environ. Sci. Technol., 41, 2357–2363, 2007.
Lindfors, V. and Laurila, T.: Biogenic volatile organic compound (VOC) emissions from forests
10
in Finland, Boreal Environ. Res., 5, 95–113, 2000.
Lindinger, W., Hansel, A., and Jordan, A.: Proton-transfer-reaction mass spectrometry (PTR-MS): On-line monitoring of volatile organic compounds at pptv levels, Chem. Soc. Rev., 27, 347–354, 1998.
Manninen, A.-M., Vuorinen, M., and Holopainen, J. K.: Variation in growth, chemical defense
15
and herbivore resistance in Scots pine provenances. J. Chem. Ecol., 24, 1315–1331, 1998. M ¨antyl ¨a, E., Alessio, G. A., Blande, J. D., Heijari, J., Holopainen, J. K., Laaksonen, T., Piirtola,
P., and Klemola, T.: From plants to birds: Higher avian predation rates in trees responding to insect herbivory, PLoS ONE 3, p. e2832, doi:10.1371/journal.pone.0002832, 2008.
McFiggans, G., Coe, H., Burgess, R., Allan, J., Cubison, M., Alfara, M. R., Saunders, R.,
Saiz-20
Lopez, A., Plane, J. M. C., Wevill, D., Carpenter, L., Rickard, A. R., and Monks, P. S.: Direct evidence for coastal iodine particles from Laminaria macroalgae – linkage to emissions of molecular iodine, Atmos. Chem. Phys., 4, 701–713, 2004,
http://www.atmos-chem-phys.net/4/701/2004/.
Mentel, Th. F., Wildt, J., Kiendler-Scharr, A., Kleist, E., Tillmann, R., Dal Maso, M., Fisseha, R.,
25
Hohaus, Th., Spahn, H., Uerlings, R., Wegener, R., Griffiths, P. T., Dinar, E., Rudich, Y., and Wahner, A.: Photochemical production of aerosols from real plant emissions, Atmos. Chem. Phys. Discuss., 9, 3041–3094, 2009,
http://www.atmos-chem-phys-discuss.net/9/3041/2009/.
Ng, N. L., Chhabra, P. S., Chan, A. W. H., Surratt, J. D., Kroll, J. H., Kwan, A. J., McCabe,
30
D. C., Wennberg, P. O., Sorooshian, A., Murphy, S. M., Dalleska, N. F., Flagan, R. C., and Seinfeld, J. H.: Effect of NOx level on secondary organic aerosol (SOA) formation from the
ACPD
9, 8223–8260, 2009New particles from pine emissions
L. Q. Hao et al.
Title Page
Abstract Introduction
Conclusions References
Tables Figures
◭ ◮
◭ ◮
Back Close
Full Screen / Esc
Printer-friendly Version
Interactive Discussion
http://www.atmos-chem-phys.net/7/5159/2007/.
Niki, H., Maker, P. D., Savage, C. M., Breitenbach, L. P., and Hurley, M. D.: FTIR spectroscopic study of the mechanism for the gas-phase reaction between ozone and tetramethylethylene, J. Phys. Chem., 91, 941–946, 1987.
Odum, J. R., Hoffmann, T., Bowman, F., Collins, D., Flagan, R. C., and Seinfeld, J. H.:
5
Gas/Particle partitioning and secondary organic aerosol yields, Environ. Sci. Technol., 30, 2580–2585, 1996.
Paulson, S. E., Sen, A. D., Liu, P., Fenske, J. D., and Fox, M. J.: Evidence of formation of OH radicals from the reaction of O3with alkenes in the gas phase, Geophy. Res. Lett., 24, 3193–3196, 1997.
10
Pinto, D. M., Tiiva, P., Miettinen, P., Joutsensaari, J., Kokkola, H., Nerg, A-M., Laaksonen, A., and Holopainen, J. K.: The effects of increasing atmospheric ozone on biogenic monoter-pene profiles and the formation of secondary aerosols, Atmos. Environ., 41, 4877–4887, 2007.
Presto, A. A. and Donahue, N. M.: Secondary organic aerosol production from terpene
ozonol-15
ysis. 2. Effect of NOxconcentration, Environ. Sci. Technol., 39, 7046–7054, 2005.
R ¨ais ¨anen, T., Ryypp ¨o, A., and Kellom ¨aki, S.: Effects of elevated CO2 and temperature on
monoterpene emission of Scots pine (Pinus sylvestrisL.), Atmos. Environ., 42, 4160–4171, 2008.
Saathoff, H., Naumann, K.-H., M ¨ohler, O., Jonsson, ˚A. M., Hallquist, M., Kiendler-Scharr, A.,
20
Mentel, Th. F., Tillmann, R., and Schurath, U.: Temperature dependence of yields of sec-ondary organic aerosols from the ozonolysis ofα-pinene and limonene, Atmos. Chem. Phys., 9, 1551–1577, 2009,
http://www.atmos-chem-phys.net/9/1551/2009/.
Sakulyanontvittaya, T., Duhl, T., Wiedinmyer, C., Helmig, D., Matsunaga, S., Potosnak, M.,
25
Milford, J., and Guenther, A.: Monoterpene and sesquiterpene emission estimates for the United States, Environ. Sci. Technol., 42, 1623–1629, 2008.
Salcedo, D., Onasch, T. B., Dzepina, K., Canagaratna, M. R., Zhang, Q., Huffman, J. A., De-Carlo, P. F., Jayne, J. T., Mortimer, P., Worsnop, D. R., Kolb, C. E., Johnson, K. S., Zuberi, B., Marr, L. C., Volkamer, R., Molina, L. T., Molina, M. J., Cardenas, B., Bernab ´e, R. M.,
30
ACPD
9, 8223–8260, 2009New particles from pine emissions
L. Q. Hao et al.
Title Page
Abstract Introduction
Conclusions References
Tables Figures
◭ ◮
◭ ◮
Back Close
Full Screen / Esc
Printer-friendly Version
Interactive Discussion
CENICA Supersite, Atmos. Chem. Phys., 6, 925–946, 2006, http://www.atmos-chem-phys.net/6/925/2006/.
Shilling, J. E., Chen, Q., King, S. M., Rosenoern, T., Kroll, J. H., Worsnop, D. R., McKinney, K. A., and Martin, S. T.: Particle mass yield in secondary organic aerosol formed by the dark ozonolysis ofα-pinene, Atmos. Chem. Phys., 8, 2073–2088, 2008,
5
http://www.atmos-chem-phys.net/8/2073/2008/.
Shilling, J. E., Chen, Q., King, S. M., Rosenoern, T., Kroll, J. H., Worsnop, D. R., DeCarlo, P. F., Aiken, A. C., Surper, D., Jimenez, J. L., and Martin, S. T.: Loading-dependent elemental composition ofα-pinene SOA particles, Atmos. Chem. Phys., 9, 771–782, 2009,
http://www.atmos-chem-phys.net/9/771/2009/.
10
Taipale, R., Ruuskanen, T. M., Rinne, J., Kajos, M. K., Hakola, H., Pohja, T., and Kulmala, M.: Technical Note: Quantitative long-term measurements of VOC concentrations by PTR-MS – measurement, calibration, and volume mixing ratio calculation methods, Atmos. Chem. Phys., 8, 6681–6698, 2008,
http://www.atmos-chem-phys.net/8/6681/2008/.
15
Tarvainen, V., Hakola, H., Hell ´en, H., B ¨ack, J., Hari, P., and Kulmala, M.: Temperature and light dependence of the VOC emissions of Scots pine, Atmos. Chem. Phys., 5, 989–998, 2005, http://www.atmos-chem-phys.net/5/989/2005/.
Tsigaridis, K. and Kanakidou, M.: Global modeling of secondary organic aerosol in the tropo-sphere: a sensitivity analysis, Atmos. Chem. Phys., 3, 1849–1869, 2003,
20
http://www.atmos-chem-phys.net/3/1849/2003/.
Tuazon, E. C., Aschmann, S., Arey, J., and Atkinson, R.: Products of the gas-phase reactions of O3with a series methyl-substituted ethenes, Environ. Sci. Technol., 31, 3004–3009, 1997. Tuazon, E. C., Aschmann, S, Arey, J., and Atkinson, R.: Products of the gas-phase reactions
of a series of methyl-substituted ethenes with the OH radical, Environ. Sci. Technol., 32,
25
2106–2112, 1998.
VanReken, T. M., Greenberg, J. P., Harley, P. C., Guenther A. B., and Smith, J. N.: Direct measurement of particle formation and growth from the oxidation of biogenic emissions, Atmos. Chem. Phys., 6, 4403–4413, 2006,
http://www.atmos-chem-phys.net/6/4403/2006/.
30
Vuorinen, T., Nerg, A.-M., Ibrahim, M. A., Reddy, G. V. P., and Holopainen, J. K.: Emission of
Plutella xylostella-induced compounds from cabbages grown at elevated CO2and orientation
ACPD
9, 8223–8260, 2009New particles from pine emissions
L. Q. Hao et al.
Title Page
Abstract Introduction
Conclusions References
Tables Figures
◭ ◮
◭ ◮
Back Close
Full Screen / Esc
Printer-friendly Version
Interactive Discussion
Yu, J. Z., Cocker III, D. R., Griffin, R. J., Flagan, R. C., and Seinfled, J. H.: Gas-phase ozone oxidation of monoterpenes: Gaseous and particulate products, J. Atmos. Chem., 34, 207– 258, 1999.
Zhang, Q., Stanier, C. O., Canagaratna, M. R., Jayne, J. T., Worsnop, D. R., Pandis, S. N., and Jimenez, J. L.: Insights into the chemistry of new particle formation and growth events
5
in Pittsburgh based on Aerosol Mass Spectrometry, Environ. Sci. Technol., 38, 4797–4809, 2004.
Ziemann, P. J.: Formation of alkoxyhydroperoxy aldehydes and cyclic peroxyhemiacetals from reactions of cyclic alkenes with O3in the presence of alcohols, J. Phys. Chem. A, 107, 2048– 2060, 2003.
ACPD
9, 8223–8260, 2009New particles from pine emissions
L. Q. Hao et al.
Title Page
Abstract Introduction
Conclusions References
Tables Figures
◭ ◮
◭ ◮
Back Close
Full Screen / Esc
Printer-friendly Version
Interactive Discussion
Table 1.Gas phase kinetic constants, OH yield (YOH), acetone (AT) yield (YAT), formaldehyde
(FAH) yield (YFAH) and correction factors used in the study.
Rate constant,k YOH YAT YFAH Correction factor
VOCs (cm3molecule−1s−1)a (ω
i, ω′i)
a,b (β
i, βi′)
c,d (α
i, α′i)
c,e (γ
i, γi′) (γ′′i, γ′′′i )
TME+O3 113×10−17 1.0 1.05 0.28 1.0 –
TME+OH 110×10−12 – 1.7 – – 1.0
Isoprene+O3 1.27×10⁻¹⁷ 0.27 – 0.9 1.1 –
Isoprene+OH 100×10−12 – – 0.63 – 1.2
Myrcene+O3 47×10−17 0.63 0.26 0.26 1.2 –
Mycrene+OH 215×10−12 – 0.45 0.30 – 1.3
β-phellandrene+O3 4.7×10⁻¹⁷ 0.14 – – 1.1 –
β-phellandrene+OH 168×10−12 – – – – 1.2
Limonene+O3 21×10−17 0.67 0.02 0.02 1.1 –
Limonene+OH 164×10−12 – 0.03 – – 1.2
∆3-carene+O3 3.7×10⁻¹⁷ 0.86 0.22 0.16 1.0 –
∆3-carene+OH 88×10−12 – 0.15 0.21 – 1.1
α-pinene+O3 8.4×10⁻¹⁷ 0.8 0.08 0.15 1.0 –
α-pinene+OH 52.3×10⁻¹² – 0.15 0.19 – 1.1
β-pinene+O3 1.5×10⁻¹⁷ 0.35 0.04 0.65 1.0 –
β-pinene+OH 74.3×10⁻¹² – 0.13 0.45 – 1.1
Camphene+O3 0.09×10⁻¹⁷ 0.18 – – 1.0 –
Camphene+OH 52×10−12 – 0.39 – – 1.1
Sabinene+O3 8.3×10⁻¹⁷ 0.33 0.03 – 1.0 –
Sabinene+OH 117×10−12 – 0.19 – – 1.2
Terpinolene+O3 190×10− 17
1.0 0.50 – 1.1 –
Terpinolene+OH 225×10−12 – 0.39 0.29 – 1.2
Acetone+OH 0.17×10⁻¹² – – – – 1.0
Formaldehyde+OH 9.37×10⁻¹² – – – – 1.0
2-butanol+OH 8.7×10⁻¹² – – – – 1.0
a
Atkinsion and Arey (2003a) b
Aschmann et al. (2002); Lambe et al. (2007); Paulson et al. (1997) cAtkinsion and Arey (2003b)
d
Tuazon et al. (1998) e
ACPD
9, 8223–8260, 2009New particles from pine emissions
L. Q. Hao et al.
Title Page
Abstract Introduction
Conclusions References
Tables Figures
◭ ◮
◭ ◮
Back Close
Full Screen / Esc
Printer-friendly Version
Interactive Discussion
Table 2.Initial conditions of chamber experiments performed and analysis results.
Experi- VOCs TME First O3addition Second O3addition
Date and ment initial initial Inlet time Peak O3 Peak OH Inlet time Peak O3 Peak OH year No. (ppb) (ppb) (ppb) (min)∗ (ppb)∗∗ (ppt)∗∗∗ (ppb) (min)∗ (ppb)∗∗ (ppt)∗∗∗
12 Oct 2007 E1a 74.1 118 200 25 4.15 0.043 200 25 15.1 0.075
23 Oct 2007 E1b 28.8 342 200 75 5.17 0.073 0 0 0 0
25 Oct 2007 E1c 113.8 984 200 75 0 <0.0008 800 30 17.8 0.148
22 Oct 2007 E2 23.2 0 200 13 20.7 0.0139 0 0 0 0
2- butanol,
26 Oct 2007 E3 100.3 60 30 6.17 0.0001 200 30 37.4 0.0005
54 ppm
∗Duration of ozone addition into the chamber. ∗∗Measured maximum O
ACPD
9, 8223–8260, 2009New particles from pine emissions
L. Q. Hao et al.
Title Page
Abstract Introduction
Conclusions References
Tables Figures
◭ ◮
◭ ◮
Back Close
Full Screen / Esc
Printer-friendly Version
Interactive Discussion
Table 3.Percentage molar contributions of different chemical compounds to pine emissions.
Pine VOCs (%) E1a E1b E1c E2 E3
α-pinene 26.3 27.1 30.4 26.7 47.4
β-pinene 1.5 3.4 28.4 3.4 7.6
Myrcene 11.9 11.8 8.8 16.4 4.6
β-phellandrene 8.0 16.7 4.5 20.2 4.4
Limonene 4.5 3.5 25.8 3.4 33.2
∆3-carene 40.4 30.9 0 22.0 0
Camphene 0.7 0.3 0.6 0.4 0.7
Sabinene 1.8 2.4 0 1.7 0
Terpinolene 1.8 1.7 0 1.7 0
Isoprene 3.0 2.1 1.3 3.9 2.0
ACPD
9, 8223–8260, 2009New particles from pine emissions
L. Q. Hao et al.
Title Page
Abstract Introduction
Conclusions References
Tables Figures
◭ ◮
◭ ◮
Back Close
Full Screen / Esc
Printer-friendly Version
Interactive Discussion
Table 4.Fraction by which each VOC react with OH during the first hour of new particle
forma-tion.
Fraction α-pinene β-pinene ∆3-carene Limonene Myrcene Camphene Sabinene Terpinolene β-phellandrene Isoprene
(VOC+OH, %)
E1a 81.3 97.2 94.3 84.5 76.2 99.8 90.8 45.3 96.2 98.2
E1b 86.1 98.0 95.9 88.6 81.9 99.8 93.3 54.0 97.3 98.7
E1c 85.8 98.0 / 88.3 81.6 99.8 / / 97.2 98.7
E2 32.5 79.3 64.8 73.5 26.2 97.8 52.2 8.4 37.7 85.9