AMTD
6, 2151–2181, 2013Sub 3 nm counters
D. Wimmer et al.
Title Page
Abstract Introduction
Conclusions References
Tables Figures
◭ ◮
◭ ◮
Back Close
Full Screen / Esc
Printer-friendly Version Interactive Discussion
Discussion
P
a
per
|
Dis
cussion
P
a
per
|
Discussion
P
a
per
|
Discussio
n
P
a
per
|
Atmos. Meas. Tech. Discuss., 6, 2151–2181, 2013 www.atmos-meas-tech-discuss.net/6/2151/2013/ doi:10.5194/amtd-6-2151-2013
© Author(s) 2013. CC Attribution 3.0 License.
Atmospheric Measurement
Techniques
Open Access
Discussions
Geoscientiic Geoscientiic
Geoscientiic Geoscientiic
This discussion paper is/has been under review for the journal Atmospheric Measurement Techniques (AMT). Please refer to the corresponding final paper in AMT if available.
Performance of diethylene glycol based
particle counters in the sub 3 nm size
range
D. Wimmer1,*, K. Lehtipalo2,3, A. Franchin2, J. Kangasluoma2, F. Kreissl1, A. K ¨urten1, A. Kupc4, A. Metzger1, J. Mikkil ¨a3, T. Pet ¨aj ¨a2, F. Riccobono5,**, J. Vanhanen3, M. Kulmala2, and J. Curtius1
1
Institute for Atmospheric and Environmental Sciences, Goethe University of Frankfurt, Frankfurt am Main, Germany
2
Department of Physics, University of Helsinki, Helsinki, Finland
3
Airmodus, Ltd, Gustaf H ¨allstr ¨omin katu 2a, 00560 Helsinki, Finland
4
University of Vienna, Faculty of Physics, Vienna, Austria
5
Laboratory of Atmospheric Chemistry, Paul Scherrer Institute, Villigen, Switzerland
*
now at: Department of Physics, University of Helsinki, Helsinki, Finland
**
now at: Joint Research Centre, European Commission, 21027 Ispra, Italy
Received: 17 January 2013 – Accepted: 14 February 2013 – Published: 26 February 2013 Correspondence to: J. Curtius ([email protected])
AMTD
6, 2151–2181, 2013Sub 3 nm counters
D. Wimmer et al.
Title Page
Abstract Introduction
Conclusions References
Tables Figures
◭ ◮
◭ ◮
Back Close
Full Screen / Esc
Printer-friendly Version Interactive Discussion
Discussion
P
a
per
|
Dis
cussion
P
a
per
|
Discussion
P
a
per
|
Discussio
n
P
a
per
|
Abstract
When studying new particle formation, the uncertainty in determining the “true” nucle-ation rate is considerably reduced when using Condensnucle-ation Particle Counters (CPCs) capable of measuring concentrations of aerosol particles at sizes close to or even at the critical cluster size (1–2 nm). Recently CPCs, able to reliably detect particles
be-5
low 2 nm in size and even close to 1 nm became available. The corrections needed to calculate nucleation rates are substantially reduced compared to scaling the observed formation rate to the nucleation rate at the critical cluster size. However, this improved
instrumentation requires a careful characterization of their cut-offsize and the shape
of the detection efficiency curve because relatively small shifts in the cut-off size can
10
translate into larger relative errors when measuring particles close to the cut-offsize.
Here we describe the development of two continuous flow CPCs using diethylene glycol (DEG) as the working fluid. The design is based on two TSI 3776 counters.
Sev-eral sets of measurements to characterize their performance at different temperature
settings were carried out. Furthermore two mixing-type Particle Size Magnifiers (PSM)
15
A09 from Airmodus were characterized in parallel. One PSM was operated at the
high-est mixing ratio (1 L min−1 saturator flow), and the other was operated in a scanning
mode, where the mixing ratios are changed periodically, resulting in a range of cut-off
sizes. Different test aerosols were generated using a nano-Differential Mobility
Ana-lyzer (nano-DMA) or a high resolution DMA, to obtain detection efficiency curves for all
20
four CPCs. One calibration setup included a high resolution mass spectrometer (APi-TOF) for the determination of the chemical composition of the generated clusters. The
lowest cut-offsizes were achieved with negatively charged ammonium sulphate
clus-ters, resulting in cut-offs of 1.4 nm for the laminar flow CPCs and 1.2 and 1.1 nm for the
PSMs. A comparison of one of the laminar-flow CPCs and one of the PSMs measuring
25
AMTD
6, 2151–2181, 2013Sub 3 nm counters
D. Wimmer et al.
Title Page
Abstract Introduction
Conclusions References
Tables Figures
◭ ◮
◭ ◮
Back Close
Full Screen / Esc
Printer-friendly Version Interactive Discussion
Discussion
P
a
per
|
Dis
cussion
P
a
per
|
Discussion
P
a
per
|
Discussio
n
P
a
per
|
1 Introduction
Roughly 50 % of the global Cloud Condensation Nuclei (CCN) are thought to origi-nate from secondary aerosol production in the atmosphere (Merikanto et al., 2009). Therefore one major topic in atmospheric sciences is the detailed study of nucleation processes. As atmospheric new particle formation happens in the size range below
5
2 nm, there has been a growing demand to extend the range, where direct measure-ments are possible also, to that size range. The lower size limit of a condensation particle counter (CPC) is generally described by the diameter at which the counter still
detects half of the particles. This diameter is called cut-offdiameter ord50. Using
con-densation particle counters with low cut-offsizes enables detecting particles right after
10
they are formed, even when the initial growth rate is slow. This also allows to obtain information on the particle formation rate close to or even at the critical cluster size (Kulmala et al., 2012), without the need to scale down the measurement data of CPCs
with larger cut-offsizes, by using assumptions about the particle growth rate and the
loss mechanisms. It has been proposed (Sipil ¨a et al., 2010) that the inability of
repro-15
ducing atmospheric nucleation rates in the laboratory could be explained by the slow
growth of particles together with the relatively large cut-offsizes of the instrumentation
used in most experiments.
Condensation particle counters are the most commonly used instruments for mea-suring the total particle number concentration in the sub-micrometer range (McMurry,
20
2000). The working principle of a condensation particle counter is to expose the aerosol sample to a supersaturated vapour, which can condense on the particles, thereby
mak-ing them large enough to be detected optically. At least three different methods have
been used for creating the required supersaturation: adiabatic expansion, thermal
dif-fusion in a laminar flow or mixing of two flows with different thermodynamic properties.
25
The overall detection efficiency of a CPC depends both on the losses of particles
AMTD
6, 2151–2181, 2013Sub 3 nm counters
D. Wimmer et al.
Title Page
Abstract Introduction
Conclusions References
Tables Figures
◭ ◮
◭ ◮
Back Close
Full Screen / Esc
Printer-friendly Version Interactive Discussion
Discussion
P
a
per
|
Dis
cussion
P
a
per
|
Discussion
P
a
per
|
Discussio
n
P
a
per
|
ηCPC(Dp)=ηsam(Dp)·ηact(Dp)·ηdet(Dp) (1)
whereηsamis the sampling efficiency which is defined as the ratio of particle
concen-trations exiting the capillary and the concenconcen-trations extracted from the sample flow;ηact
is defined as the activation efficiency; andηdetis defined as the detection efficiency of
the particles in the optics (also called counting efficiency).
5
The activation probability, in turn, mainly depends on the supersaturation of the con-densing vapour which the particles are exposed to and also on the activating vapour.
Besides the size of the particles, i.e. their surface curvature (Kelvin effect), their
chemi-cal composition and their charging state can have an influence on their activation
(Kul-mala et al., 2007b; Winkler et al., 2008). The cut-off size of a CPC can be lowered
10
mainly by increasing the supersaturation, but also to some extent by minimizing the
diffusional losses of particles inside the instrument. The first CPCs designed
specifi-cally for ultrafine particles were developed in the 1990s with a cut-offsize around 3 nm
(Stolzenburg and McMurry, 1991). The demand to measure even smaller particles – mainly to study atmospheric nucleation – has led to further CPC development and by
15
now several different instruments have been reported to measure in the sub-3 nm size
range (Seto et al., 1997; Sgro and Fernandez de la Mora, 2004; Mordas et al., 2005; Kulmala et al., 2007a; Sipil ¨a et al., 2008, 2009; Iida et al., 2009; Lehtipalo et al., 2009, 2010; Saghafifar et al., 2009; Vanhanen et al., 2011).
2 General considerations
20
One limiting factor in lowering the cut-offdiameter of a CPC is homogeneous nucleation
inside the instrument. If the saturation ratio is too high, homogeneous nucleation of the working fluid can occur, which leads to a higher count rate in the CPC due to
the internally produced particles. Iida et al. (2009) evaluated different working fluids
for CPCs and showed that by selecting a working fluid with high surface tension, but
AMTD
6, 2151–2181, 2013Sub 3 nm counters
D. Wimmer et al.
Title Page
Abstract Introduction
Conclusions References
Tables Figures
◭ ◮
◭ ◮
Back Close
Full Screen / Esc
Printer-friendly Version Interactive Discussion
Discussion
P
a
per
|
Dis
cussion
P
a
per
|
Discussion
P
a
per
|
Discussio
n
P
a
per
|
low enough saturation vapour pressure one can achieve high supersaturations without considerable homogeneous nucleation. In that study, diethylene glycol was identified as a fluid with very favorable properties and it has been demonstrated that it can be used to activate particles even close to 1 nm (Jiang et al., 2011b; Vanhanen et al., 2011).
5
The calibration of a CPC requires being able to produce a monodisperse aerosol with known size, chemical composition and charging state, which is not straightforward in the size range below 3 nm. CPCs are calibrated by using an aerosol generator and
after that, a Differential Mobility Analyzer (DMA) where the aerosol is classified
ac-cording to the electrical mobility of the particles. As a reference instrument usually an
10
electrometer is used. One major topic in aerosol nucleation studies is the question how
far the nucleation process is affected by the presence of ions (Kirkby et al., 2011). In
the atmosphere ions are always present and therefore the measured formation rates will include both the neutral and the charged component if no ion filter is used in front of the CPCs. Therefore, it is useful to calibrate CPCs with charged particles of both
15
polarities, but calibration measurements using neutral particles would also be
desir-able. Thus charged particles of different compositions are normally used for calibrating
CPCs.
Measurements in the sub-3 nm size range need to achieve a stable and sufficient
concentration of aerosols for each selected size. Furthermore, significant diffusional
20
losses have to be considered. Even if one manages to produce large amounts of 1 nm
particles, a sufficient concentration needs to reach the aerosol counters after charging
and transfer through the DMA.
Here we aim to characterize 4 diethylene glycol-based CPCs: 2 laminar flow DEG CPCs (modified TSI 3776) and 2 mixing-type Particle Size Magnifiers (Airmodus A09
25
PSM), and the focus is on the validation of their performance in the sub-3 nm size range through precise laboratory calibrations. In addition, two of the instruments of
AMTD
6, 2151–2181, 2013Sub 3 nm counters
D. Wimmer et al.
Title Page
Abstract Introduction
Conclusions References
Tables Figures
◭ ◮
◭ ◮
Back Close
Full Screen / Esc
Printer-friendly Version Interactive Discussion
Discussion
P
a
per
|
Dis
cussion
P
a
per
|
Discussion
P
a
per
|
Discussio
n
P
a
per
|
were used in the CLOUD experiments at CERN and the calibration data is crucial for evaluating and understanding their performance during the experiments.
3 Experimental description
3.1 The DEG CPCs
Diethylene glycol is very well suited for activating aerosol particles smaller than 3 nm,
5
but as its absolute saturation vapour pressure at typical saturator temperatures is low the particles grow only to sizes of about 90–100 nm and are thus too small for direct optical detection (Iida et al., 2009; Vanhanen et al., 2011). This means that a special setup consisting of two growth stages is required. In the first stage the particles are activated and grown by DEG, in the second stage they grow further and the actual
10
counting of the particles takes place. For the second stage a commercial CPC can be used which will be termed the “booster” CPC in the following, according to the nomenclature given by Iida et al. In the work presented here, two butanol based CPCs
a TSI 3776 (d50=2.5 nm), a TSI 3010 (d50=10 nm) and an isopropanol-based TSI
3007 (d50=10 nm) have been used as booster CPCs. The total flow through the DEG
15
stage is set to 0.3 L min−1, but the booster can have a higher inlet flow rate. In this case
an additional adjustable dilution flow after the DEG stage is required.
Iida et al. (2009) used a total inlet flow rate into the CPC of 0.3 L min−1. The
con-denser temperature was at 10◦C and the saturator temperature was set to 50◦C. The
wick that is installed inside the saturator was replaced by a 14×14 cm cellulose sheet.
20
However, in the work presented here two standard TSI 3776 ultrafine butanol CPCs were modified: after removing the wick, a cellulose filter was wrapped around a per-forated stainless steel tube housed in the saturator part of the CPC. Since the TSI software does not allow for controlling the saturator temperature to values larger than
50◦C, an additional temperature control was installed. It consists of a Pt1000 attached
25
AMTD
6, 2151–2181, 2013Sub 3 nm counters
D. Wimmer et al.
Title Page
Abstract Introduction
Conclusions References
Tables Figures
◭ ◮
◭ ◮
Back Close
Full Screen / Esc
Printer-friendly Version Interactive Discussion
Discussion
P
a
per
|
Dis
cussion
P
a
per
|
Discussion
P
a
per
|
Discussio
n
P
a
per
|
control unit (EZ-Zone, PM 6CICK-2AAAAAA). The optics part of the CPC was removed and instead, an adapter was attached to the outlet of the condenser in order to connect it to a booster CPC.
Test measurements were performed to determine the highest saturator temperature where no homogeneous nucleation occurs while having the condenser at a fixed
tem-5
perature of 10◦C. This saturator temperature was found to be 52◦C. One of the DEG
CPCs was always operated with these settings and is termed DEG CPC 1. During
these measurements, a high efficiency particle filter was installed at the inlet of the
CPCs (using laboratory air as carrier gas) while stepping up the saturator
tempera-ture. With the temperatures of 10 and 52◦C the homogeneous nucleation was about
10
0.01–0.02 cm−3min−1.
For the second setup the same modifications were performed, but with two addi-tional changes. The flow rate through the aerosol capillary was increased (from 40–
50 to 90–100 cm3s−1), which allowed raising the saturator temperature to 55◦C before
substantial homogeneous nucleation occurred. This was verified by applying the same
15
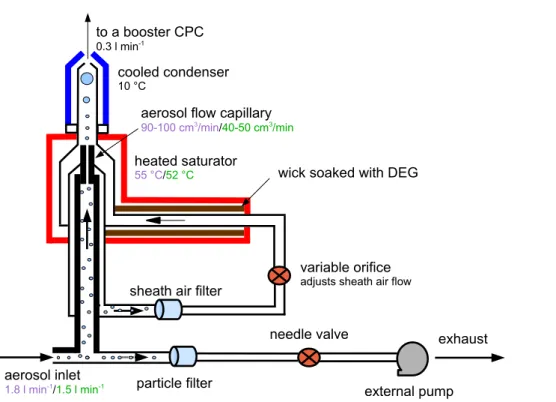
procedure as mentioned before and the same particle formation rate by homogeneous nucleation was achieved. Another change was made by implementing a needle valve and an external pump (see Fig. 1). Thereby, the inlet flow rate of the CPC could be
in-creased up to 1.8 L min−1. In the following, this setup will be referred to as DEG CPC 2.
Details for the systems, displaying the flow schemes and temperatures are shown
20
in Fig. 1. Labels in green font represent the working conditions for the DEG CPC 1; magenta represents the settings used for the DEG CPC 2. Similar modifications were reported by Kuang et al. (2011). They showed that with these modifications the
de-tection efficiencies of the CPCs were improved significantly, when using negatively
charged sodium chloride (NaCl) as a test aerosol.
25
3.2 The particle size magnifier
AMTD
6, 2151–2181, 2013Sub 3 nm counters
D. Wimmer et al.
Title Page
Abstract Introduction
Conclusions References
Tables Figures
◭ ◮
◭ ◮
Back Close
Full Screen / Esc
Printer-friendly Version Interactive Discussion
Discussion
P
a
per
|
Dis
cussion
P
a
per
|
Discussion
P
a
per
|
Discussio
n
P
a
per
|
turbulently mixing the sample with clean air saturated with diethylene glycol. A regular commercial CPC (TSI 3772 or TSI 3010) was used for further growing and count-ing the activated particles. Details of the instrument are described by Vanhanen et al.
(2011). The cut-offsize of the PSM can be varied by changing the mixing ratio of the
saturator and sample flow rate, which determines the supersaturation achieved in the
5
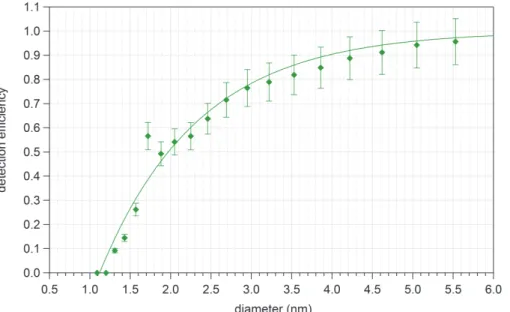
mixing section. Therefore, using the PSM in a scanning mode, also information about the particle size distribution can be obtained. The relationship between the mixing ratio and activation diameter of particles is based on laboratory calibrations. Figure 2 shows
how the detection efficiency of differently sized negative ammonium sulphate clusters
change when varying the PSM saturator flow rate. Particles above 2 nm in diameter
10
are detected already with very small saturator flow rates (mixing ratio<0.07), whereas
1.2 nm clusters require a mixing ratio higher than 0.22 before they are detected. The ammonium sulphate clusters were produced with the setup described in Fig. 3 (see next Sect. 3.3).
3.3 Generation of test aerosols
15
The main focus of this work is to characterize and compare the detection efficiencies
of the DEG CPCs and the PSMs. Therefore, detailed calibration measurements were carried out using various methods for providing monodisperse aerosol particles in the size range between 1 and 10 nm.
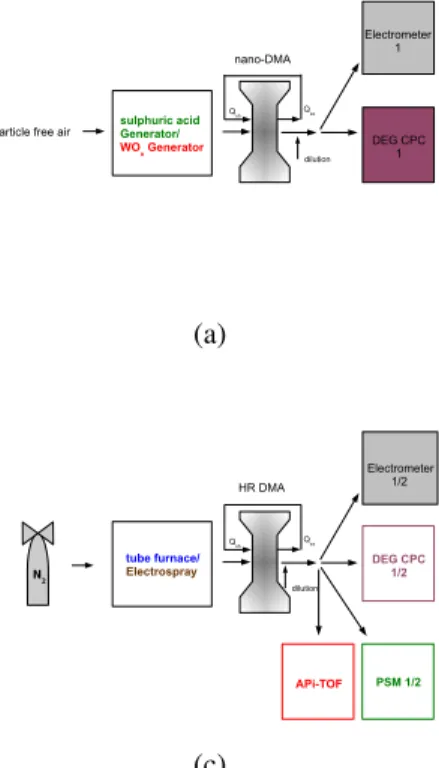
The first setup is shown in Fig. 3a, where a nano-DMA (Grimm Aerosol Technik,
20
S-DMA, 55–100) was used for size selecting the generated aerosol particles. In this case the DMA was running in a closed loop arrangement with a sheath air flow rate of
20 L min−1. Three di
fferent types of aerosol generators were used in this configuration.
These are; (a) a tungsten oxide generator (Grimm Aerosol Technik, NANO WOx
Gen-erator, 7.860), (b) a tube furnace using NaCl (Scheibel and Porstend ¨orfer, 1983) and
25
(c) a sulphuric acid particle generator (Middlebrook et al., 1997). The sulphuric acid particle generator consists of a small heated quartz glass tube containing a ceramic
AMTD
6, 2151–2181, 2013Sub 3 nm counters
D. Wimmer et al.
Title Page
Abstract Introduction
Conclusions References
Tables Figures
◭ ◮
◭ ◮
Back Close
Full Screen / Esc
Printer-friendly Version Interactive Discussion
Discussion
P
a
per
|
Dis
cussion
P
a
per
|
Discussion
P
a
per
|
Discussio
n
P
a
per
|
of the heater were varied between 55 and 77◦C. Particle-free air from the laboratory
was used as carrier gas for all the generators used in this configuration.
The high resolution DMA (Herrmann et al., 2000) was operated in two different
modes. The first one is shown in Fig. 3b, where the high resolution DMA was run-ning in an open loop arrangement and the DEG CPC 1 was calibrated against an
5
electrometer. In the second mode (Fig. 3c), the high resolution DMA was operated in a closed loop arrangement, while one DEG CPC and one PSM at a time were cali-brated in parallel against an electrometer. All 4 instruments were calicali-brated using this setup. A high resolution mass spectrometer capable of analyzing the composition of the clusters. (Atmospheric Pressure Interface – Time of flight APi-TOF, Junninen et al.,
10
2010) was measuring in parallel to verify that the composition of the aerosol was free of impurities and did not change during the calibration measurements. By using pure ni-trogen as carrier gas (5.0), the aerosol sample was observed to be bisulphate clusters with only a few contaminant substances at low levels, while contaminant levels were considerably higher when filtered lab air was used. Since no direct measurement of the
15
high-resolution DMA sheath gas flow was available, ions from an electrospray source with known electrical mobility were used to calibrate the voltage-mobility relation flow prior to each measurement (Fernandez de la Mora et al., 2005).
4 Results
4.1 Cut-offmeasurements
20
In the following, the results of the cut-offmeasurements are presented. The diameters
reported here are electrical mobility equivalent diameters, because the DMA measure-ment principle is based on electrical mobility. When the mobility is converted into a di-ameter, the use of the mobility diameter is most direct, while the conversion to a mass equivalent diameter introduces additional uncertainties (Ki Ku and Fernandez de la
25
AMTD
6, 2151–2181, 2013Sub 3 nm counters
D. Wimmer et al.
Title Page
Abstract Introduction
Conclusions References
Tables Figures
◭ ◮
◭ ◮
Back Close
Full Screen / Esc
Printer-friendly Version Interactive Discussion
Discussion
P
a
per
|
Dis
cussion
P
a
per
|
Discussion
P
a
per
|
Discussio
n
P
a
per
|
The detection efficiencies shown in the following were derived from the ratio of the
concentrations measured by a CPC and an electrometer, which was normalized to 1
at larger sizes to account for small differences in the set-ups. Two different
electrome-ters (Grimm Aerosol Technik, FCE – Grimm model 5.705 and TSI model 3068B) were used as reference instruments and an inter-comparison showed that they yielded mean
5
measured concentrations for a certain diameter between 0.5–1 %. The concentrations
measured by the electrometer were corrected for the offset, by setting the voltage at
the center electrode of the DMA to zero, which prevents particles from reaching the
exit. Since the offset can vary with time, the zero measurement was done regularly.
The concentrations were also corrected for diffusional losses (Chen and Pui, 2001)
10
for each CPC/electrometer individually since they have different inlet flow rates. All
the fitting curves for the counting efficiencies shown in the following are based on the
function proposed by Wehner et al. (2011) except for Fig. 7a. The maximum error in the selected mobility diameter using the nano-DMA was 10 % at 1 nm, where the high resolution DMA had a resolution of about 20 (Jiang et al., 2011a).
15
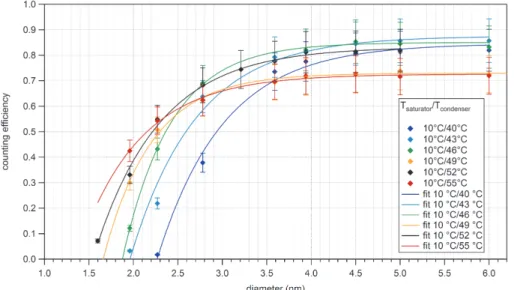
Figure 4 shows the detection efficiency as a function of the saturator temperature
for the DEG CPC 1. For each setting the condenser temperature was kept constant
at 10◦C, whereas the saturator temperature was varied between 40◦C (dark blue line)
and 55◦C (red line). The plot clearly shows that the detection e
fficiencies of the DEG
CPC 1 vary with the temperature difference between saturator and condenser. For the
20
smallest temperature difference between the saturator and the condenser, thed50was
found to be 2.7 nm. For the temperature of 52◦C, the 50 % detection e
fficiency was
2.0 nm and for 55◦C 1.8 nm. These two temperature settings are used for the DEG
CPC 1 and 2 respectively, but the highest temperature difference could only be realized
with the higher capillary flow rate while avoiding significant homogeneous nucleation.
25
The fact that the curves shown in Fig. 4 reach different plateau values is most likely due
AMTD
6, 2151–2181, 2013Sub 3 nm counters
D. Wimmer et al.
Title Page
Abstract Introduction
Conclusions References
Tables Figures
◭ ◮
◭ ◮
Back Close
Full Screen / Esc
Printer-friendly Version Interactive Discussion
Discussion
P
a
per
|
Dis
cussion
P
a
per
|
Discussion
P
a
per
|
Discussio
n
P
a
per
|
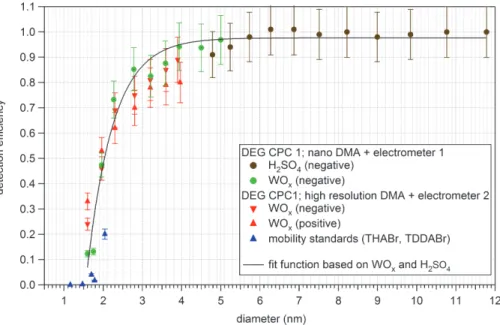
Figure 5 shows the detection efficiency of the DEG CPC 1 applying the methods
of generating test-aerosols according to Fig. 3a and b. The circles show the measure-ments performed with the nano-DMA and the triangles with the high resolution DMA (in
the open loop configuration). By using this configuration, ad50of 2.0 nm was achieved.
The results of the measurements performed providing sulphuric acid particles
(accord-5
ing to set-up Fig. 3a) are shown in Fig. 6. Here one data point at 1.7 nm is higher than expected and similar calibrations did not reproduce this high point, therefore it is
re-garded as an experimental outlier. Ad50of 2.0 nm was achieved also for sulphuric acid
test aerosol.
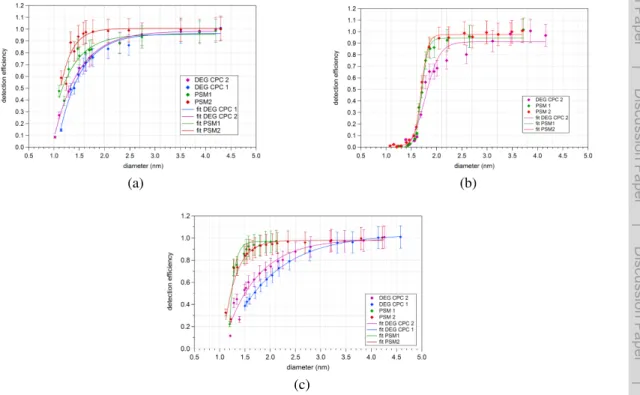
Figure 7a shows a comparison of the detection efficiencies for PSM 1 and 2 as well
10
as DEG CPC 1 and 2 using the setup from Fig. 3c. The PSM 1 was set to the highest
saturator flow, so it was operating at the lowest cut-off diameter, whereas the PSM 2
was in scanning mode and the results shown here are achieved, by using the channel with the highest mixing ratio. The figure shows the results for a set of measurements where negatively charged ammonium sulphate particles were used as test aerosol;
15
here a sigmoid fit function was applied, since the fit proposed by Wehner et al. (2011)
did not represent the data properly. Surprisingly, the cut-offof the DEG CPC 1 (1.4 nm)
seems to be considerably lower (by 0.6 nm) than shown in Fig. 5 whereas the DEG CPC
2 has a 50 % detection efficiency of 1.3 nm. The fact that the cut-offof the DEG CPC 1
is significantly shifted towards lower sizes compared to the calibration measurements
20
using tungsten oxide and sulphuric acid particles is unexpected, since the results for
the other measurements all showed a cut-offdiameter of∼=2 nm. Nevertheless, similar
results for the d50 (1.4 nm) for negatively charged ammonium sulphate particles are
reported by Iida et al. (2009). The PSMs here also show the lowest cut-offs that have
been achieved throughout the measurements and have ad50 detection efficiency of
25
1.1/1.2 nm.
Figure 7b shows the detection efficiencies for both PSM 1/2 and DEG CPC 2 using
the setup Fig. 3c. The aerosol used here was positively charged ammonium sulphate.
AMTD
6, 2151–2181, 2013Sub 3 nm counters
D. Wimmer et al.
Title Page
Abstract Introduction
Conclusions References
Tables Figures
◭ ◮
◭ ◮
Back Close
Full Screen / Esc
Printer-friendly Version Interactive Discussion
Discussion
P
a
per
|
Dis
cussion
P
a
per
|
Discussion
P
a
per
|
Discussio
n
P
a
per
|
1.7 nm. The PSMs here agree nicely with each other. Both have a cut-off of 1.6 nm,
which were the highest cut-offs that have been measured with the PSMs within this
study.
Figure 7c shows the detection efficiencies for both PSM 1/2 and DEG CPC 1/2
ap-plying the setup shown in Fig. 3c where negatively charged sodium chloride particles
5
were generated. This data shows 50 % detection efficiencies of 1.7 nm for the DEG
CPC 2 and 2 nm for the DEG CPC 1 respectively. The cut-offfor both PSMs for sodium
chloride was 1.2 nm.
One reason for the differences in the cut-offsizes of the CPCs for the different test
aerosols might be the following: when using an APi-TOF in parallel, to measure the
10
cluster composition, we found out that, if the aerosol sample and the measurement setup is not cleaned carefully it will contain molecular impurities, which seem to af-fect the measurement at sizes smaller than about 1.7 nm. Especially when generating positively charged aerosol particles, it turned out that it was impossible to produce a completely clean test aerosol without organic impurities in our set up, which could
15
explain the higher cut-offsize (by 0.5 nm) for positive ammonium sulphate. The effect
of a lower detection efficiency for positively charged clusters, has been shown by
var-ious other studies, even for different working fluids (Winkler et al., 2008; Iida et al.,
2009; Kuang et al., 2011). One possible explanation might be that the organic vapours that are mostly used as working fluids, are positively charged and therefore more likely
20
bind with negatively charged clusters. Therefore clusters with higher organic impurity
are more difficult to being activated. Another explanation could be that in the positive
polarity where the ions produced in the charger are bigger, they can have an
influ-ence on the detection efficiency curves, as their activation properties are different than
the sample ions (Sipil ¨a et al., 2009; Kangasluoma et al., 2013). The overall question
25
comes up, if the lower activation efficiency for positively charged aerosols is due to the
charge sign or due to the fact that in the positive case the organic contribution is always
higher than in the negative case. Whereby these two effects are very likely not to be
AMTD
6, 2151–2181, 2013Sub 3 nm counters
D. Wimmer et al.
Title Page
Abstract Introduction
Conclusions References
Tables Figures
◭ ◮
◭ ◮
Back Close
Full Screen / Esc
Printer-friendly Version Interactive Discussion
Discussion
P
a
per
|
Dis
cussion
P
a
per
|
Discussion
P
a
per
|
Discussio
n
P
a
per
|
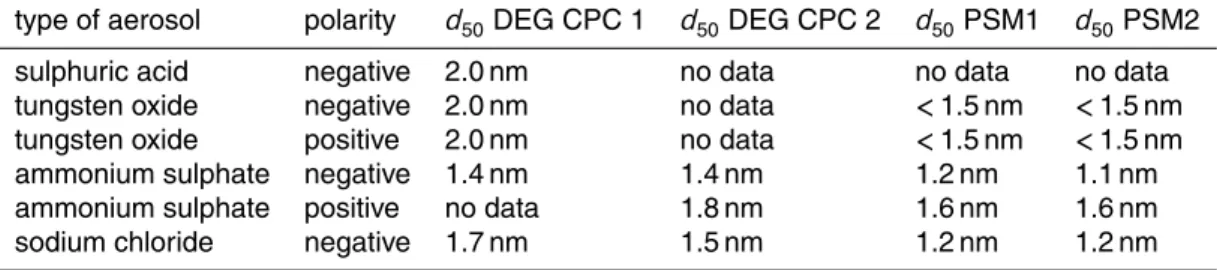
The 50 % detection efficiencies are summarized in Table 1 and the overall results
in-dicate that the effect of the aerosol type on the detection efficiencies is in general
non-negligible. It seems that when dealing with aerosol particles/clusters in the sub-3 nm size range the chemical composition of the clusters and the purity of the sample have
a significant impact on the detection efficiencies. The fact that a range of cut-off
diame-5
ters exists and that the shapes of the detection efficiency curves are different makes it
more difficult to determine the formation/nucleation/growth rates unambiguously, since
it is not obvious which cut-offdiameter to choose, if a calibration with exactly the same
particle composition is not possible.
4.2 Evaluation of the diffusional losses in a laminar flow CPC
10
The design of the ultrafine TSI 3776 with its rather low aerosol flow rate inside the
cap-illary (50 cm3min−1, see Fig. 1) indicates that it has non-negligible internal losses. In
addition, the comparison of the cut-offcurves for the DEG CPCs and the PSMs
under-line this assumption. From Fig. 7 it can be seen that the PSM 1/2 have steeper slopes
in the detection efficiencies and reach an efficiency close to 100 % at smaller sizes
ear-15
lier than the DEG CPCs, which might be due to the fact that the DEG CPCs have larger
internal losses. Another effect that might influence the shape of the detection efficiency
curve could be an inhomogeneous profile of the saturation ratio inside the instrument. In the turbulent mixing type CPC, the supersaturation is not only achieved almost im-mediately after the mixing section, but will also be roughly the same everywhere inside
20
the CPC, depending on the turbulence intensity. The laminar flow CPC on the other hand establishes a saturation profile with a maximum in the center of the flow. Particles travelling closer to the wall of the tube will not experience the same supersaturation as the particles in the center. Therefore those particles might be activated with a lower
efficiency (Stratmann et al., 1994).
25
To quantify the effect of the internal losses, a set of measurements was carried out.
AMTD
6, 2151–2181, 2013Sub 3 nm counters
D. Wimmer et al.
Title Page
Abstract Introduction
Conclusions References
Tables Figures
◭ ◮
◭ ◮
Back Close
Full Screen / Esc
Printer-friendly Version Interactive Discussion
Discussion
P
a
per
|
Dis
cussion
P
a
per
|
Discussion
P
a
per
|
Discussio
n
P
a
per
|
Behind the DMA, a three-way valve is located where the flow is directed either to the DEG stage or to a flexible conductive tubing before being sampled to the CPC. The tube length was adjusted until the CPC showed the same concentrations no matter whether the aerosol was going through the DEG stage or through the tube. To
deter-mine the final effective tube length, the length of the condenser was estimated (8 cm).
5
This has to be subtracted from the total length, since the particles at this stage can be
considered big enough not to be substantially affected by diffusional losses any more.
Prior to these measurements the DEG CPC was dried carefully and the saturator
tem-perature was set to 30◦C to avoid any activation of the particles. This way, the e
ffective
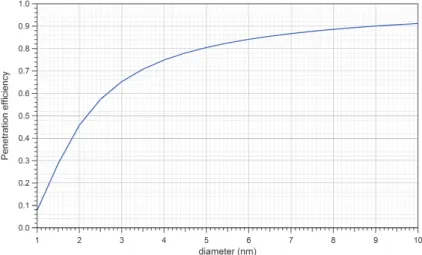
length was evaluated to be 19 cm at a flow rate of 0.3 L min−1 through the tube.
Fig-10
ure 8 shows the calculated penetration efficiencies according to Gormley and Kennedy
(1948) for the size range 1–10 nm using the experimentally determined tube length and
flow rate. The detection efficiencies, applying these corrections of the DEG CPC 1 (red
symbols) and the uncorrected points (green symbols) are shown in Fig. 9. The fact
that the 100 % efficiency line is reached for particles larger than 3 nm indicates that the
15
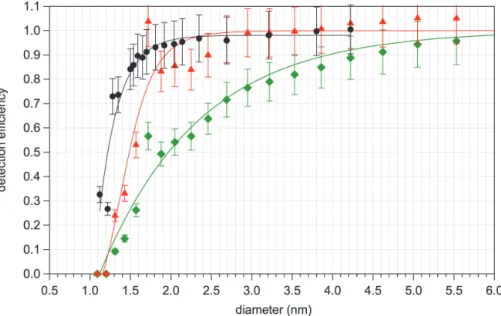
corrections applied are appropriate. As a comparison the data points from the PSM 2 for the positively charged sodium chloride clusters are added to this figure (black sym-bols). It shows that after correcting for the internal losses, the slopes of the detection
efficiency curves of the laminar-flow CPC are comparable to the mixing-type CPCs,
in which the diffusional losses of particles are considerably lower. Thus the red
sym-20
bols (corrected data) are representing the activation efficiency of particles in the DEG
CPC 1.
As the internal losses are rather significant (approx. 50 % at 2 nm), it needs to be discussed in how far the results from DEG CPC measurements such as the nucle-ation and formnucle-ation rates corrections have to be applied to account for these internal
25
losses. However the same applies to all continuous-flow CPCs when measuring close
to their cut-offsizes. Usually it is not possible to correct the data without knowing the
AMTD
6, 2151–2181, 2013Sub 3 nm counters
D. Wimmer et al.
Title Page
Abstract Introduction
Conclusions References
Tables Figures
◭ ◮
◭ ◮
Back Close
Full Screen / Esc
Printer-friendly Version Interactive Discussion
Discussion
P
a
per
|
Dis
cussion
P
a
per
|
Discussion
P
a
per
|
Discussio
n
P
a
per
|
size dependent. Therefore, in our data analysis, the uncorrected detection efficiency is
used.
4.3 Ambient measurements
In this section measurements of outdoor air in Helsinki (in Kumpula university cam-pus area, ca. 4 km from Helsinki city center) as well as indoor air from the aerosol
5
laboratory, are shown. The left hand side of Fig. 10 shows the comparison of total par-ticle concentration measured with the DEG CPC 2 and the PSM 1 in scanning mode,
measuring lab air for a time period of approximately 10 h. The different colors of the
lines represent the different flow settings for the saturator flows of the PSM. The right
half of the figure shows outdoor air measurements. The two channels with the highest
10
mixing ratios (lowest cut-off diameter) of the PSM (green and blue line) are showing
a slightly higher concentration than the other channels, especially when the overall particle concentration was low, leading to a lower condensation sink for small particles.
The difference in concentration between the flow settings was larger in the indoor air
measurements, which might be due to the fact that lots of small particles were present
15
in the laboratory air as the aerosol generation setup was running. It is worth noting that all the settings of the scanning PSM show very similar concentrations during the outdoor air measurements. Therefore it can be concluded that no significant amount of nucleation mode particles was present during this measurement period. The sudden increase of the particle concentration around 04:30 UTC (06:30 LT – local time) might
20
be due to the beginning of the morning traffic, as the measurement place is close
to a big road. In the inset of the figure a scatter plot shows the correlation between the total concentrations measured by the DEG CPC and the PSM during the ambient
measurement period. It shows a good agreement (R2=0.95) between the DEG CPC
2 (d50=1.5–1.8 nm) and the 0.55 L min−
1
setting (d50=1.5 nm) of the scanning PSM.
AMTD
6, 2151–2181, 2013Sub 3 nm counters
D. Wimmer et al.
Title Page
Abstract Introduction
Conclusions References
Tables Figures
◭ ◮
◭ ◮
Back Close
Full Screen / Esc
Printer-friendly Version Interactive Discussion
Discussion
P
a
per
|
Dis
cussion
P
a
per
|
Discussion
P
a
per
|
Discussio
n
P
a
per
|
5 Conclusions
We investigated the performance of CPCs which are sensitive to particles below 3 nm
in mobility equivalent diameter. Four different ultrafine CPCs which all use diethylene
glycol as the working fluid were studied. A variety of calibration measurements using
different methods of generating test aerosols were performed.
5
The determination of the exact detection efficiency functions of the CPCs, is
impor-tant when measuring concentrations close to the cut-offsizes. If the cut-offfunction is
shallow, both the nucleation rates and the growth rates can be affected by the shape of
the detection efficiency curves. Our results show that the 50 % detection efficiencies of
the diethylene glycol based particle counters differed depending on the composition of
10
the particles. In the laboratory this is not a problem as there the particle composition is typcially known, but in the real atmosphere the composition is unknown. This leads to a higher uncertainty in the data obtained with the atmospheric nanoparticles.
The CPCs capable of detecting particles in the range of 1 to 2 nm are highly im-portant when studying atmospheric nucleation because the corrections for calculating
15
the “true” nucleation rates are considerably reduced and information about particle growth rates in the size range between 1 and 3 nm can be obtained. Also seemingly redundant measurements with multiple sub-3 nm CPCs are highly useful, since match-ing data from several CPCs with independent operatmatch-ing principles adds greatly to the confidence in the measurements, allows a rapid and reliable determination of data
20
quality and helps to identify any instrumental problems. When comparing the mixing type CPCs with the laminar-flow DEG CPCs, they agree fairly well based on our ex-periments. The measurements at CLOUD have underlined the good agreement of the
two counter types and the importance of using low cut-offcounters for the nucleation
measurements (Kirkby et al., 2011).
25
AMTD
6, 2151–2181, 2013Sub 3 nm counters
D. Wimmer et al.
Title Page
Abstract Introduction
Conclusions References
Tables Figures
◭ ◮
◭ ◮
Back Close
Full Screen / Esc
Printer-friendly Version Interactive Discussion
Discussion
P
a
per
|
Dis
cussion
P
a
per
|
Discussion
P
a
per
|
Discussio
n
P
a
per
|
(Marie Curie Initial Training Network “CLOUD-ITN” grant no. 215072, and ERC-Advanced “ATMNUCLE” grant no. 227463), the German Federal Ministry of Education and Research (project no. 01LK0902A), the Academy of Finland Center of Excellence program (project no. 1118615). We like to thank Sebastian Ehrhart, Linda Rondo and Bertram B ¨uhner for fruitful discussions.
5
References
Chen, D. R. and Pui, D. H. Y.: Numerical and experimental studies of particle deposition in a tube with a conical contraction – laminar flow regime, in: Aerosol Measurement, John Wiley and Sons Inc., New York, 173–176, 2001. 2160
Ehn, M., Junninen, H., Schobesberger, S., Manninen, H. E., Franchin, A., Sipil ¨a, M. M.,
10
Pet ¨aj ¨a, T., Kerminen, V.-M., Tammet, H., Mirme, A., Mirme, S., Horrak, U., Kulmala, M., and Worsnop, D. R.: An instrumental comparison of mobility and mass measurements of atmospheric small ions, Aerosol Sci. Tech., 45, 522–532, 2011. 2159
Fernandez de la Mora, J., Thomson, B. A., and Gamero-Casta ˜no, M.: Tandem mobility mass spectrometry study of electrosprayed tetraheptyl ammonium bromide clusters, J. Am. Soc.
15
Mass. Spectrom., 16, 717–732, 2005. 2159
Gormley, P. G. and Kennedy, M.: Diffusion from a stream flowing through a cylindrical tube, in: Proceedings of the Royal Irish Academy, Section A: Mathematical and Physical Sciences, 52, available at: http://www.jstor.org/stable/20488498 last access: January 2013, University College Dublin, 163–169, 1948. 2164
20
Herrmann, W., Eichler, T., Bernardo, N., and Fernandez de la Mora, J.: Turbulent transition arises at Reynolds number 35 000 in a short ViennaType DMA with a large laminarization inlet, in: AAAR, Annual Conference, St. Louis, Minnesota, USA, 2000. 2159
Iida, K., Stolzenburg, M. R., and McMurry, P. H.: Effect of working fluid on sub-2 nm particle detection with a laminar flow ultrafine condensation particle counter, Aerosol Sci. Tech., 43,
25
81–96, 2009. 2154, 2156, 2161, 2162
AMTD
6, 2151–2181, 2013Sub 3 nm counters
D. Wimmer et al.
Title Page
Abstract Introduction
Conclusions References
Tables Figures
◭ ◮
◭ ◮
Back Close
Full Screen / Esc
Printer-friendly Version Interactive Discussion
Discussion
P
a
per
|
Dis
cussion
P
a
per
|
Discussion
P
a
per
|
Discussio
n
P
a
per
|
Jiang, J., Zhao, J., Chen, M., Eisele, F. L., Scheckman, J., Williams, B. J., Kuang, C., and Mc-Murry, P. H.: First measurements of neutral atmospheric cluster and 1–2 nm particle number size distributions during nucleation events, Aerosol Sci. Tech., 45, 2–5, 2011b. 2155
Junninen, H., Ehn, M., Pet ¨aj ¨a, T., Luosuj ¨arvi, L., Kotiaho, T., Kostiainen, R., Rohner, U., Go-nin, M., Fuhrer, K., Kulmala, M., and Worsnop, D. R.: A high-resolution mass spectrometer to
5
measure atmospheric ion composition, Atmos. Meas. Tech., 3, 1039–1053, doi:10.5194/amt-3-1039-2010, 2010. 2159
Kangasluoma, J., Junninen, H., Lehtipalo, K., Sipil ¨a, M., Mikkil ¨a, J., Vanhanen, J., Attoui, M., Worsnop, D., Kulmala, M., and Pet ¨aj ¨a, T.: Remarks on ion generation for CPC calibrations in the sub 3 nm size range, Aerosol Sci. Tech., doi:10.1080/02786826.2013.773393, in press,
10
2013. 2162
Ki Ku, B. and Fernandez de la Mora, J.: Relation between electrical mobility, mass, and size for nanodrops 1–6.5 nm in diameter in air, Aerosol Sci. Tech., 43, 241–249, 2009. 2159
Kirkby, J., Curtius, J., Almeida, J., Dunne, E., Duplissy, J., Ehrhart, S., Franchin, A., Gagne, S., Ickes, L., K ¨urten, A., Kupc, A., Metzger, A., Riccobono, F., Rondo, L., Schobesberger, S.,
15
Tsagkogeorgas, G., Wimmer, D., Amorim, A., Bianchi, F., Breitenlechner, M., David, A., Dom-men, J., Downard, A., Ehn, M., Flagan, R. C., Haider, S., Hansel, A., Hauser, D., Jud, W., Junninen, H., Kreissl, F., Kvashin, A., Laaksonen, A., Lehtipalo, K., Lima, J., Lovejoy, E. R., Makhmutov, V., Mathot, S., Mikkil ¨a, J., Minginette, P., Mogo, S., Nieminen, T., Onnela, A., Pereira, P., Pet ¨aj ¨a, T., Schnitzhofer, R., H. Seinfeld, J., Sipil ¨a, M., Stozhkov, Y., Stratmann, F.,
20
Tome, A., Vanhanen, J., Viisanen, Y., Vrtala, A., Wagner, P. E., Walther, H., Weingartner, E., Wex, H., Winkler, P. M., Carslaw, K. S., Worsnop, D. R., Baltensperger, U., and Kulmala, M.: Role of sulphuric acid, ammonia and galactic cosmic rays in atmospheric aerosol nucleation, Nature, 476, 429–433, 2011. 2155, 2166
Kuang, C., Chen, M., McMurry, P. H., and Wang, J.: Modification of laminar flow ultrafine
con-25
densation particle counters for the enhanced detection of 1 nm condensation nuclei, Aerosol Sci. Tech., 46, 309–315, 2011. 2157, 2162
Kulmala, M., Mordas, G., Pet ¨aj ¨a, T., Gr ¨onholm, T., Aalto, P. P., Vehkam ¨aki, H., Hienola, A. I., Herrmann, E., Sipil ¨a, M., Riipinen, I., Manninen, H. E., H ¨ameri, K., Stratmann, F., Bilde, M., Winkler, P. M., Birmili, W., and Wagner, P. E.: The condensation particle counter battery
30
AMTD
6, 2151–2181, 2013Sub 3 nm counters
D. Wimmer et al.
Title Page
Abstract Introduction
Conclusions References
Tables Figures
◭ ◮
◭ ◮
Back Close
Full Screen / Esc
Printer-friendly Version Interactive Discussion
Discussion
P
a
per
|
Dis
cussion
P
a
per
|
Discussion
P
a
per
|
Discussio
n
P
a
per
|
Kulmala, M., Riipinen, I., Sipil ¨a, M., Manninen, H. E., Pet ¨aj ¨a, T., Junninen, H., Dal Maso, M., Mordas, G., Mirme, A., Vana, M., Hirsikko, A., Laakso, L., Harrison, R. M., Hanson, I., Le-ung, C., Lehtinen, K. E. J., and Kerminen, V.-M.: Toward direct measurement of atmospheric nucleation, Science, 318, 89–92, 2007b. 2154
Kulmala, M., Pet ¨aj ¨a, T., Nieminen, T., Sipil ¨a, M., Manninen, H. E., Lehtipalo, K., Dal Maso, M.,
5
Aalto, P., Junninen, H., Paasonen, P., Riipinen, I., Lehtinen, K., Laaksonen, A., and Kermi-nen, V. M.: Measurement of the nucleation of atmospheric aerosol particles, Nat. Protoc., 7, 1651–1667, 2012. 2153
Lehtipalo, K., Sipil ¨a, M., Riipinen, I., Nieminen, T., and Kulmala, M.: Analysis of atmospheric neutral and charged molecular clusters in boreal forest using pulse-height CPC, Atmos.
10
Chem. Phys., 9, 4177–4184, doi:10.5194/acp-9-4177-2009, 2009. 2154
Lehtipalo, K., Kulmala, M., Sipil ¨a, M., Pet ¨aj ¨a, T., Vana, M., Ceburnis, D., Dupuy, R., and O’Dowd, C.: Nanoparticles in boreal forest and coastal environment: a comparison of obser-vations and implications of the nucleation mechanism, Atmos. Chem. Phys., 10, 7009–7016, doi:10.5194/acp-10-7009-2010, 2010. 2154
15
McMurry, P. H.: The history of condensation nucleus counters, Aerosol Sci. Tech., 33, 297–322, 2000. 2153
Merikanto, J., Spracklen, D. V., Mann, G. W., Pickering, S. J., and Carslaw, K. S.: Impact of nucleation on global CCN, Atmos. Chem. Phys., 9, 8601–8616, doi:10.5194/acp-9-8601-2009, 2009. 2153
20
Middlebrook, A. M., Thomson, D. S., and Murphy, D. M.: On the purity of laboratory-generated sulfuric acid droplets and ambient particles studied by laser mass spectrometry, Aerosol Sci. Tech., 27, 293–307, 1997. 2158
Mordas, G., Kulmala, M., Pet ¨aj ¨a, T., Aalto, P. P., Matulevicius, V., Grigoraitis, V., Ulevicius, V., Grauslys, V., Ukkonen, A., and H ¨ameri, K.: Design and performance characteristics of a
25
condensation particle counter UF-02proto, Boreal Environ. Res., 10, 543–552, 2005. 2154 Saghafifar, H., K ¨urten, A., Curtius, J., von der Weiden, S.-L., Hassanzadeh, S., and
Borr-mann, S.: Characterization of a modified expansion condensation particle counter for de-tection of nanometer-sized particles, Aerosol Sci. Tech., 43, 767–780, 2009. 2154
Scheibel, H. G. and Porstend ¨orfer, J.: Generation of monodisperse Ag- and NaCl-aerosols with
30
AMTD
6, 2151–2181, 2013Sub 3 nm counters
D. Wimmer et al.
Title Page
Abstract Introduction
Conclusions References
Tables Figures
◭ ◮
◭ ◮
Back Close
Full Screen / Esc
Printer-friendly Version Interactive Discussion
Discussion
P
a
per
|
Dis
cussion
P
a
per
|
Discussion
P
a
per
|
Discussio
n
P
a
per
|
Seto, T., Okuyama, K., de Juan, L., and Fernandez de la Mora, J.: Condensation of super-saturated vapors on monovalent and divalent ions of varying size, J. Chem. Phys., 107, 1576–1585, 1997. 2154
Sgro, L. A. and Fernandez de la Mora, J.: A simple turbulent mixing CNC for charged particle detection down to 1.2 nm, Aerosol Sci. Tech., 38, 1–11, 2004. 2154
5
Sipil ¨a, M., Lehtipalo, K., Kulmala, M., Pet ¨aj ¨a, T., Junninen, H., Aalto, P. P., Manninen, H. E., Kyr ¨o, E.-M., Asmi, E., Riipinen, I., Curtius, J., K ¨urten, A., Borrmann, S., and O’Dowd, C. D.: Applicability of condensation particle counters to measure atmospheric clusters, Atmos. Chem. Phys., 8, 4049–4060, :doi10.5194/acp-8-4049-2008, 2008. 2154
Sipil ¨a, M., Lehtipalo, K., Attoui, M., Neitola, K., Pet ¨aj ¨a, T., Aalto, P. P., O’Dowd, C. D., and
10
Kulmala, M.: Laboratory verification of PH-CPC’s ability to monitor atmospheric sub-3 nm clusters, Aerosol Sci. Tech., 43, 126–135, 2009. 2154, 2162
Sipil ¨a, M., Berndt, T., Pet ¨aj ¨a, T., Brus, D., Vanhanen, J., Stratmann, F., Patokoski, J., Mauldin III, R. L., Hyv ¨arinen, A.-P., Lihavainen, H., and Kulmala, M.: The role of sulfuric acid in atmospheric nucleation, Science, 327, 1243–1246, 2010. 2153
15
Stolzenburg, M. R. and McMurry, P. H.: An ultrafine aerosol condensation nucleus counter, Aerosol Sci. Tech., 14, 48–65, 1991. 2153, 2154
Stratmann, F., Otto, E., and Fissan, H.: Thermophoretical and diffusional particle transport in cooled laminar tube flow, J. Aerosol Sci., 25, 1305–1319, doi:10.1016/0021-8502(94)90127-9, 1994. 2160, 2163
20
Vanhanen, J., Mikkil ¨a, J., Lehtipalo, K., Sipil ¨a, M., Manninen, H. E., Siivola, E., Pet ¨aj ¨a, T., and Kulmala, M.: Particle size magnifier for Nano-CN detection, Aerosol Sci. Tech., 45, 533–542, 2011. 2154, 2155, 2156, 2158
Wehner, B., Siebert, H., Hermann, M., Ditas, F., and Wiedensohler, A.: Characterisation of a new Fast CPC and its application for atmospheric particle measurements, Atmos. Meas.
25
Tech., 4, 823–833, doi:10.5194/amt-4-823-2011, 2011. 2160, 2161, 2175
Winkler, P. M., Steiner, G., Vrtala, A., Vehkam ¨aki, H., Noppel, M., Lehtinen, K. E. J., Rei-schl, G. P., Wagner, P. E., and Kulmala, M.: Heterogeneous nucleation experiments bridg-ing the scale from molecular ion clusters to nanoparticles, Science, 319, 1374–1377, 2008. 2154, 2162
AMTD
6, 2151–2181, 2013Sub 3 nm counters
D. Wimmer et al.
Title Page
Abstract Introduction
Conclusions References
Tables Figures
◭ ◮
◭ ◮
Back Close
Full Screen / Esc
Printer-friendly Version Interactive Discussion
Discussion
P
a
per
|
Dis
cussion
P
a
per
|
Discussion
P
a
per
|
Discussio
n
P
a
per
|
Table 1. Summary of the 50 % detection efficiencies of the four CPCs for different types of aerosols. When using tungsten oxide as test aerosol the smallest size that can be produced was about 1.5 nm, where the PSMs still detected roughly 60 %.
AMTD
6, 2151–2181, 2013Sub 3 nm counters
D. Wimmer et al.
Title Page
Abstract Introduction
Conclusions References
Tables Figures
◭ ◮
◭ ◮
Back Close
Full Screen / Esc
Printer-friendly Version Interactive Discussion
Discussion
P
a
per
|
Dis
cussion
P
a
per
|
Discussion
P
a
per
|
Discussio
n
P
a
per
|
external pump needle valve
variable orifice
adjusts sheath air flow
sheath air filter
aerosol inlet 1.8 l min-1/1.5 l min-1
to a booster CPC
0.3 l min-1
heated saturator
55 °C/52 °C
cooled condenser
10 °C
wick soaked with DEG aerosol flow capillary
90-100 cm3/min/40-50 cm3/min
exhaust
particle filter
AMTD
6, 2151–2181, 2013Sub 3 nm counters
D. Wimmer et al.
Title Page
Abstract Introduction
Conclusions References
Tables Figures
◭ ◮
◭ ◮
Back Close
Full Screen / Esc
Printer-friendly Version Interactive Discussion
Discussion
P
a
per
|
Dis
cussion
P
a
per
|
Discussion
P
a
per
|
Discussio
n
P
a
per
|
AMTD
6, 2151–2181, 2013Sub 3 nm counters
D. Wimmer et al.
Title Page Abstract Introduction Conclusions References Tables Figures ◭ ◮ ◭ ◮ Back Close
Full Screen / Esc
Printer-friendly Version Interactive Discussion Discussion P a per | Dis cussion P a per | Discussion P a per | Discussio n P a per | sulphuric acid Generator/ WO
x Generator
nano-DMA
DEG CPC 1 Electrometer
1
Particle free air
Q sh Q ex dilution (a) HR DMA DEG CPC 1 Electrometer 1/2
Particle free air WOx Generator/
Electrospray Qsh Q ex dilution (b) HR DMA DEG CPC 1/2 Electrometer 1/2 tube furnace/ Electrospray Q sh Q ex PSM 1/2 APi-TOF N2 dilution (c)
Particle free air
Tube; 0.3 l min-1
3-way valve nano-DMA Qsh tube furnace TSI 3776 DEG CPC OFF Qex
WOx Generator: Grimm Aerosol Technik, NANO WOx Generator, 7.860
Nano DMA = nano-DMA (Grimm Aerosol Technik, NANO S-DMA, 55-100)
HR DMA = high resolution DMA (Herrmann DMA)
Electrometer 1 = Grimm electrometer (Grimm Aerosol Technik, 5.705 )
Electrometer 2 = TSI electrometer (TSI, 3068B)
(d)
Fig. 3.Overview of the different configurations used for the calibrations. The aerosol generators used together with the nano-DMA are shown in(a). The measurement configurations using the high resolution DMA in the open loop mode are shown in(b)and for the closed loop mode in
AMTD
6, 2151–2181, 2013Sub 3 nm counters
D. Wimmer et al.
Title Page
Abstract Introduction
Conclusions References
Tables Figures
◭ ◮
◭ ◮
Back Close
Full Screen / Esc
Printer-friendly Version Interactive Discussion
Discussion
P
a
per
|
Dis
cussion
P
a
per
|
Discussion
P
a
per
|
Discussio
n
P
a
per
|
Fig. 4.Detection efficiencies for DEG CPC 1 at different temperature settings, using tungsten oxide particles. The condenser temperature was 10◦C and the saturator temperature was
var-ied from 40◦C (blue) up to 55◦C (red). The black symbols show the setting of 52◦C, which was
AMTD
6, 2151–2181, 2013Sub 3 nm counters
D. Wimmer et al.
Title Page
Abstract Introduction
Conclusions References
Tables Figures
◭ ◮
◭ ◮
Back Close
Full Screen / Esc
Printer-friendly Version Interactive Discussion
Discussion
P
a
per
|
Dis
cussion
P
a
per
|
Discussion
P
a
per
|
Discussio
n
P
a
per
|
AMTD
6, 2151–2181, 2013Sub 3 nm counters
D. Wimmer et al.
Title Page
Abstract Introduction
Conclusions References
Tables Figures
◭ ◮
◭ ◮
Back Close
Full Screen / Esc
Printer-friendly Version Interactive Discussion
Discussion
P
a
per
|
Dis
cussion
P
a
per
|
Discussion
P
a
per
|
Discussio
n
P
a
per
|
AMTD
6, 2151–2181, 2013Sub 3 nm counters
D. Wimmer et al.
Title Page
Abstract Introduction
Conclusions References
Tables Figures
◭ ◮
◭ ◮
Back Close
Full Screen / Esc
Printer-friendly Version Interactive Discussion
Discussion
P
a
per
|
Dis
cussion
P
a
per
|
Discussion
P
a
per
|
Discussio
n
P
a
per
|
(a) (b)
(c)
AMTD
6, 2151–2181, 2013Sub 3 nm counters
D. Wimmer et al.
Title Page
Abstract Introduction
Conclusions References
Tables Figures
◭ ◮
◭ ◮
Back Close
Full Screen / Esc
Printer-friendly Version Interactive Discussion
Discussion
P
a
per
|
Dis
cussion
P
a
per
|
Discussion
P
a
per
|
Discussio
n
P
a
per
|
AMTD
6, 2151–2181, 2013Sub 3 nm counters
D. Wimmer et al.
Title Page
Abstract Introduction
Conclusions References
Tables Figures
◭ ◮
◭ ◮
Back Close
Full Screen / Esc
Printer-friendly Version Interactive Discussion
Discussion
P
a
per
|
Dis
cussion
P
a
per
|
Discussion
P
a
per
|
Discussio
n
P
a
per
|
AMTD
6, 2151–2181, 2013Sub 3 nm counters
D. Wimmer et al.
Title Page
Abstract Introduction
Conclusions References
Tables Figures
◭ ◮
◭ ◮
Back Close
Full Screen / Esc
Printer-friendly Version Interactive Discussion
Discussion
P
a
per
|
Dis
cussion
P
a
per
|
Discussion
P
a
per
|
Discussio
n
P
a
per
|