Investigated Quantitatively by Kinetic Modeling
Panpan Hou1., Rong Zhang1., Yongfeng Liu1,3., Jing Feng2
, Wei Wang1, Yingliang Wu2*, Jiuping Ding1*
1Key Laboratory of Molecular Biophysics of the Ministry of Education, College of Life Science and Technology, Huazhong University of Science and Technology, Wuhan, Hubei, China,2State Key Laboratory of Virology, College of Life Sciences, Wuhan University, Wuhan, China,3School of Public Health, Xinxiang Medical University, Xinxiang, Henan, China
Abstract
Kv1.3 channel is a delayed rectifier channel abundant in human T lymphocytes. Chronic inflammatory and autoimmune disorders lead to the over-expression of Kv1.3 in T cells. To quantitatively study the regulatory mechanism and physiological function of Kv1.3 in T cells, it is necessary to have a precise kinetic model of Kv1.3. In this study, we firstly established a kinetic model capable to precisely replicate all the kinetic features for Kv1.3 channels, and then constructed a T-cell model composed of ion channels including Ca2+-release activated calcium (CRAC) channel, intermediate K+(IK) channel, TASK
channel and Kv1.3 channel for quantitatively simulating the changes in membrane potentials and local Ca2+ signaling
messengers during activation of T cells. Based on the experimental data from current-clamp recordings, we successfully demonstrated that Kv1.3 dominated the membrane potential of T cells to manipulate the Ca2+influx via CRAC channel. Our
results revealed that the deficient expression of Kv1.3 channel would cause the less Ca2+signal, leading to the less efficiency
in secretion. This was the first successful attempt to simulate membrane potential in non-excitable cells, which laid a solid basis for quantitatively studying the regulatory mechanism and physiological role of channels in non-excitable cells.
Citation:Hou P, Zhang R, Liu Y, Feng J, Wang W, et al. (2014) Physiological Role of Kv1.3 Channel in T Lymphocyte Cell Investigated Quantitatively by Kinetic Modeling. PLoS ONE 9(3): e89975. doi:10.1371/journal.pone.0089975
Editor:Stuart E. Dryer, University of Houston, United States of America
ReceivedDecember 9, 2013;AcceptedJanuary 23, 2014;PublishedMarch 3, 2014
Copyright:ß2014 Ding et al. This is an open-access article distributed under the terms of the Creative Commons Attribution License, which permits unrestricted use, distribution, and reproduction in any medium, provided the original author and source are credited.
Funding:This work was supported by grants from the National Basic Research Program of China (2010CB529800), the National Science Foundation of China (30971179, 31170814). The funders had no role in study design, data collection and analysis, decision to publish, or preparation of the manuscript.
Competing Interests:The authors have declared that no competing interests exist. * E-mail: [email protected] (YW); [email protected] (JD)
.These authors contributed equally to this work.
Introduction
Kv1.3 and IK (KCa3.1) are two kinds of potassium channels in T cells. Kv1.3 channels are activated upon the depolarization of the membrane potential, while IK channels are activated by the Calcium ion [1–3]. There are three types of T cells, Naı¨ve T cell, TCMand TEMcells [3]. These quiescent cells exhibit a similar K+ channel expression pattern with ,300 Kv1.3 and ,10 IK channels per cell. However, Kv1.3 channels are up regulated to ,1500 in the activated TEM effectors and IK channels are up regulated to,500 in the activated TCMeffectors [3]. Such high expression of Kv1.3 channels has been reported associated with many chronic inflammatory and autoimmune disorders such as multiple sclerosis (MS), type 1 diabetes mellitus (T1DM) and rheumatoid arthritis (RA) [4–7], and therefore Kv1.3 channel served as a potential therapeutic target for treatment of these diseases, which was indicated by the blockers of chemical molecules and peptide toxins [8–11].
Kv1.3 channel is a voltage-activated K+channel that shows a fast activation and slow C-type inactivation and recovery [2,12– 14]. Comparing with other ion channels, Kv1.3 is sensitive to many pharmacological agents including small organic compounds and many peptide toxins such as margatoxin (MgTx), agitoxin-2 (AgTx2), ShK etc. [15,16]. Particularly, one engineered scorpion toxin ADWX-1 (autoimmune drug from Wenxin group) shows the highest affinity to Kv1.3 channels in picomolar range of potency
[17]. Those properties enable us to identify the Kv1.3 from various lymphocyte K+
currents.
Besides Kv1.3, five main types of ion channels have been identified at the molecular level in T cells. They are Ca2+
-release activated calcium (CRAC) channel, intermediate K+
(IK) channel, TASK channel (a two-pore domain potassium (K2P) channel), TRPM7 channel and Osmo-activated Cl2(Cl
swell) channel [3]. As a major calcium source in T lymphocyte cells, the CRAC channel, formed by the STIM1 and Orai1 subunits, leads a Ca2+
influx while depleting the endoplasmic reticulum (ER) Ca2+
store [18– 20]. Since the intracellular Ca2+
can modulate various important physiological functions such as potassium channel gene expression and secretion, the Ca2+
influx via CRAC channels may form a positive feedback to induce the larger Ca2+
Kv1.3 channel plays in regulating the membrane potential and the intracellular local and global Ca2+
signaling remains wrapped. Kinetic modeling provides a good way for studying and predicting the kinetic behavior of ion channels and their function in cells. Several kinetic models of Kv1.3 channel have been reported previously [12–14]. They did excellent works focused on the individual activation, inactivation or recovery characteristics. The accuracy of the cell model is based on the comprehensiveness of the ion channel models it constitutes. In this study, we establish a novel Kv1.3 model capable to precisely describe the whole kinetic behavior of Kv1.3, using a software CeL [29]. Based on the Hodgkin-Huxley theory, a model cell with appropriate component of channels can be used to simulate the firing pattern of action potentials in excitable cells [30]. But the H-H model has never been used to simulate the membrane potentials in non-excitable cells. This is a first attempt to construct a T-cell model, composed of several model channels including Kv1.3, CRAC, IK and TASK channels, for mimicking the dynamic behavior of membrane potentials and intracellular Ca2+
signaling in T cells. Although there is no action potential in T lymphocyte cells, it is still interesting to know the membrane potential performances after stimulation. Combined with the current-clamp experimental data with different amount of Kv1.3 channels blocked by ADWX-1 from T lymphocyte cells, we do quantitatively mimic all the changes in membrane potential and the corresponding Ca2+
signal in the non-excitable model T-cell. Overall, a simulation frame-work has been provided for further studying the regulatory mechanism of other channels in T lymphocyte cells, which lays a solid basis for both the immunological and ion-channel fields.
Materials and Methods
Ethics Statement
Peripheral venous blood was obtained from healthy volunteers, who provided their written informed consent to participate in this study. The consent procedure and our research were approved by the Ethics Committee of the College of Life Sciences in Wuhan University (Permit Number: ECCLS 20120076).
Cell culture and Transfection
Full length cDNA for Kv1.3 was subcloned into pcDNA3.1/ Zeo (Invitrogen). HEK293 cells were cultured in modified Eagle’s medium (DMEM, Gibco) supplemented with 10% fetal bovine serum (FBS, Gibco) at 37uC incubator with 5% CO2. The day before transfection, cells were transfered into a 24-well plate and transiently transfected using lipofectamine 2000 (Invitrogen) according to manufacturer’s protocol. Recordings were carried out in 1–2 days after transfection.
Preparation of human T lymphocyte cells
Peripheral venous blood was obtained from healthy volunteers. Mononuclear cells were isolated by Ficoll-Hypaque density gradient. T cells were separated from PBMCs by using FACS with PE conjugated CD3+
antibody and maintained in RPMI 1640 medium supplemented with 1 mM L-glutamine and 10% fetal bovine serum (Gibco) in a humidified, 5% CO2 incubator at 37uC. Recordings were carried out in 24 hours after T lymphocyte cells preparation.
Solutions
For whole-cell patch recordings, the pipette solution contained the following (in mM): 130 KCl, 2.5 MgCl2, 10 HEPES, 1 EGTA, 2 K2ATP (pH 7.4) titrated with KOH, bath solution contained the following (in mM): 145 NaCl, 5 KCl, 1 MgCl2, 2 CaCl2, 10
HEPES (pH 7.4) titrated with NaOH. All the chemicals were attained from Sigma.
Electrophysiology
Patch pipettes pulled from borosilicate glass capillaries with resistance of 2–3megohms in transfected HEK293 cell experi-ments and 6–8megohmsin T lymphocyte cell experiexperi-ments when filled with pipette solution. All experiments were performed using an EPC-9 patch-clamp amplifier and corresponding software (HEKA, Germany). Currents were typically digitized at 20 kHz and filtered at 2.9 kHz (Bessel). The 85% of series resistances were electronically compensated. During recording, the corresponding solution was puffed onto cells via a puffer pipette containing seven solution channels. All experiments were performed at room temperature (20–24uC).
Intracellular Ca2+Measurements
T lymphocyte cells were incubated in 100ml of extracellular solution (ECS) containing 140 mM NaCl, 5 mM KCl, 1 mM MgCl2, 1.8 mM CaCl2, 10 mM Hepes (pH 7.4), 10 mM glucose, 2mM fura-2/AM (Invitrogen), 2 mM Probenecid, 0.05% Pluronic F-127 and 0.1% bovine serum albumin at 37uC for 30 min. After the incubation, cells were placed in the platform for optical imaging. The imaging of intracellular Ca2+
was performed on Olympus-IX70 microscope system with a polychromatic light source (T.I.L.L. Photonics GmbH, Grafelfing, Germany). The excitation wavelengths of fura-2 fluorescence were 340 nm and 380 nm, coming from the bottom of plate at 1 Hz. All of the experiments were performed at room temperature.
Data analysis
Recording data were analyzed with IGOR (Wavemetrics, Lake Oswego, OR), Clampfit (Molecular Devices, Inc.) and Sigmaplot software (SPSS, Inc.). Unless stated otherwise, the data are presented as mean6S.D. The conductance of Kv1.3 channels was calculated from G =Ipeak/(V-Ekv1.3), where Ipeak is the peak
current,Ekv1.3is the reversal potential of Kv1.3. The
conductance-voltage (G-V) curves of activation were fitted by the Boltzmann equation:
G=Gmax~ð1zexpð{ðV{V50Þ=kÞÞ
{1, ð1Þ
WhereGmaxis the maximum conductance,V50is the half maximal
conductance voltage and k is a slope factor. The steady-state inactivation curve was fitted to the Boltzmann equation:
Ipeak~Imax=ð1zexpððV{V50Þ=kÞÞ ð2Þ
WhereImaxis the maximal peak current,V50is the half maximal
availability voltage and thekis a slope factor.
Mathematical modeling and simulation
T lymphocyte model cell has been described as the following equations [31]:
CmdV=dt~IinjzIIKzICRACzIKv1:3zITASK ð3Þ
where V is the voltage in mV, Cm is the capacity of the cell
membrane in pF,tis the time in ms,Iinjis the injection current in
pA,ITASKis the leak current in pA,ICRACis the CRAC current in
pA. In this study, Cm= 1.5 pF and the resting potential
VRest=255 mV[32,33].
All currents exceptIinjcan be written as follows:
ITASK~GTASKðV{ETASKÞ,
Where the total conductance GTASK= 0.13 nS [34] and the
reversal potentialETASK=2100 mV [35];
ICRAC~GCRACðV{ECRACÞ,
Where the total conductanceGCRAC= 0.09 nS [3] and the reversal
potentialECRAC=+80 mV [3];
IKv1:3~GKv1:3ðV{EKv1:3Þ
~ngKv1:3Poðt,VÞ ðV{EKv1:3Þ,
ð4Þ
Where the total conductanceGKv1.3= Variable,nis the number of
theKv1.3channel, the a single-channel conductancegKv1.3= 15 pS
[36], and the reversal potentialEKv1.3=273 mV [37], andPo(V)
comes from theKv1.3model.
IIK~GIKðV{EIKÞ~ngIKPoðV,CaÞ ðV{EIKÞ,
where the single-channel conductance gIK= 11 pS in normal
Ringer saline [38],nis the number of the IK channel, the total conductance GIK= 0.11 nS, assuming that 10 channels per TEM cell [3] and the reversal potentialEIK=275 mV [31], andPo(Ca)
comes from thePo(Ca)-[Ca2+]i curve reported by Grissmer et al.
[38].
Considering that theIK channel is triggered by a global Ca2+ concentration in nM, which usually is tremendously smaller than the local Ca2+
inmM [39], we thus determined the global Ca2+ concentration based on an assumption proportional to the local Ca2+
with a average intracellular Ca2+
(about 500 nM) after CRAC channel opening, which could be measured in T cells [40]. To trigger the secretion in T cells, we need to calculate the local Ca2+
concentration, depending strictly on net influx and local diffusion of Ca2+
near the CRAC channel in T cells. Assuming that secretory proteins, i.e. complexes of synaptobrevin, syntaxin and SNAP-25 termed SNARE complexes are colocalized to individual Ca2+
sources such as CRAC channel in T cells [41,42], we employ a formulation first utilized by Beeler and Reuter [43] to convert Ca2+influx to a local Ca2+concentration:
d Ca 2z i
.
dt~etransICRAC{ediff Ca2z
i ð5Þ
where [Ca2+]
i is the intracellular Ca2+concentration, etransis an arbitrary transfer coefficient that scales calcium influx to the calcium concentration, and ediffis the calcium diffusion coefficient [44]. In this study, etrans= 0.006mM*pA21*ms21 and
ediff= 0.003 ms21[29], which should be able to produce a local Ca2+
concentration high enough ($10mM) to trigger secretion [45]. Therefore, we can avoid introducing more hypotheses like many uncertain diffusion factors, unknown dissociation equilibri-um constant Kdand quantity of various buffers and the calcium efflux releasing from stores. All of those factors can be simply solved by changing the diffusion and transfer coefficients to reveal Ca2+
properties in T cells.
The differential equations for the kinetic modeling were solved numerically, using a Q-Matrix or Five-order Runge-Kutta
integration method. The fitting procedure is based on a PSO-GSS algorithm for direct estimation of rate constants from macroscopic currents [29]. The integrating routines were written and executed with software CeL (HUST, Wuhan, Hubei, China), compiled with the C++compiler to run under Windows XP [31]. Kinetic parameters were optimized with CeL as previously described [29].
Results
To understand the role Kv1.3 channels play in T cells, it is extremely necessary to establish a kinetic model capable to precisely describe its detailed kinetic characteristics under phys-iological conditions. After that, we can use this Kv1.3 channel model and other four channel models to construct a model T-cell for mimicking the behaviors of membrane potentials and the intracellular Ca2+
signaling and thereby to determine Kv1.3 channel physiological role in T cells.
A sequential kinetic model of Kv1.3 channels
Several non-sequential kinetic models of Kv1.3 had been reported for simulating the kinetics of Kv1.3 currents, but they focused on the individual activation, inactivation or recovery characteristics [2,12–14]. Here we provided a simple model for simultaneously simulating the whole kinetics of Kv1.3 currents including activation, deactivation, steady-state inactivation and recovery (Fig. 1A). It is a sequential model of which the activation process depends on the forward (activation) ratesaand A from the closed (Ci) to the open (O) to the inactivated (I) states, the deactivation process depends on the backward ratesband B from O to Ciand the inactivation process depends on the ratesgandQ from O to I. All the rates can be determined by automatically fitting the model to the experimental data with the software CeL [29].
Many studies have confirmed that the heterologously expressed Kv1.3 channels possess biophysical and pharmacological signature closely resemble that of native Kv1.3 channels in T lymphocytes cells [37,46,47]. Their voltage dependence, rates of opening and closing, single-channel conductance, inactivation properties, and blockade by different compounds including tetraethylammonium (TEA) and charybdotoxin (CTX) were indistinguishable from native Kv1.3 channels. So we recorded Kv1.3 dynamics from transfected HEK293 cells to simplify the modeling.
To complete the kinetic model of Kv1.3, experiments were performed on Kv1.3-transfected HEK293 cells to acquire the activation (Fig. 1B), steady-state inactivation (Fig. 1C) and deactivation (Fig. 1D), respectively. In Fig. 1B, Kv1.3 currents (black) exhibited a fast activation and then a slow inactivation, evoked by 1 s depolarizing voltage steps ranging from 270 to +50 mV in 15 mV increments from a 90 s holding potential of
290 mV to remove the possible inactivation. The forward rates of the process CRORI could be determined by fitting it to the
activation currents. Here the red lines conferred a perfect fit (Fig. 1B). The voltage dependence of steady-state inactivation currents (black), standing for the availability of channels, was obtained by applying a set of conditioning voltages ranging from
280 to210 mV for 90 s in 5 mV increments and then measured at a 150 ms test pulse of 50 mV as indicated (Fig. 1C). The backward rates of CrOrI could be determined by fitting it to
Similarly, the backward rate of CrO could be determined by
fitting it to deactivation currents. All the fits (red) were fully overlapping to the data (black) (Fig. 1D).
The normalized activation (G-V) curves (black) of Kv1.3 had an averaged value of V50=228.461.6 mV, and the normalized steady-state inactivation (availability) curve tested at 50 mV had a V50=243.563.7 mV (Fig. 1E left), consistent with previous work on Kv1.3 [37,46,47]. In Fig. 1E, both the G-V and steady-state curves from simulations (red) were closely coincides with that of data (black). Additionally, the time constants of activation (ta) (Fig. 1F bottom), inactivation (ti) (Fig. 1F top), and deactivation (td) (Fig. 1G) were also consistent to the experimental data.
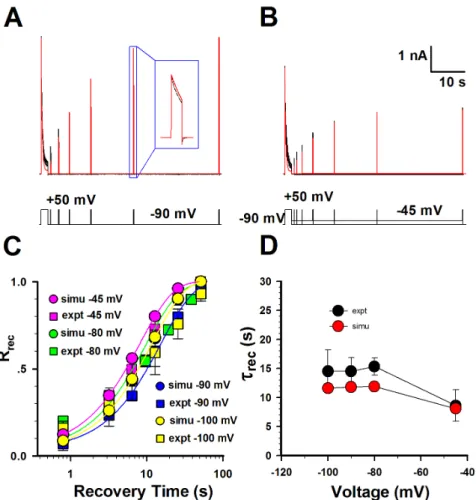
Based on the perfect fitness to the activation, inactivation, deactivation and steady-state inactivation data, all the parameters in Kv1.3 model were basically determined. Then we further examined whether this model matched the data of recovery from inactivation by subtly readjusting the parameters in the Kv1.3 model. Since the time course of recovery from inactivation is mono-exponential, the sequential model with only one inactiva-tion state is good enough for the Kv1.3 kinetics. This model conferred by and large a rough fit to both the currents recovering at 245 and 290 mV. Fig. 2C displayed a set of fractional
recovery curves arising from a two-pulse protocol (P1 = 1 s, P2 = 150 ms, V =2100, 290, 280 and 245 mV). The time constants of recovery were 8.6 s at245 mV, 15.6 s at280 mV, 14.6 s at290 mV, 14.6 s at2100 mV, approximately consistent to the experimental data (Fig. 2D). Interestingly, this result indicated that the recovery of Kv1.3 was weakly voltage-dependent under physiological condition [14]. So far, a sequential kinetic model, well illuminating the whole kinetic behavior of Kv1.3 channels, was successfully established. All the parameters in model were listed in Table 1.
Scorpion toxin ADWX-1 is a pore blocker of Kv1.3 channel without affecting its kinetics
As we reported previously, the engineered scorpion toxin ADWX-1 is a potent specific inhibitor of Kv1.3. It has the highest affinity in,pM to Kv1.3 channels [17]. In Fig. 3A–B, 30 pM ADWX-1 blocked the Kv1.3 currents without changing the G-V curve (Fig. 3C) and the time constants of activation and inactivation (Fig. 3D). This means that the inhibition by ADWX-1 only reduces the number of open channels without affecting the channel kinetics. In other words, we can explore the
Figure 1. Comparison of the kinetic characteristics of Kv1.3 channels between the experimental data and simulations.(A) Kinetic model for Kv1.3 channels. The voltage-dependent ratesa,b,gandQare in an exponential form, in which the a, b, c and d are the pre-exponential factor in ms21
and the m, n, p and q are the exponential factor in mV; the rates A and B are constants in ms21
; the v is voltage in mV. (B) The activation currents of Kv1.3 channels expressed in HEK 293 cells were recorded from a whole-cell patch. Activation was elicited by voltage steps from
270 to+50 mV with increment of 15 mV from holding potential at290 mV applied every 90 s. The voltage protocol is plotted at the bottom. Red lines are model simulations (N = 7465). (C) Steady-state inactivation was determined by measuring the peak current at+50 mV, following the 60-s
pre-conditional pulses between280 mV and210 mV in increments of 5 mV. The voltage protocol is plotted at the bottom. Red lines are model simulations (N = 4518). (D) Cells were depolarized to+50 mV for 7 ms from a holding290 mV and then repolarized to various voltages between
2100 and230 mV in increments of 10 mV. The voltage protocol is placed at the bottom. Red lines are model simulations (N = 4605). (E) Statistics of activation and steady-state inactivation. For activation, V50=228.461.6 mV, s = 4.960.5 mV (n = 9); for inactivation, V50=243.56 3.7 mV, s = 3.060.3 mV (n = 5). (F) Time constants of activation (n = 9) and inactivation (n = 5) were plotted as the function of voltages. (G) Time constants of deactivation (n = 10) were plotted as the function of voltages. The red and black lines (or symbols) are for the simulations and experimental data, respectively.
Kv1.3 role in T cell by simply changing the number of Kv1.3 channels in applying with different ADWX-1 concentrations.
Inhibition and characterization of Kv1.3 channels in T cells
Based on the sequential kinetic model of Kv1.3 channels, their inhibition features were further investigated in T cells. We first examined the voltage-activated currents in T cells in the absence and presence of 30 and 300 pM ADWX-1. Our results demonstrated that the slow inactivated currents were sensitive to ADWX-1 (Fig. 4A). And after applying 300 pM ADWX-1 to T cell, there is little outward current left at 50 mV, indicating that Kv1.3 current was the major prominent of outward current in this case. In current-clamp experiments, we also found that the membrane potentials of T cells rapidly went to depolarization direction by 15 pA current injection while Kv1.3 channel were inhibited by ADWX-1 (Fig. 4B, green and blue), in contrast, the membrane potential changed much slowly without ADWX-1 (Fig. 4B, black).
To better understand the regulatory mechanism of Kv1.3 channels in T cells, we constructed a model T-cell, composed of
Figure 2. Comparison of the recovery of Kv1.3 channels between the experimental data and simulations.(A–B) The representative currents of recovery from inactivation were obtained in whole-cell patch mode at290 mV and245 mV. Two-pulse protocol: from a holding potential of290 mV, the first pulse 1 (P1) was applied for 1 s at+50 mV, and then the second+50-mV pulse (P2) was applied for 150 ms after a
variable interpulse interval at290 mV in (A) and245 mV in (B). The detailed recovery currents are shown in the box. The voltage protocol is placed at the bottom. Red lines are fits and black ones are data. The channel numbers for simulations are 3788 for290 mV and 2740 for245 mV. (C) Comparison of the time courses of recovery between the experimental data (black) and the simulations (red) at2100 mV,290 mV,280 mV and
245 mV. (D) Comparison of time constants of recovery between the experimental data (black) and the simulations (red). The time constants of recovery (mean6SEM) are 8.662.7 s (n = 5) at245 mV, 15.661.6 s (n = 3) at280 mV, 14.662.4 s (n = 7) at290 mV, 14.664.7 s (n = 3) at2100 mV, respectively.
doi:10.1371/journal.pone.0089975.g002
Table 1.Parameters of Kv1.3 model.
Parameter Values
a 0.448(ms21)
b 0.043(ms21)
c 0.003(ms21)
d 0.00008(ms21)
A 280.035(ms21)
B 1.648(ms21)
m 27.530(mV)
n 17.528(mV)
p 174.961(mV)
q 1016.330(mV)
the Kv1.3 channel, Ca2+
-release activated calcium (CRAC) channel, intermediate K+
(IK or KCa3.1) channel and leak K+(TASK) channel [3], to simulate the membrane potentials in a T cell, based on the Eq. (3–5) and the open probability Poof each channels (See the Methods and Materials). For more precise, we calculated the time- and voltage-dependent total conductance of Kv1.3 via the open probability Poof Kv1.3 kinetic model rather than via the formulized term m3h in classic Hodgkin-Huxley model (See Eq. (4)). Essentially, they are the same. According to this T-cell model, our simulations revealed that the total conductance of Kv1.3 was 4.5 nS (NKv1.3 ,300) for control, 2.0 nS (NKv1.3 ,133) for 30 nM ADWX-1 and 0.4 nS (NKv1.3 ,27) for 300 pM ADWX-1 (Fig. 4B). The corresponding membrane potential depolarization property in these situations depended on the number of Kv1.3 channels, indicating that Kv1.3 played a dominative role in maintaining the membrane potential of T cells. In order to further validate the accuracy of the Kv1.3 channel model and T cell model, we used one membrane potential trace recorded from a T cell as a voltage command to stimulate the other T cells, then we obtained a hump-shaped Kv1.3 current, which could be well reproduced by the Kv1.3 kinetic model, by using the same voltage command (Fig. 4C). This showed that the Kv1.3 current started to be activated at about240 mV and then reached to the maximum at,40 mV, and finally decreased to the minimum at more positive voltages due to inactivation. In this simulation, we found that the number of Kv1.3 was about 330, consistent to the previous report [3]. Note that here we subtracted
the background current by applying with 1 nM ADWX-1 to get the pure Kv1.3 current.
The membrane potential of T cells is governed by Kv1.3 channels
As the T cell is a secretory cell [48], it is important to know the intracellular local and global Ca2+
signaling. Preferably, it is to know the local Ca2+
signaling inside T cells. Since the I-V curve of CRAC channel is substantially linear and the membrane potential is the only driving force to promote the Ca2+
influx [26–28], we first calculated the membrane potentials in a model T-cell containing different amount of Kv1.3 channels. Fig. 4D illustrated that the changes in membrane potentials of T cells clearly depended on the total conductance (or number) of Kv1.3 channels. Here we chose several typical numbers of Kv1.3 channel in T cell. For example, the total conductance of 22.5 nS implied the number of Kv1.3 was 1500 as a single-channel conductance of Kv1.3 was 15 pS [36]. An activated T cell with 1500 Kv1.3 channels could be considered as an effector memory TEMcell [3].
Afterwards, we further calculated the corresponding local calcium signaling based on Eq. (5). The calculated Ca2+
signaling exhibited a Ca2+
peak at negative potentials, following by a lower Ca2+
plateau at positive potentials (Fig. 4E). The maximal local Ca2+
concentration around vesicles is up to over 20mM, which would be sufficient to induce T-cell exocytosis [45]. Our results
Figure 3. The ADWX-1 toxin blocked the Kv1.3 currents without changing the channel kinetics.(A–B) Kv1.3 activation currents were recorded before (black) and after (red) applying with 30 pM ADWX-1. Voltage protocol is placed at the top. (C) The activation G-V curves of Kv1.3 (n = 6), before (black) and after (red) applying with 30 pM ADWX-1. (D) The time constants of activation and inactivation of Kv1.3 (n = 6), before (black) and after (red) applying with 30 pM ADWX-1.
revealed that the Ca2+ signaling strongly depended on the numbers of Kv1.3 channel. The larger amount of Kv1.3 had the higher Ca2+plateau. In other words, the less Kv1.3, the less [Ca2+]
i for secretion, suggesting that a T cell lacking of Kv1.3 might lose function. Recently, it was found that the Kv1.3 knockout mice produced lower incidence and severity of T cell-mediated autoimmune encephalomyelitis [49], which was in line with our proposed model that the less Kv1.3 channels would inhibit the calcium entry into T cells and likely further affected the cytokine production. The Kv1.3, IK and CRAC currents in the cases of Figure 4 D–4E were shown in Figure 1. Note that the inactivation property of Kv1.3 channel caused a pseudomorph paradox of the larger conductance conferring the smaller currents, which was actually derived from the smaller open probability due to inactivation of Kv1.3 channel. Nevertheless, KV1.3 currents were still much larger than others, indicating that neither CRAC
nor IK could significantly affect membrane potentials as KV1.3 could. This also suggested that the intracellular Ca2+ was dominated by Kv1.3 channels.
The CRAC channel was triggered by IP3-induced depletion of the ER Ca2+
store [18–20]. In Fig. 4F, however, we found that the 60% lower osmolarity solution induced a global augment of intracellular Ca2+
in T cells, consistent to the report by Ross and Cahalan [40]. The low osmolarity solution activated a swelling-activated Cl2 (Cl
swell) channel by swelling T cell, leading depolarization of T cell [3,50,51]. The time course of the global Ca2+concentration showed a Ca2+peak at beginning, following by the higher Ca2+plateau, comparable with that as predicted by the model T cell (Fig. 4E). Obviously, the slow effect of the regulatory volume decrease (RVD) could not be the major reason for the Ca2+decay in seconds, because it occurred in minutes. Addition-ally, it was not clear whether the low osmolarity can directly
Figure 4. The number of Kv1.3 channels regulates the membrane potential of native T lymphocyte cells.(A) The Kv1.3 currents in a T lymphocyte cell, bathed in normal saline, were stimulated by a voltage step from2100 to 50 mV in the whole-cell mode, in the presence of 0 (black), 30 (blue) and 300 (green) pM ADWX-1. The inset shows a picture of a T cell. The measured membrane capacitanceCm= 1.52 pF. The voltage protocol
is placed at the bottom. (B) A T lymphocyte cell showed the changes in membrane potentials by an injection current of 15 pA, in the presence of 0 (black), 30 (blue) and 300 (green) pM ADWX-1, respectively. A model T cell, composed of Kv1.3, CRAC, IK and TASK channels, conferred the simulations (red) corresponding to the changes of membrane potentials resulted from the Kv1.3 conductance of 0.4, 2.0 and 4.5 nS, respectively. The resting potential of model cells was255 mV. (C) The Kv1.3 currents from a native T lymphocytes cell (black) and a model T lymphocytes cell (red) were respectively elicited by a voltage command (cyan), conferring a number of Kv1.3 n = 330. Here the background currents were subtracted by 1 nM ADWX-1. (D) Simulation for membrane potentials in a model T cell stimulated by an injection current of 15 pA, while varying the number of Kv1.3 channels. The steady-state values (Vss) of membrane potentials went up to 35.7 mV for 0.4 nS (dark blue), 19.8 mV for 2 nS (green),20.62 mV for 4.5 nS (dark yellow),235.9 mV for 9 nS (pink) and243.1 mV for 22.5 nS (light blue) at the time of 10 s (gray dotted line), respectively. (E) Simulations of intracellular calcium concentrations with the different numbers of Kv1.3 channels. The steady-state calcium concentrations [Ca2+]
ss were 3.48mM for 0.4 nS (dark blue), 4.89mM for 2 nS (green), 7.01mM for 4.5 nS (dark yellow), 10.47mM for 9 nS (pink) and 11.48mM for 22.5 nS
trigger the opening of the CRAC channel or stretch-activated cation channel with a reversal potential Vrev<0 mV. For simulation, there was actually no essential difference between the open of CRAC and stretch-activated cation channels at about
240 mV (,0 mV) in applying with the lower osmolarity solution [3], because the calcium influx derived from either the CRAC or cation channel was governed by Kv1.3 channels.
Discussion
The effector memory TEMcell, composed of Kv1.3highKCa3.1low has been confirmed for several human autoimmune diseases, such as multiple sclerosis (MS), type 1 diabetes mellitus (T1DM) and rheumatoid arthritis (RA) [5–7]. The Kv1.3 voltage-gated potassi-um channel regulates membrane potential and calcipotassi-um signaling in TEM cells that are key mediators of autoimmune diseases, a thoroughly studying the physiological role of Kv1.3 channel plays in T cell not only helps to understand the working mechanism of T cell, but also provide a crucial clue for treatment of diseases.
In this study, we systematically studied the basic characteristics of Kv1.3 channel and constructed a sequential kinetic model capable to precisely replicate all the kinetics of this channel. Moreover, we examined the Kv1.3 currents in T lymphocyte cell by a specific inhibitor ADWX-1 toxin, consistent to that of expressed in HEK293. To explore the physiological role of Kv1.3 channel, we further built a T model cell, which was composed of four basic channels prominently in T lymphocyte cell. Finally, we demonstrated that the Kv1.3 channels could dominate the membrane potentials of T lymphocyte cell, and that the CRAC channels manipulated the intracellular Ca2+
signaling along with changes of membrane potentials.
Using the model T-cell composed of four channels, we have examined the mechanism of Kv1.3 channel regulating T lymphocyte cells. Actually, a couple of channels, i.e., TRPM7, Osmo-activated Cl2(Cl
swell), and TRPC3/6 were excluded from this T-cell model. The TRPM7 (or a Mg2+
-inhibitor-Ca2+ (MIC) permeable channel) is a stretch- and swelling-activated cation channel, which can be activated by PIP2and inhibited by Mg
2+
[52,53]. The Clswell channel conducts an outwardly rectifying chloride current (or volume-regulated anion current), leading an anion and osmolyte efflux that is activated by cell swelling [54]. In our experiments, TRPM7 current was blocked by intracellular 2.5 mM Mg2+
. Besides CRAC channel, TRPC3/6 channels provide another Ca2+entry pathway, but it seems that these two
channels are little expressed in T cells, the amplitude of TRPC3 inward current is only around 2 pA/pF (or 1–3 pA/cell) at
250 mV [55], which could be neglected in our model, so the model T-cell composed of four basic channels is thus good enough for this work.
During the whole depolarization process of membrane poten-tials, CRAC contributes much less current than that of Kv1.3, due to the small total conductance of 0.09 nS compared with,4.5 nS of Kv1.3. And the membrane potential was much less sensitive to the CRAC channel conductance in simulations, suggesting that Kv1.3 played the key role in dominating membrane potentials in T cells. While CRAC channel was the major Ca2+
source in T cells, which provides a continuous calcium influx to elevate the intracellular Ca2+
level for T-cell exocytosis. With TASK channels together, Kv1.3 channels also play a role in maintaining the rest potential.
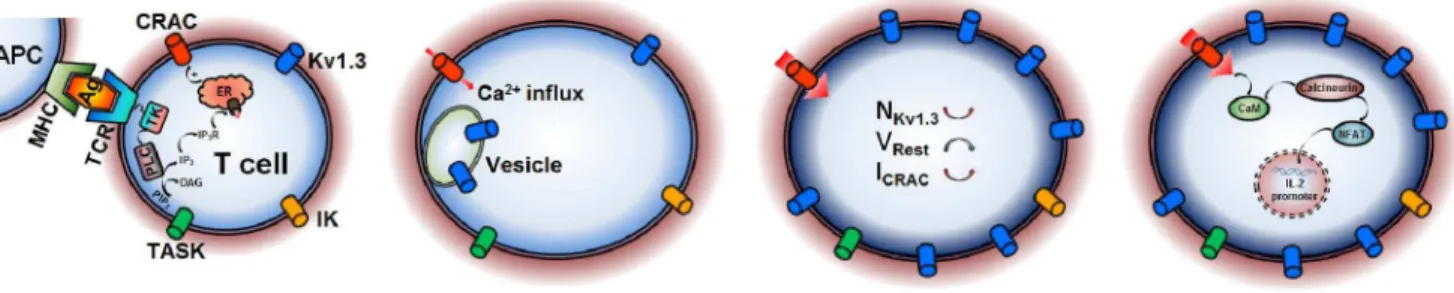
In this study, we identified the physiological role of Kv1.3 channels, which further provided us an opportunity to better understand the activation mechanism of T cells. How can a CRAC channel in a T cell be activated following antigen stimulation? In Fig. 5, a cartoon shows that an activated T cell increases the surface expression of Kv1.3, to negative-shift the membrane potential to increase the intracellular Ca2+
via CRAC channels, and finally to start the IL-2 (interleukin 2) promoter production program [3]. This process is more like a positive feedback [3,18], possibly terminated by endocytosis due to internationalization of Kv1.3 channels. This will decrease the number of Kv1.3 on plasma membrane to lead T cell gradually return to its resting state again.
In this study, we provided a precise model of Kv1.3 and a novel non-excitable model cell for quantitatively investigating the regulatory mechanism of T cell, which laid a solid basis for further studying other channel such as IK, TASK roles in T cell and the events of membrane potentials, calcium signaling and secretion in other non-excitable cells such as TCM, B and sperm cells.
Author Contributions
Conceived and designed the experiments: JD YW RZ PH. Performed the experiments: RZ PH YL JF WW. Analyzed the data: RZ PH WW. Contributed reagents/materials/analysis tools: JF YL WW. Wrote the paper: JD YW RZ PH.
Figure 5. A putative activation mechanism of T cells.Motile polarized T cells naturally use their T-cell receptor (TCR) to come into contact with antigen(Ag)-presenting cell (APC) via peptide–major histocompatibility complex (MHC); T cells tagged activate the smaller amount of Ca2+influx via CRAC channel, probably evoked by IP3-induced depletion of Ca2+stores, to slightly increase the expression of Kv1.3; more Ca2+influx via CRAC channel enters into T cell due to membrane repolarization by augment of Kv1.3; The higher Ca2+in T cell triggers the IL-2 promoter production program.
References
1. DeCoursey TE, Chandy KG, Gupta S, Cahalan MD (1984) Voltage-gated K+
channels in human T lymphocytes: a role in mitogenesis? Nature 307: 465–468. 2. Cahalan MD, Chandy KG, DeCoursey TE, Gupta S (1985) A Voltage-gated
potassium channel in human T lymphocytes. J Physiol 358: 197–237. 3. Cahalan MD, Chandy KG (2009) The functional network of ion channels in T
lymphocytes. Immun Rev 231: 59–87.
4. Chandy KG, Cahalan MD, Grissmer S (1990) Autoimmune diseases linked to abnormal K+ channel expression in double-negative CD4 CD8 T cells. Eur J Immunol 20: 747–751.
5. Wulff H, Calabresi PA, Allie R, Yun S, Pennington M, et al. (2003) The voltage-gated Kv1.3 K+channel in effector memory T cells as new target for MS. J Clin Invest 111: 1703–1713.
6. Rus H, Pardo CA, Hu L, Darrah E, Cudrici C, et al. (2005) The voltage-gated potassium channel Kv1.3 is highly expressed on inflammatory infiltrates in multiple sclerosis brain. Proc Natl Acad Sci USA 102: 11094–11099. 7. Varga Z, Hajdu P, Panyi G (2010) Ion channels in T lymphocytes: an update on
facts, mechanisms and therapeutic targeting in autoimmune diseases. Immunol Lett 130: 19–25.
8. Toldi G, Bajnok A, Dobi D, Kaposi A, Kova´cs L, et al. (2013) The effects of Kv1.3 and IKCa1 potassium channel inhibition on calcium influx of human peripheral T lymphocytes in rheumatoid arthritis. Immunobiology 218: 311– 316.
9. Bajnok A, Kaposi A, Kova´cs L, Va´sa´rhelyi B, Balog A, et al. (2013) Analysis by flow cytometry of calcium influx kinetics in peripheral lymphocytes of patients with rheumatoid arthritis. Cytometry A 83: 287–293.
10. Beeton C, Wulff H, Standifer NE, Azam P, Mullen KM, et al. (2006) Kv1.3 channels are a therapeutic target for T cell-mediated autoimmune diseases. Proc Natl Acad Sci USA 103: 17414–17419.
11. Panyi G, Possani LD, Rodrı´guez de la Vega RC, Ga´spa´r R, Varga Z (2006) K+
channel blockers: novel tools to inhibit T cell activation leading to specific immunosuppression. Curr Pharm Des 12: 2199–2220.
12. Marom S, Levitan IB (1994) State-dependent inactivation of the Kv3 potassium channel. Biophys J 67: 579–589.
13. Panyi G, Sheng Z, Deutsch C (1995) C-type inactivation of a voltage-gated K+
channel occurs by a cooperative mechanism. Biophys J 69: 896–903. 14. Levy DI, Deutsch C (1996) Recovery from C-type inactivation is modulated by
extracellular potassium. Biophys J 70: 798–805.
15. Anangi R, Koshy S, Huq R, Beeton C, Chuang WJ, et al. (2012) Recombinant expression of margatoxin and agitoxin-2 in Pichia pastoris: an efficient method for production of KV1.3 channel blockers. PLoS One 7: e52965.
16. Rashid MH, Heinzelmann G, Huq R, Tajhya RB, Chang SC, et al. (2013) A potent and selective Peptide blocker of the kv1.3 channel: prediction from free-energy simulations and experimental confirmation. PLoS One 8: e78712. 17. Han S, Yi H, Yin SJ, Chen ZY, Liu H, et al. (2008) Structural basis of a potent
peptide inhibitor designed for Kv1.3 channel, a therapeutic target of autoimmune disease. J BiolChem 283: 19058–19065.
18. Verheugen JA, Vijverberg HP (1995) Intracellular Ca2+ oscillations and membrane potential fluctuations in intact human T lymphocytes: role of K+
channels in Ca2+signaling. Cell Calcium 17: 287–300.
19. Cabado AG, Despa S, Botana MA, Vieytes MR, Gonza´lez M, et al. (1999) Membrane potential changes associated with calcium signals in human lymphocytes and rat mast cells. Life Sci 64: 681–696.
20. Prakriya M, Feske S, Gwack Y, Srikanth S, Rao A, et al. (2006) Orai1 is an essential pore subunit of the CRAC channel. Nature 443: 230–233. 21. Feske S, Giltnane J, Dolmetsch R, Staudt LM, Rao A (2001) Gene regulation
mediated by calcium signals in T lymphocytes. Nat Immunol 2: 316–324. 22. Maltsev VA (1990) Oscillating and triggering properties of T cell membrane
potential. Immunol Lett 26: 277–282.
23. Maltsev VA (1992) A negative resistance region underlies the triggering property of membrane potential in human T-lymphocytes. Cell Signal 4: 697–707. 24. Nicolaou SA, Szigligeti P, Neumeier L, Lee SM, Duncan HJ, et al. (2007)
Altered dynamics of Kv1.3 channel compartmentalization in the immunological synapse in systemic lupus erythematosus. J Immunol 179: 346–356. 25. Marek N, Mysliwska J, Raczyn´ska K, Trzonkowski P (2010) Membrane
potential of CD4+T cells is a subset specific feature that depends on the direct cell-to-cell contacts with monocytes. Hum Immunol 71: 666–675.
26. Sarkadi B, Tordai A, Gfirdos G (1990) Membrane depolarization selectively inhibits receptor-operated calcium channels in human T (Jurkat) lymphoblasts. Biochim Biophys Acta 1027: 130–140.
27. Sarkadi B, Tordai A, Miiller M, Giirdos G (1990), Regulation of stimulus-induced calcium transport pathways in human T (Jurkat) lymphoblasts. Mol Immunol 27: 1297–1306.
28. Randriamampita C, Bismuth G, Debre´ P, Trautmann A (1991) Nitrendipine induced inhibition of calcium influx in a human T-cell clone: role of cell depolarization. Cell Calcium 12: 313–323.
29. Wang W, Xiao F, Zeng X, Yao J, Yuchi M, et al. (2012) Optimal estimation of ion-channel kinetics from macroscopic currents. PLoS One 7: e35208. 30. Hodgkin AL, Huxley AF (1952) A quantitative description of membrane current
and its application to conduction and excitation in nerve. J Physiol 117: 500– 544.
31. Sun L, Xiong Y, Zeng X, Wu Y, Pan N, et al. (2009) Differential regulation of action potentials by inactivating and noninactivating BK channels in rat adrenal chromaffin cells. Biophys J 97: 1832–1842.
32. Pahapill PA, Schlichter LC (1992) Modulation of potassium channels in intact human T lymphocytes. J Physiol 445: 407–430.
33. Verheugen JA, Vijverberg HP, Oortgiesen M, Cahalan MD (1995) Voltage-gated and Ca(2+)-activated K+ channels in intact human T lymphocytes. Noninvasive measurements of membrane currents, membrane potential, and intracellular calcium. J Gen Physiol 105: 765–794.
34. Aller MI, Veale EL, Linden AM, Sandu C, Schwaninger M, et al. (2005) Modifying the subunit composition of TASK channels alters the modulation of a leak conductance in cerebellar granule neurons. J Neurosci 25: 11455–11467. 35. Meuth SG, Bittner S, Meuth P, Simon OJ, Budde T, et al. (2008) TWIK-related
acid-sensitive K+ channel 1 (TASK1) and TASK3 critically influence T lymphocyte effector functions. J BiolChem 283: 14559–14570.
36. Lewis RS, Cahalan MD (1995) Potassium and calcium channels in lymphocytes. Annu Rev Immunol 13: 623–653.
37. Grissmer S, Dethlefs B, Wasmuch JJ, Goldin AL, Gutman GA, et al. (1990) Expression and chromosomal localization of a lymphocyte K+channel gene. Proc Natl Acad Sci USA 87: 9411–9415.
38. Grissmer S, Nguyen AN, Cahalan MD (1993) Calcium-activated potassium channels in resting and activated human T lymphocytes. Expression levels, calcium dependence, ion selectivity, and pharmacology. J Gen Physiol 102: 601– 630.
39. Fakler B, Adelman JP (2008) Control of K(Ca) channels by calcium nano/ microdomains. Neuron 59: 873–881.
40. Ross PE, Cahalan MD (1995) Ca2+
influx pathways mediated by swelling or stores depletion in mouse thymocytes. J Gen Physiol 106: 415–444. 41. Chen YA, Scales SJ, Patel SM, Doung YC, Scheller RH (1999) SNARE
complex formation is triggered by Ca(2+) and drives membrane fusion. Cell 97: 165–174.
42. Naraghi M, Neher E (1997) Linearized Buffered Ca(2+) Diffusion in microdomains and its implications for calculation of [Ca2+] at the mouth of a calcium channel. J Neurosci 17: 6961–6973.
43. Beeler GW, Reuter H (1977) Reconstruction of the action potential of ventricular myocardial fibres. J Physiol 268: 177–210.
44. Ekeberg O, Walle´n P, Lansner A, Tra˚ve´n H, Brodin L, et al. (1991) A computer based model for realistic simulations of neural networks. I. The single neuron and synaptic interaction. Biol Cybern 65: 81–90.
45. Zhou Z, Misler S, Chow RH (1996) Rapid fluctuations in transmitter release from single vesicles in bovine adrenal chromaffin cells. Biophys J 70: 1543–1552. 46. Cai YC, Osborne PB, North RA, Dooley DC, Douglass J (1992) Character-ization and functional expression of genomic DNA encoding the human lymphocyte type n potassium channel. DNA Cell Biol 11: 163–172. 47. Deutsch C, Chen LQ (1993) Heterologous expression of specific K+channels in
T lymphocytes: functional consequences for volume regulation. Proc Natl Acad Sci USA 90: 10036–10040.
48. Huse M, Lillemeier BF, Kuhns MS, Chen DS, Davis MM (2006) T cells use two directionally distinct pathways for cytokine secretion. Nat Immunol 7: 247–255. 49. Gocke AR, Lebson LA, Grishkan IV, Hu L, Nguyen HM, et al. (2012) Kv1.3 deletion biases T cells toward an immunoregulatory phenotype and renders mice resistant to autoimmune encephalomyelitis. J Immunol 188: 5877–5886. 50. Deutsch C, Lee SC (1988) Cell volume regulation in lymphocytes. Renal.
PhysioL Biochem 3: 260–276.
51. Lewis RS, Ross PE, Cahalan MD (1993) Chloride channels activated by osmotic stress in T lymphocytes. J Gen Physiol 101: 801–826.
52. Numata T, Shimizu T, Okada Y (2007) TRPM7 is a stretch- and swelling-activated cation channel involved in volume regulation in human epithelial cells. Am J Physiol Cell Physiol 292: C460–C467.
53. Prakriya M, Lewis RS (2002) Separation and characterization of currents through store-operated CRAC channels and Mg2+-inhibited cation (MIC) channels. J Gen Physiol 119: 487–507.
54. Cahalan MD, Lewis RS (1988) Role of potassium and chloride channels in volume regulation by T lymphocytes. Soc Gen PhysiolSer 43: 281–301. 55. Philipp S, Strauss B, Hirnet D, Wissenbach U, Mery L, et al. (2003) TRPC3