ACPD
15, 19197–19238, 2015Changes in chemical components of aerosol particles in
different haze regions in China
X. Y. Zhang et al.
Title Page
Abstract Introduction
Conclusions References
Tables Figures
◭ ◮
◭ ◮
Back Close
Full Screen / Esc
Printer-friendly Version Interactive Discussion
Discussion
P
a
per
|
Discussion
P
a
per
|
Discussion
P
a
per
|
Discussion
P
a
per
|
Atmos. Chem. Phys. Discuss., 15, 19197–19238, 2015 www.atmos-chem-phys-discuss.net/15/19197/2015/ doi:10.5194/acpd-15-19197-2015
© Author(s) 2015. CC Attribution 3.0 License.
This discussion paper is/has been under review for the journal Atmospheric Chemistry and Physics (ACP). Please refer to the corresponding final paper in ACP if available.
Changes in chemical components of
aerosol particles in di
ff
erent haze regions
in China from 2006 to 2013 and
contribution of meteorological factors
X. Y. Zhang, J. Z. Wang, Y. Q. Wang, H. L. Liu, J. Y. Sun, and Y. M. Zhang
Key Laboratory of Atmospheric Chemistry, Institute of Atmospheric Compositions, Chinese Academy of Meteorological Sciences, CMA, 46 Zhong Guan Cun S. Ave.,
Beijing 100081, China
Received: 29 May 2015 – Accepted: 17 June 2015 – Published: 13 July 2015
Correspondence to: X. Y. Zhang ([email protected])
ACPD
15, 19197–19238, 2015Changes in chemical components of aerosol particles in
different haze regions in China
X. Y. Zhang et al.
Title Page
Abstract Introduction
Conclusions References
Tables Figures
◭ ◮
◭ ◮
Back Close
Full Screen / Esc
Printer-friendly Version Interactive Discussion
Discussion
P
a
per
|
Discussion
P
a
per
|
Discussion
P
a
per
|
Discussion
P
a
per
Abstract
Since individuals experienced persistent haze-fog events in January 2013 in central-eastern China, questions on factors causing differences in drastic changes in 2013 from those in adjacent years have been raised. Changes in major chemical compo-nents of aerosol particles over the years also remain unclear. The extent of
meteoro-5
logical factors contributed to such changes is yet to be determined. The study intends to present the changes in daily-based major water-soluble constituents, carbonaceous species and mineral aerosol in PM10 at 13 stations within different haze regions in
China from 2006 to 2013, associated with specific meteorological conditions that are highly related with aerosol pollution (parameterized as an index called “PLAM”). No
10
obvious changes were found in annual mean concentrations of these various chemical components and PM10in 2013, relative to 2012. By contrast, wintertime mass of these
components were quite different, in Hua Bei Plain (HBP), sulfate, OC, nitrate, ammo-nium, EC, and mineral dust concentrations in winter were approximately 43, 55, 28, 23, 21 and 130 µg m−3
, respectively; these masses were approximately two to four times
15
higher than those in background mass, also exhibiting a decline during 2006 to 2010, and then a rise till 2013. The mass of these concentrations and PM10, except mineral,
respectively increased by approximately 28 to 117 and 25 % in January 2013 com-pared with that in January 2012. Thus, persistent haze-fog events occurred in January 2013, and approximately 60 % of this increase in component concentrations from 2012
20
to 2013 can be attributed to severe meteorological conditions in the winter of 2013. In Yangtzi River Delta (YRD) area, winter masses of these components, unlike HBP, did not significantly increase since 2010; PLAM was also maintained at a similar level with-out significant changes. In the Pearl River Delta (PRD) area, the regional background concentrations of the major chemical components were similar to those in YRD;
ac-25
me-ACPD
15, 19197–19238, 2015Changes in chemical components of aerosol particles in
different haze regions in China
X. Y. Zhang et al.
Title Page
Abstract Introduction
Conclusions References
Tables Figures
◭ ◮
◭ ◮
Back Close
Full Screen / Esc
Printer-friendly Version Interactive Discussion
Discussion
P
a
per
|
Discussion
P
a
per
|
Discussion
P
a
per
|
Discussion
P
a
per
|
teorological conditions and the emission cutting with an emphasis on coal-combustion in this area.
In addition to the scattered and centralized coal-combustion for heating, burning biomass fuel contributed to the large increase in the concentrations of carbona-ceous aerosol in major haze regions, except in PRD, in winter. No obvious changes
5
were found for the proportions of each chemical components of PM10 from 2006 to
2013. Among all of the emissions recorded in chemical compositions in 2013, coal-combustion was still the largest anthropogenic source of aerosol pollution in various areas in China, with higher sulphate proportion of PM10 in most areas of China. OC normally ranked the third. PM10concentration increased by approximately 25 % in
Jan-10
uary of 2013 relative to 2012 that caused persistent haze-fog events in HBP; emis-sion also reduced by approximately 35 % in Beijing and its vicinity (BIV) in late fall of 2014, thereby producing “APEC” blue; thus one can expect that the persistent haze-fog events would be reduced significantly in the BIV, if∼one-third of the 2013 winter
emission could be reduced, which can also be viewed as the upper limit of atmospheric
15
aerosol pollution capacity in this area.
1 Introduction
From satellite-based aerosol optical depth, ambient fine particulate matter concentra-tions were found to have a high loading area with China as major body in the word (Donkelaar and Villeneuve, 2010). Globally, mass concentrations of six major types of
20
chemical components in aerosol particles in China were also found to be just lower than those in urban S. Asian area but far higher than those in Europe and N. Amer-ica (Zhang et al., 2012a), with large variation in time and space (He et al., 2001; Hu et al., 2002; Yao et al., 2002; Ye et al., 2003; Zhang et al., 1993, 2002, 2008; Li et al., 2014; Xu et al., 2014; Yin et al., 2012). Moreover, approximately 37.5 billion tons of
25
Be-ACPD
15, 19197–19238, 2015Changes in chemical components of aerosol particles in
different haze regions in China
X. Y. Zhang et al.
Title Page
Abstract Introduction
Conclusions References
Tables Figures
◭ ◮
◭ ◮
Back Close
Full Screen / Esc
Printer-friendly Version Interactive Discussion
Discussion
P
a
per
|
Discussion
P
a
per
|
Discussion
P
a
per
|
Discussion
P
a
per
cause the aerosol particles and cloud (fog) droplet can influences atmospheric visibility (Watson, 2002); and in the ambient atmosphere, no cloud (fog) can be formed if no hy-groscopic aerosols can be activated to cloud condensation nuclei (CCN) or ice nuclei (IN) (Twomey, 1977; Seinfeld and Pandis, 1997), high loadings of aerosols not only affect climate change (Forster et al., 2007; Boucher et al., 2013), but also adversely
in-5
fluence weather (Wang et al., 2010; Pérez et al., 2006) and contribute to the occurrence of haze and fog events; both of them can be considered as types of aerosol pollution in present day China (Zhang et al., 2013). Since individuals experienced persistent haze-fog events in January 2013 in central-eastern China, the change of aerosol particles and their chemical component are attracting special attentions in this rapid economic
10
growth and high population density area (Huang et al., 2014; Zhang et al., 2013; Guo et al., 2014; H. Wang et al., 2014; X. Wang et al., 2014; Z. Wang et al., 2014; Wang et al. 2015; Sun et al., 2014). However, questions was raised about what changes hap-pened to the major chemical components of aerosol in different haze areas in China during recently year? Why a big difference existed in 2013 and an adjacent year in
15
the case of no significant changes in emission? What extent of meteorological factors contributed to the change?
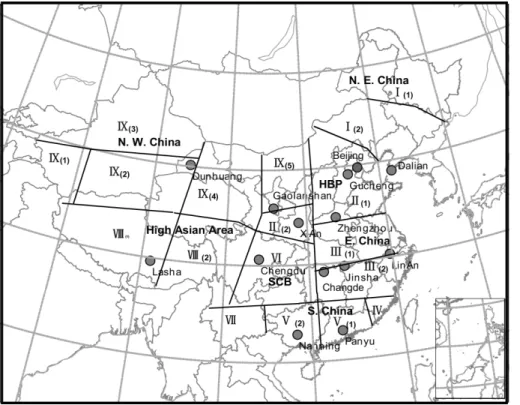
China can be classified into nine typical regions with similar visibility changes in each (Zhang et al., 2012a); four of these regions have experienced the largest loss of visibility in recent decades, particularly (1) Hua Bei Plain in North China and Guanzhong Plain.
20
This region also includes “Jing–Jin–Ji” or called “Beijing–Tianjin–Hebei” (BTH) region with the rapid economic development; this area is also considered as Haze Region II in China, (2) East China with the main body in Yangtze River Delta area (Haze Region III), (3) South China comprising Guangdong and Pearl River Delta area (Haze Region V), (4) Si Chuan Basin in Southwest China (Haze Region VI) (Fig. 1). Changes in major
25
ACPD
15, 19197–19238, 2015Changes in chemical components of aerosol particles in
different haze regions in China
X. Y. Zhang et al.
Title Page
Abstract Introduction
Conclusions References
Tables Figures
◭ ◮
◭ ◮
Back Close
Full Screen / Esc
Printer-friendly Version Interactive Discussion
Discussion
P
a
per
|
Discussion
P
a
per
|
Discussion
P
a
per
|
Discussion
P
a
per
|
Various meteorological factors, including wind speed, wind direction, air pressure, temperature, humidity, precipitation, and atmosphere stability, are possibly related to aerosol pollution, but each meteorological factor cannot completely and quantita-tively indicate the integrated situation of meteorological conditions that may aggravate aerosol pollution (Sui et al., 2007; Pang et al., 2009). However, mechanisms by which
5
these meteorological impacts can be quantified and by which these data can be used to diagnose aerosol pollution based on a longer time scale of emission changes than meteorological factors (Wang et al., 2012; Yang, 2009).
Long-term daily-based aerosol chemical components were determined here for aerosol particles with diameter less than 10 µm (PM10) from regionally representative
10
measurement networks (China Atmosphere Watch network-CAWNET) from 2006 to 2013. The parameterized index (PLAM) (Wang et al., 2012; Yang, 2009) was also used in this study to evaluate specific meteorological conditions and their connections with severe aerosol pollution. This study investigates the changes and the extent of these changes by analyzing chemical component changes and meteorological factors; this
15
study also determined the relative contribution of specific meteorological conditions in winter. These chemical component data, especially in 2012 and 2013, can also be used as a basis to evaluate various control measures that have been used. After 2013, the Chinese government promoted ten prevention and countermeasures for aerosol pollu-tion control called “Atmospheric Pollupollu-tion Prevenpollu-tion and Control of the Ten Measures
20
of China.” The government also released the Second Atmospheric Pollution Control Special Plan. All these have gained increasing attention among researchers to reduce emission caused by aerosol with an emphasis on coal combustion and industrial man-ufacturing processes, mainly in steel mills, chemical plants, glass, and cement plants. The long-term chemical characterization of aerosols in China is also essential to
as-25
ACPD
15, 19197–19238, 2015Changes in chemical components of aerosol particles in
different haze regions in China
X. Y. Zhang et al.
Title Page
Abstract Introduction
Conclusions References
Tables Figures
◭ ◮
◭ ◮
Back Close
Full Screen / Esc
Printer-friendly Version Interactive Discussion
Discussion
P
a
per
|
Discussion
P
a
per
|
Discussion
P
a
per
|
Discussion
P
a
per
2 Sample collection and analyses
2.1 Sampling description
24 h aerosol filter samples were collected at 13 CAWNET stations on a one day in ev-ery three day basis from 2006 to 2013. These CAWNET stations are operated by the China Meteorological Administration (CMA), as shown in Fig. 1 and the details of these
5
stations have been reported in previous studies (Zhang et al., 2012a, 2008). Aerosol samples were collected by using MiniVol™air sampler (Airmetrics, Oregon USA) oper-ated at an ambient air flow rate of 5 L min−1
for 24 h from 9:00 a.m. to 9:00 a.m. (BST) the following day. The filtration media were 47 mm Whatman quartz microfibre filters (QM/A) that were cleaned by heating at 800◦C for 3 h before use.
10
2.2 Aerosol chemical component analyses
The elemental concentrations were analyzed directly via X-Ray Fluorescence (XRF) method using X-Lab 2000 (SPECTRO, Germany) at the Key Laboratory for Atmo-spheric Chemistry (LAC), Chinese Academy of Meteorological Sciences (CAMS). Eigh-teen elements, namely, As, Br, Ca, Cr, Cu, Fe, K, Mg, Mn, Na, Ni, Pb, S, Se, Ti, V, Zn
15
and Zr were analyzed using a Multi-Channel Analyzer that was calibrated using a stan-dard plastic sample to check the signal energy and the multi-channel twice a month. The XRF spectrometer includes a high-tech detector using a silicon lithium drifted crys-tal cooled at a low temperature (−90◦C). This crystal is able to discriminate between
X-ray photons of different energies, i.e. energy dispersion. Four different targets (Mo,
20
Co, Al2O3, and Highly Oriented Pyrolytic Graphite (HOPG)) with different energy are
employed to identify different elements. For the Mo target, the energy range is 25 keV, which is suitable for Cr, Mn, Fe, Co, Ni, Cu, Zn, As, Se, Br, Pb and Zr. The Al2O3target
with a working energy of 50 keV is deal for Cd, Sb and Ba while the Co target has an energy range of 12.5 keV for the analysis of K, Ca, Ti, V, Cr, Mn. The HOPG target’s
25
ACPD
15, 19197–19238, 2015Changes in chemical components of aerosol particles in
different haze regions in China
X. Y. Zhang et al.
Title Page
Abstract Introduction
Conclusions References
Tables Figures
◭ ◮
◭ ◮
Back Close
Full Screen / Esc
Printer-friendly Version Interactive Discussion
Discussion
P
a
per
|
Discussion
P
a
per
|
Discussion
P
a
per
|
Discussion
P
a
per
|
elements, i.e. As, Br, Ca, Cr, Cu, Fe, K, Mg, Mn, Na, Ni, Pb, S, Se, Ti, V, Zn and Zr, were analyzed by the Multi-Channel Analyzer. A standard glass sample (Spectro Corp. Germany) was used to check the signal energy and the multi-channel twice a month. The standard calibration curve between the intensity of signal and the elemental con-centration is determined by single-element Mylar filters. Seven blank quartz filters were
5
analyzed with Mylar matrices method. The averaged background of blank filters was subtracted during spectral processing. The detailed procedures at (LAC, CAMS) can be found in previous studies (Zhang et al., 2012a).
After XRF analysis, a portion of the filter samples was extracted with 25 mL of double-deionized water (DDI) using a 3′′
×5′′clean-room Poly bag (Clean Room Products, In.,
10
Ronkonkoma, NY). The resulting extracts were analyzed for SO2−
4 , NO
−
3, NH
+
4 and
other ionic species, including Na+, K+, Ca2+, Mg2+, F−and Cl− by ion chromatography (Dionex JCS 3000) with a OmniPac Pax-500 column, 25 mM H2SO4 autoregenerant,
gradient elution (from 5 to 28.75 mM NaOH/5 % methanol) at the Key Laboratory of Atmospheric Chemistry, CMA. The detailed protocol can be found in a previous study
15
(Zhang et al., 2002).
Thermal/optical reflectance carbon (TOR) analysis method for element carbon (EC) and organic carbon (OC) content was performed following the Interagency Monitor-ing of Protected Visual Environments (IMPROVE) protocol (Chow et al., 1993, 2004). The sample filter was heated stepwise at temperatures of 120 (OC1), 250 (OC2), 450
20
(OC3), and 550◦C (OC4) in a non-oxidizing (He) atmosphere, and at 550 (EC1), 700 (EC2), and 800◦
C (EC3) in an oxidizing atmosphere of 2 % oxygen and 98 % He. Evolved carbon is oxidized to CO2, and then reduced to CH4 for detection by FID. The pyrolyzed or charred OC is monitored by reflectance atλ=633 nm. The portion of EC1 until the laser signal returns to its initial value is assigned to pyrolyzed organic
25
ACPD
15, 19197–19238, 2015Changes in chemical components of aerosol particles in
different haze regions in China
X. Y. Zhang et al.
Title Page
Abstract Introduction
Conclusions References
Tables Figures
◭ ◮
◭ ◮
Back Close
Full Screen / Esc
Printer-friendly Version Interactive Discussion
Discussion
P
a
per
|
Discussion
P
a
per
|
Discussion
P
a
per
|
Discussion
P
a
per
2.3 Parameterized a index (PLAM) for evaluating specific meteorological condition that resulted in severe aerosol pollution
In this study, we used a parameterized index, namely, Parameter Linking Aerosol Pol-lution and Meteorological Elements (PLAM), which was derived from a relationship of PM10 and key meteorological parameters from 2000 to 2007 from various region of
5
China by our group. The PLAM index has been used to evaluate the contribution of meteorological factors to changes in atmospheric composition and optical properties over Beijing during the 2008 Olympic Games (Zhang et al., 2009), and to identify the contribution of specific meteorological factors to the ten-day haze-fog event in 2013 (Zhang et al., 2013). Based on a set of weather sensitive parameters, an integrated
10
index “PLAM” was parameterized (Wang et al., 2012; Yang, 2009). Among these fac-tors, high temperature, high humidity, moderate wind, and high stability were the most relevant to the poor air-quality in China. The PLAM was thus established as a function of the following parameters:
PLAM(F)∈f(p,t,w, rh,e,s,c′_,. . .) (1)
15
wherep,t,w, rh,e,s, andc_ represent air pressure, air temperature, winds, relative humidity, evaporability, stability, and effective parameter associated with the contribu-tion of air pollucontribu-tionβ(c′
), respectively.
A stable summer weather with high air temperature, high relative humidity, moderate winds, and stability might create a microenvironment for high PM10 concentrations in
20
August over Beijing (Yang, 2009), and this climate corresponds to static dynamic forc-ing (baroclinicity) and thermal forcforc-ing (equivalent potential temperature (θe) gradient) in moist adiabatic processes in the atmosphere (Gao et al., 2004). Part of the temper-ature profile is between the adiabatic lapse rate (neutral stability) and the isothermal lapse rate (Johnson and Baker, 1997). Condensation is also a key factor that
con-25
ACPD
15, 19197–19238, 2015Changes in chemical components of aerosol particles in
different haze regions in China
X. Y. Zhang et al.
Title Page
Abstract Introduction
Conclusions References
Tables Figures
◭ ◮
◭ ◮
Back Close
Full Screen / Esc
Printer-friendly Version Interactive Discussion
Discussion
P
a
per
|
Discussion
P
a
per
|
Discussion
P
a
per
|
Discussion
P
a
per
|
separate factors: (1) initial meteorological conditions α(m) associated with the atmo-spheric condensation processes and (2) a dynamic effective parameter associated with the initial contribution of air pollutionβ(c_) such as:
PLAM=α(m)×β′(c). (2)
The details have been described in the reference (Wang et al., 2012; Yang, 2009).
5
3 Results and discussion
3.1 Spatial distribution of chemical components
The CAWNET observational network covers all areas of China with 30 ground-based stations that have been operating since 2006. The concentrations of SO24−, OC, NO−3, NH+4, EC, and mineral aerosol were measured in this paper by using PM10 filter
sam-10
ples collected from 13 stations, which are located in Haze Region I (Dalian), Haze Re-gion II (Gucheng, Zhengzhou and XiAn), Haze ReRe-gion III (LinAn, Jinsha and Change), Haze Region V (Panyu and Nanjing), Haze Region VI (Chengdu), Haze Region VIII (Lasha, but data in this study were just from 2006 to 2010), and Haze Region IX (Gaolanshan and Dunhung) (Fig. 1, and Zhang et al., 2012a). Mineral aerosol was the
15
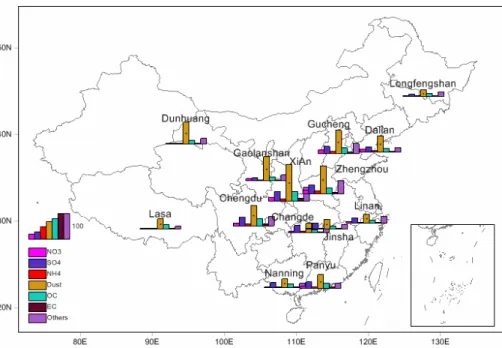
largest component in almost all stations based on the five-year average data from 2006 to 2010 (Fig. 2a). Thus, high “dust” is a character in aerosol pollution in China. In gen-eral, a high mineral concentration was observed in northwest China, thereby indicating the influence of dust from natural Asian dust sources. However, in the southern margin of the Loess Plateau in XiAn, the mineral level exceeded those in stations closer to
20
natural dust sources (Dunhuang, Galanshan etc). Thus, urban fly coal ash and fugitive dust sources were also observed to affect the mineral levels in these areas. Based on the measurement results of non-crustal Ca in coarse particle fractions, especially dur-ing non-sprdur-ing seasons (with fewer occurrences of Asian sand and dust storm (SDS)), part of the mineral dust is hypothesized to originate from construction activities and
ACPD
15, 19197–19238, 2015Changes in chemical components of aerosol particles in
different haze regions in China
X. Y. Zhang et al.
Title Page
Abstract Introduction
Conclusions References
Tables Figures
◭ ◮
◭ ◮
Back Close
Full Screen / Esc
Printer-friendly Version Interactive Discussion
Discussion
P
a
per
|
Discussion
P
a
per
|
Discussion
P
a
per
|
Discussion
P
a
per
coal ash (Zhang et al., 2002). As such, even in the southern part of China, where the influence of Asian dust is low, the concentrations of these minerals are still significant. Mineral dust was characterized by using the surrogate concentration of Fe, which is around 4 % in the Chinese mineral dust mass (Zhang et al., 1993, 2003), although the uncertainties are still present.
5
The highest mean concentrations of SO2−
4 in aerosol particles from 2006 to 2010
were larger than 33 µg m−3
at the urban stations of XiAn, Zhengzhou in Haze Region II, and at Chengdu of Haze Region VI. This result indicates that the effect of coal combustion emission was high in these areas (Fig. 2a). The lowest concentrations (<6 µg m−3
) were observed in the western desert area (Dunhuang) and the Tibetan
10
Plateau (Lasha). Thus, the effect of coal combustion is low. The spatial patterns of total inorganic ammonia ions (NH+4) in China are fairly similar to those of SO24− and NO−3. Aside from XiAn, Zhengzhou, and Chengdu, stations with high NO−
3 concentrations
also include those further north of China (Gucheng and Dalian) with concentrations
>11 µg m−3
, even at Panyu in Pearl River Delta area of the Haze Region V, mainly
15
because of the influences from both motor vehicle and coal-combustion as well as natural gas burning (reason discussed later).
The concentrations of OC and EC are similar to the distribution of SO2−
4 , and the
highest concentrations of OC (20 to 30 µg m−3
) and EC (7 to 10 µg m−3
) at XiAn, Zhengzhou, Gucheng, and Chengdu, in Haze Region II and Haze Region VI in
south-20
western China, and the lowest concentrations were observed in rural northwest China and at the Tibetan Plateau. These higher levels are typically observed in regions with a high population density and are associated with emissions from biomass burning, traffic, and power generation (Zhang et al., 2012a).
3.2 Chemical proportions of PM10and their changes from 2006 to 2013
25
ACPD
15, 19197–19238, 2015Changes in chemical components of aerosol particles in
different haze regions in China
X. Y. Zhang et al.
Title Page
Abstract Introduction
Conclusions References
Tables Figures
◭ ◮
◭ ◮
Back Close
Full Screen / Esc
Printer-friendly Version Interactive Discussion
Discussion
P
a
per
|
Discussion
P
a
per
|
Discussion
P
a
per
|
Discussion
P
a
per
|
Zhengzhou. These stations are all located in Haze Region II (the HBP area), which is considered as the most seriously polluted region in China in terms of aerosol pollu-tion. This result is similar with those obtained from 2006 to 2007 (Zhang et al., 2012a). In rural northwest China (Gaolanshan and Dunhuang station), the PM levels (240 to 250 µg m−3) remain high, but chemical compositions are different with higher mineral
5
fractions. In the Yangtze River Delta area in central eastern China (LinAn, Jinsha and Changde) of the Haze Region III, the PM levels (70 to 90 µg m−3
) were 3 times lower than those in the HBP, but the stations in Haze Region III are located in rural areas and those in the HBP are in urban areas. In the Chengdu urban station located in Haze Region VI, which is also called Si Chuan Basin (SCB) area in southwestern China,
10
the PM level went up ∼160 µg m−3, and this value is between the level of Gucheng
(200 µg m−3
) and Dalian in N. E. China in Haze Region I (90 µg m−3
). Thus, SCB is considered to be another polluted region in China, followed by N. E. China. The urban PM level in Haze Region V (PRD aras), with values of∼90 µg m−3at Panyu and
Nan-ning, were similar to those in rural areas in Haze Region III, thereby showing that the
15
area has a relatively low aerosol pollution in 2013.
During 2013, mineral dust was still the dominant fraction over various regions with a relatively high proportion, especially in rural northwest China (Gaolanshan and Dun-huang). Mineral dust accounted for about 75 to 85 % of PM10. In other areas, the
per-centage was between 25 and 50 %.
20
In most of areas of China except rural northwest China, sulphate contributed the second, and the first large anthropogenic, mass fraction to the atmospheric aerosol with a range of 12 to 25 %. In other three stations (Gucheng, XiAn and Panyu), the sulphate fraction were bit lower than OC and ranked the third with a range of about 9–16 % (Fig. 2b). As such, coal combustion was still the largest anthropogenic source
25
ACPD
15, 19197–19238, 2015Changes in chemical components of aerosol particles in
different haze regions in China
X. Y. Zhang et al.
Title Page
Abstract Introduction
Conclusions References
Tables Figures
◭ ◮
◭ ◮
Back Close
Full Screen / Esc
Printer-friendly Version Interactive Discussion
Discussion
P
a
per
|
Discussion
P
a
per
|
Discussion
P
a
per
|
Discussion
P
a
per
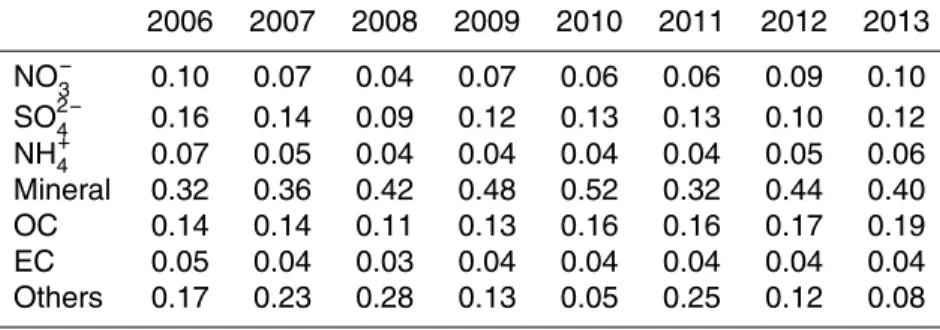
Beijing (Zhang et al., 2012b). Table 1 shows the proportion change of each chemical component of PM10 at Haze Region II (Gucheng). No evident changes were observed
from 2006 to 2013, again indicating that the sources of aerosol particles did not signif-icantly change from 2006 to 2013. This result was also observed in other major haze regions in China, but that in northwest China (Gaolanshan and Dunhuang) is slightly
5
different.
In Fig. 2b, OC normally ranked the third and accounted for about 7–19 % in terms of mass, with high proportions in Gucheng (19 %) and Panyu (16 %) in 2013. This value is also similar to that from 2006 to 2007 (Zhang et al., 2013). In the rural northwest China, OC accounted ∼8 %. In the urban and rural areas of China, about 55 and
10
60 % of OC can be attributed to secondary organic carbon (SOC) formed from volatile organic gases (VOCs), which mainly originate from chemical plants, paint and coatings, motor vehicle (including leaks during fuel), and vegetation from natural sources (Zhang et al., 2012a). The other half of OC is primary organic carbons (POCs) originating from coal combustion. Based on the emission inventory of Beijing and its vicinity (BIV) (Cao
15
et al., 2010), about 55 % of POC emission can be attributed to coal combustion, and POC from coal combustion was estimated to account for 12 % of the total PM1 mass (Zhang et al., 2012b, 2013). Still from Beijing urban area, the primary organic aerosol (POA) from coal-combustion was also found to be most important fraction of total POA, and accounted∼33 % of total organic aerosol (Sun et al., 2014). Biomass burning and
20
motor vehicle are the two other major sources for POC (Cao et al., 2010; Lu et al., 2011), and their contribution to OC will be discussed in Sect. 3.4.
The mass fractions of nitrate and ammonium normally were around 5 to 10 and 3 to 7 %, respectively. The mass fraction of nitrate was less than 5 % in rural northwest China (Gaolanshan and Dunhung) and that of ammonium was less than 3 % in rural
25
ACPD
15, 19197–19238, 2015Changes in chemical components of aerosol particles in
different haze regions in China
X. Y. Zhang et al.
Title Page
Abstract Introduction
Conclusions References
Tables Figures
◭ ◮
◭ ◮
Back Close
Full Screen / Esc
Printer-friendly Version Interactive Discussion
Discussion
P
a
per
|
Discussion
P
a
per
|
Discussion
P
a
per
|
Discussion
P
a
per
|
in urban Beijing (∼20 µg m−3, from 2009 data because no data was obtained in 2013)
were not higher than those in other stations (19 to 22 µg m−3
for Zhengzhou, Gucheng, and XiAn). However, the contribution from motor vehicle emission is the largest in BIV (NBS-Beijing, 2013). This result shows that nitrate over the region does not only orig-inate from motor vehicle emission but also from coal combustion. Even in BIV, about
5
28 % of the emission amount of NOxcan still be attributed to coal combustion. In other areas in China, about 50 % of nitrate mass can be attributed to coal combustion (Cao et al., 2010). Globally, NOx is mainly derived from natural sources. However, in urban areas, NOx mainly comes from anthropogenic activities such as oil and coal combus-tion. Given the rapid development of China’s economy in recent years, the amount of
10
gasoline and diesel oil consumption has significantly increased over the past few years (Lu et al., 2011), even if the Chinese government started promoting the “low nitrogen combustion technology” for denaturalization in power generation since 2012. The in-stallation capacity reached only around 70 % until the middle of 2013, except in BIV (meeting communication), which can probably explain the high nitrate concentration in
15
HBP.
In most areas in China (Fig. 2b), EC normally accounts for 3 to 4 % of aerosol mass, with less than 2 % in rural northwest China (Fig. 2b); this result is also similar to the data obtained from 2006 to 2007 (Zhang et al., 2013). The EC has similar sources with POC (Cao et al., 2010), and is not a major chemical fraction in aerosol particles over
20
China.
Almost similar concentrations were found for each chemical component in aerosol particle with diameters less than 10 µm (PM10) and less than 2.5 (PM2.5) were observed
in urban Beijing, respectively (Table 2). These results provide further evidence that the secondary aerosol particle (sulfate, nitrate, ammonium, and SOC) and particles
25
from combustion processes (EC and POC) are present in particles with a diameter of
ACPD
15, 19197–19238, 2015Changes in chemical components of aerosol particles in
different haze regions in China
X. Y. Zhang et al.
Title Page
Abstract Introduction
Conclusions References
Tables Figures
◭ ◮
◭ ◮
Back Close
Full Screen / Esc
Printer-friendly Version Interactive Discussion
Discussion
P
a
per
|
Discussion
P
a
per
|
Discussion
P
a
per
|
Discussion
P
a
per
3.3 Changes of annual mean concentration of chemical components
Table 2 provides the annual averaged daily concentrations for PM10 of major chemical
components in six major haze areas of China from 2012 to 2013. In the Gucheng sta-tion (Haze Region II), the annual mean concentrasta-tions of most chemical components had no significant difference between 2013 and 2012, except OC with an increase of
5
∼10 µg m−3 in 2013. This result indicates that no significant difference was observed
in emission between the two years. About 37.5 and 36.2 billion tons of standard coal were used for energy consumption in 2013 and 2012 (NBS-China, 2014), respectively, and the difference is not that high. The mass of mineral aerosol in 2013 was even bit lower than that in 2012, resulting in a relatively lower yearly mean PM10 concentration
10
in 2013 but was unexpectedly associated with the occurrence of persistent heavy haze-fog events in the winter of 2013. This event did not occur in 2012. As such, this diff er-ence was the subject of studies because no significant changes were observed in the emission. Gucheng station is located in a rapidly urbanized area of Baoding city, Hebei province, which is the closest city to Beijing (about 140 km southwest). Zhengzhou,
15
XiAn, and Beijing are all within the Haze Region II. The annual concentration levels of chemical components were not significantly different between 2013 and 2012.
A similar situation was also observed in stations such as LinAn, Jinsha, and Changde in Haze Region III (YRD area), Panyu in Haze Region V (PRD area), Chengdu in Haze Region VI (SCB area), Dalian in Haze Region I (N. E. China), and Gaolianshan and
20
Dunhuang in Haze Region IX (N. W. China) (Table 2). As such, no evident annual con-centration differences were observed in 2012 and 2013 in terms of the major chemical components, especially those associated with fine particles such as SO24−, OC, NO−3, NH+4, and EC.
Comparing the annual averaged concentrations, the annual mean of most chemical
25
ACPD
15, 19197–19238, 2015Changes in chemical components of aerosol particles in
different haze regions in China
X. Y. Zhang et al.
Title Page
Abstract Introduction
Conclusions References
Tables Figures
◭ ◮
◭ ◮
Back Close
Full Screen / Esc
Printer-friendly Version Interactive Discussion
Discussion
P
a
per
|
Discussion
P
a
per
|
Discussion
P
a
per
|
Discussion
P
a
per
|
the same stations from 2006 and 2007. For these annual mean concentrations, large decreases were observed in 2013 relative to the values from 2006 to 2007 in Gucheng station for various major chemical species, especially for SO2−
4 , NH
+
4, and NO
−
3 with
2006 to 2007 to 2013 ratios of 1.5, 1.5, and 1.2, respectively. The only component whose concentration increased in 2013 was OC. The reason will be discussed in the
5
next section. For EC and mineral aerosol, their concentrations exhibited no evident changes. The same result was observed for stations (Zhengzhou, XiAn) within the same haze region (II), where the concentrations of most chemical components, except for OC and mineral aerosol, were all lower in 2013 relative to those from 2006 to 2007. Moreover, the final PM10 concentration in 2013 was also lower than that from 2006 to
10
2007.
3.4 Occurrence of haze-fog event in January of 2013 as opposed to 2012 in Gucheng in Haze Region II as an example
3.4.1 Winter concentration and year-long aerosol pollution
The typical seasonal patterns in various aerosol components in China are summarized
15
by (Zhang et al., 2012a), where the maximum concentrations of most aerosol chemical components were observed in winter, whereas that of mineral aerosol was observed in spring. In addition to the regular seasonal maximum, secondary peaks were found for sulfate and ammonium during the summer and for OC and EC during June and Octo-ber. The general changing patterns of various chemical components were also true in
20
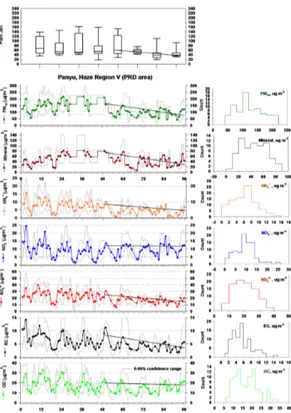
Gucheng at this study (Fig. 3 – left panel). The OC concentration from late autumn to winter season was normally 2 to 4 times higher than those in summer, and the concen-tration during winter continuously declined from 2006 to 2009 and then increased from 2010 to 2013. This result can also be seen in the linear trend of wintertime concentra-tion from 2010 to 2013 in Fig. 3. The averaged OC concentraconcentra-tion in January of 2013
25
even reached ∼145 µg m−3, which is a ∼2.2 time higher than that in 2010. A similar
situation was also observed for EC, SO2−
4 , NO
−
3, NH
+
ACPD
15, 19197–19238, 2015Changes in chemical components of aerosol particles in
different haze regions in China
X. Y. Zhang et al.
Title Page
Abstract Introduction
Conclusions References
Tables Figures
◭ ◮
◭ ◮
Back Close
Full Screen / Esc
Printer-friendly Version Interactive Discussion
Discussion
P
a
per
|
Discussion
P
a
per
|
Discussion
P
a
per
|
Discussion
P
a
per
Although the annual mean concentration had no evident changes, the winter concen-tration of PM10 was higher by at least 25 % in 2013 than in the winter of 2012, whereas the winter concentrations of SO24− and NH+4 in 2013 even increased by a factor of 1 or near 1 relative to that in to 2012, and the OC concentration increased by∼50 %.
All these increases resulted in the heavy and persistent haze-fog event in January of
5
2013.
Based on the OC concentration histogram in Fig. 3 (right panel), the OC concen-tration is usually 15 µg m−3
, which can be considered as the regurlarly-observed back-ground concentration in Haze Region II. A peak concentration of 55 µg m−3 can be considered as the maximum wintertime mass of OC. As discussed in Sect. 3.2, the
10
increased value of OC concentration during the winter can be partially attributed to scattered and central centralized coal combustion during the heating season. Aside from this, the increased OC concentration during the winter was also highly correlated with biomass fuel burning in Gucheng, Baoding city, Hebei province in the south of Bei-jing during the winter. The OC/EC ratio was 4.6 for Gucheng in the winter of 2013 and
15
ranged from 4.1 to 4.5 during wintertime in other years. This group “Gucheng” ratio (4.1 to 4.6) is between the ratio of biomass fuel combustion (3.3) and open biomass burning (8.9 in winter, 8.0 in spring, 5.6 in summer, and 5.9 in autumn) based on the emission inventory (Cao et al., 2006, 2010), but is much higher than the ratio of coal combus-tion (2.0), gasoline (1.4), and diesel oil (3.0), as well as the normal value of 3.1 to 3.9
20
for ambient aerosol in urban areas in China (Zhang et al., 2008). Thus, biomass fuel burning was identified to be another main source for the increase in OC concentration during winter in these areas in the past few years. Baoding (Gucheng station located) is the nearest city in Hebei province to Beijing and has a population of about 11 million, in which∼80 % are rural dwellers living in more than 600 villages of 27 counties. Even
25
ACPD
15, 19197–19238, 2015Changes in chemical components of aerosol particles in
different haze regions in China
X. Y. Zhang et al.
Title Page
Abstract Introduction
Conclusions References
Tables Figures
◭ ◮
◭ ◮
Back Close
Full Screen / Esc
Printer-friendly Version Interactive Discussion
Discussion
P
a
per
|
Discussion
P
a
per
|
Discussion
P
a
per
|
Discussion
P
a
per
|
2007 (Zhang et al., 2008). As such, the contribution of gasoline and diesel combustion during summer to the OC concentration is high, which is evidently different during the winter.
The change in EC is similar to that in OC, and its background concentration is around 5 µg m−3. In winter, the value is about 21 µg m−3.
5
In Fig. 2b, sulfate, similar to OC, accounted for a large fraction (∼12 %) of PM10 in
2013 in Gucheng, and its seasonal variation pattern is similar to the general trend in other areas of China (Zhang et al., 2012a) with the maximum concentrations found during winter, and secondary peaks during summer (Fig. 3 – left panel). The his-togram analysis for sulfate (Fig. 3 – right panel) also shows two peak values of 43
10
and 33 µg m−3
, which may represent the peak concentrations in winter and summer, respectively. Another peak at 21 µg m−3
may represent the background value. Based on the winter sulfate concentration from 2010 to 2013, a slight increase in SO2−
4
con-centration was observed from linear fitting of SO2−
4 in Fig. 3 (lift panel), particularly in
January of 2013. A peak at 56 µg m−3
was observed, thereby indicating that the sulfate
15
probably originated from scattered coal combustion and central heating involving the use of coal in Gucheng because the major emission sources for SO2, i.e., coal power
plant and industrial manufacturing processes, would be no extra increase during winter. In China, half of coal is used for power generation. About three quarters of another half are used in industrial manufacturing processes, mainly in steel mills, chemical plants,
20
and glass and cement plants, and a quarter of this half can be attributed to scattered coal combustion for winter heating (Cao et al., 2010). Only this part caused the in-crease during winter. The emissions of scattered coal combustion were those from smaller heating boilers (less than 40 tons) and those of coal burning were from scat-tered residential households. All sulfate data fitting (not just based on wintertime data)
25
still shows the decreasing trend from 2010 to 2013 (−0.07 slope for linear fitting, data
ACPD
15, 19197–19238, 2015Changes in chemical components of aerosol particles in
different haze regions in China
X. Y. Zhang et al.
Title Page
Abstract Introduction
Conclusions References
Tables Figures
◭ ◮
◭ ◮
Back Close
Full Screen / Esc
Printer-friendly Version Interactive Discussion
Discussion
P
a
per
|
Discussion
P
a
per
|
Discussion
P
a
per
|
Discussion
P
a
per
Similar to sulfate, nitrate concentration was also higher in winter relative to other seasons, and an increasing trend during winter was observed from 2010 to 2013 with less significant seasonal variations relative to OC and EC (Fig. 3 – left panel). Given that the main sources of NOx emission, i.e., coal combustion from coal power plants, industrial manufacturing processes, fuel burning from motor-vehicle, and natural gas
5
burning (Göke et al., 2014), are relatively the same for all four seasons, the contribution of scattered coal heating or central heating boilers without denitrification devices to the increase of NO−3 concentration during winter cannot be ignored. The lower height of the plenary boundary during the winter is another reason for the high concentration during winter. If one just compares the winter data, the effect would be eliminated. This
10
is, of couse, an important aspect to determine the impact of meteorological factors on pollution and will be discussed in the next section by using PLAM. Based on the NO−
3 histogram result (Fig. 3 – right panel), the regional background and winter peak
concentrations are around 12 and 28 µg m−3
, respectively. Unlike in sulfate, the linear fit by using all nitrate data still showed an increasing trend for NO−3 (Fig. 3 – left panel),
15
thereby showing that the denitrification in power plants since 2012 had no obvious effect in the increase in NO−
3 concentration.
Of the anions, SO24−and NO−3 are dominant species contributing to aerosol acidities, both of which are highly correlated with NH+4 in Gucheng (Zhang et al., 2012a). The median ratio of the observed mole number of NH+4 and capable molecules for
neutral-20
izing this substance from SO2−
4 and NO
−
3 was approximately 0.70 from 2006 to 2013,
thereby suggesting that excess overbalanced anion can sufficiently neutralize NH+4 in Haze Region II. The change in NH+4 concentration since 2010 was similar to that of NO−
3, with the same tendency to increase during winter (Fig. 3 – left panel). The
fre-quency distribution was also similar to that of NO−
3 bit different with that of SO 2−
4 (Fig. 3
25
– right panel). The frequency distribution analyses of NH+4 concentration also showed that the background and winter concentrations were 7.5 and 23 µg m−3
re-ACPD
15, 19197–19238, 2015Changes in chemical components of aerosol particles in
different haze regions in China
X. Y. Zhang et al.
Title Page
Abstract Introduction
Conclusions References
Tables Figures
◭ ◮
◭ ◮
Back Close
Full Screen / Esc
Printer-friendly Version Interactive Discussion
Discussion
P
a
per
|
Discussion
P
a
per
|
Discussion
P
a
per
|
Discussion
P
a
per
|
gions, which imply that the major sources of NH+4 are located in the HBP. Waste and coal consumption account for∼67 to 85 % of the total NH3emissions, of which human
and poultry wastes as well as coal combustion from industry, commercial, and residen-tial usage are the major contributors in urban areas (Cao et al., 2010). In rural areas, another source of ammonia emission is agricultural activities, which account for∼14
5
to 28 % of the total NH3emission, with nitrogen fertilizer as the major contributor (Cao et al., 2010).
In Fig. 3 – left panel, the linear trend of winter mineral aerosol concentration shows almost no change from 2010 to 2013, thereby indicating that the change in PM10 in these years was mainly attributed to the changes in fine aerosol particle concentrations.
10
The histogram analysis of the mineral suggests that a high regional background loading of 90 µg m−3
was observed in the Haze Region II, which not only caused by sand-dust-storm dust, urban fugitive dust, but also coal ash that is highly related with the large amount of coal combustion activities in this area. The winter concentration of mineral aerosol is around 130 µg m−3
(Fig. 2 – right panel).
15
3.4.2 Contribution of specific meteorological condition to the wintertime PM10
changes
The PM10 concentration increased by about 25 % in January of 2013 compared with that in 2012. The specific meteorological conditions that are highly related with aerosol pollution (parameterized as an index called “PLAM”) also increased by∼15 % at the
20
same period. Given that the pollutant emissions did not significantly change from 2012 to 2013 (NBS-China, 2014), which was not enough to cause a significant increase of 25 %, about 60 % of this 25 % increase in PM10 concentration can thus be considered
as the contribution of worsening meteorological conditions because PLAM has been confirmed to be linearly related with PM10concentration (Wang et al., 2012).
25
The comparison of averaged PM10 concentration between January 2013 and
ACPD
15, 19197–19238, 2015Changes in chemical components of aerosol particles in
different haze regions in China
X. Y. Zhang et al.
Title Page
Abstract Introduction
Conclusions References
Tables Figures
◭ ◮
◭ ◮
Back Close
Full Screen / Esc
Printer-friendly Version Interactive Discussion
Discussion
P
a
per
|
Discussion
P
a
per
|
Discussion
P
a
per
|
Discussion
P
a
per
in 2010. Given the linear relation between PLAM and PM10 (Wang et al., 2012), about 28 % of the 1.2 times increase in PM10 can be approximately regarded as the
contri-bution from worsening meteorological conditions since 2010. Based on the changes in mean mass of various chemical components between January 2010 and January 2013 and by multiplying these by the proportion of each component of PM10in 2013 (Fig. 2b),
5
about 20, 41, 18, 16, 2.0, and−5.0 % of the increase in PM10 in 2013 relative to 2010
can be attributed to SO2−
4 , OC, NO
−
3, NH
+
4, EC, and mineral, respectively. The other
components accounted for about∼9 % of this increase in PM10concentration between
2010 and 2013. OC contributed the largest percent of the increase in PM10
concentra-tion from 2010 to 2013.
10
3.5 Changes in the chemical components of PM10 in other major haze areas in
China
3.5.1 Haze Region III (Yangtze River Delta (YRD) area) in China
Although the winter concentrations of particular aerosol chemical components, such as OC, NO−3, and NH+4, continuously increased since 2010 in Haze Region III (LinAn)
15
(Fig. 4 – left panel), the increase in amplitude was much smaller than that of HBP. The winter concentration of EC and dust slightly decreased and that of sulfate did not significantly change from 2010 to 2013. Thus, PM10 concentration remained
un-changed since 2010, which was very similar to the change in wintertime PLAM since 2010 in the same area. This result implies the important effect of meteorological
con-20
dition on aerosol pollution. In general, the pollution-meteorological condition worsened from 2006 to 2010 in Haze Region III (LinAn) and remained almost unchanged from 2010 to 2013 with a slight decrease in 2011 (Fig. 4 – left panel-upper part).
The regional background concentrations of SO24−, OC, NO−3, NH+4, EC, and mineral dust are normally 17, 11, 6, 6, 3, and 25 µg m−3
, respectively, which are about 60 to
25
80 % of the HPB level (Fig. 4 – right panel). The corresponding winter values are nor-mally 33, 22, 15, 10, 5, and 65 µg m−3
ACPD
15, 19197–19238, 2015Changes in chemical components of aerosol particles in
different haze regions in China
X. Y. Zhang et al.
Title Page
Abstract Introduction
Conclusions References
Tables Figures
◭ ◮
◭ ◮
Back Close
Full Screen / Esc
Printer-friendly Version Interactive Discussion
Discussion
P
a
per
|
Discussion
P
a
per
|
Discussion
P
a
per
|
Discussion
P
a
per
|
than 1 times higher than the annual background concentration, but the concentrations are much smaller than in HBP, thereby suggesting the weak influence of winter heat-ing in the YRD area. Winter heatheat-ing is not legally imposed in the southern parts of China. However, coal-fired heating during winter is still practiced in this area, which can increase the mineral content to 65 µg m−3
during winter from the normal value of
5
25 µg m−3. The increased wintertime mineral concentration is most likely caused by coal ash, whereas other fugitive dust, such as dust from sand and dust storm events, construction sites, and unpaved roads, would cause a significant increase during win-ter. Unlike in HBP, the proportion of sulfate (∼19 % of PM10) is much higher than the
OC fraction (13 % of PM10).
10
The winter OC/EC ratio was 3.7 with a range of 2.7 to 5.3 from 2006 to 2013 in Haze Region III (LinAn), and a high value of∼4.0 was observed from 2012 to 2013. These
values are similar those from biomass fuel combustion (Cao et al., 2010), thereby sug-gesting that the influence of biomass burning for heating was also observed in the YRD area during winter.
15
3.5.2 Haze Region V (Pearl River Delta (PRD) area) in China
The pollution-meteorological conditions during wintertime were much better in Haze Region V (Panyu) in the PRD area than that in the HBP, with PLAM values ranging from 60 to 90 from 2010 to 2013 (corresponding values of 110 to 150 in HPB;∼120
to 125 in YRD) and are associated with a declining trend (Fig. 5-left panel-upper part).
20
This decrease in PLAM was very similar to the decreased trend of PM10, thereby
im-plying the effect of meteorological factors on the change in PM. In Fig. 5, almost all chemical components presented a decreasing since 2010, except for nitrate. In addi-tion to the reduced emission in YRD with emphasis on coal combusaddi-tion sources, the decrease in the concentrations of major chemical components and PM10 can also be
25
ACPD
15, 19197–19238, 2015Changes in chemical components of aerosol particles in
different haze regions in China
X. Y. Zhang et al.
Title Page
Abstract Introduction
Conclusions References
Tables Figures
◭ ◮
◭ ◮
Back Close
Full Screen / Esc
Printer-friendly Version Interactive Discussion
Discussion
P
a
per
|
Discussion
P
a
per
|
Discussion
P
a
per
|
Discussion
P
a
per
The regional background concentrations of SO2−
4 , OC, NO
−
3, NH
+
4, EC, and mineral
dust in this region are 17, 13, 9, 7, 3.5, and 25 µg m−3
, respectively, which are simi-lar to the values in YRD. The corresponding winter values are 33, 22, 15, 9, 6.7, and 70 µg m−3for SO24−, OC, NO−3, NH+4, EC, and mineral, respectively. The difference be-tween the winter and background concentrations in other season in the PRD area is
5
very similar to those in the YRD area.
The winter OC/EC ratio in Haze Region V (Panyu) is 0.79 with a range of 0.25 to 2.9 from 2006 to 2013, which is close to the value of 1.4 for gasoline (Cao et al., 2010). Thus, different sources were noted in the HBP area for OC and EC with less biomass burning contribution. In January of 2006, 2008, and 2009, the OC/EC ratios
10
were within the range of 2.4 to 2.9, which were very similar to the fossil fuel combustion (2.0) and diesel oil (3.0) (Cao et al., 2010). As such, emission had an evident effect in reducing the contribution of coal combustion and diesel vehicles in Guangzhou. After 2010, the winter ratio of OC and EC were within 0.3 to 0.5.
3.5.3 Haze Region VI (Si Chuan Basin (SCB) area) in China
15
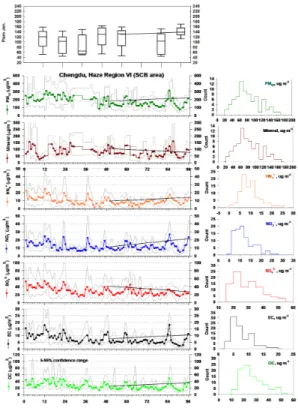
Based on the monthly changes in the various chemical components and PM10in Haze Region VI (Chengdu) (Fig. 5 – left panel), the wintertime mass of various chemical com-ponents generally had peak values from 2006 to 2013. However, in particular years, this kind of situation was not particularly evident. These results suggest that the win-tertime heating season had an effect on the chemical composition in the SCB area.
20
Specifically, the mass of mineral aerosol was found to have an evident peak in winter, which is different from other areas. As such, the influences of coal-ash contribution were observed. The significant increase in the concentration during winter was not ev-ident for sulfate relative to other chemical species, such as EC and nitrate, especially after 2010, because another period had existed in the summer where the values were
25
ob-ACPD
15, 19197–19238, 2015Changes in chemical components of aerosol particles in
different haze regions in China
X. Y. Zhang et al.
Title Page
Abstract Introduction
Conclusions References
Tables Figures
◭ ◮
◭ ◮
Back Close
Full Screen / Esc
Printer-friendly Version Interactive Discussion
Discussion
P
a
per
|
Discussion
P
a
per
|
Discussion
P
a
per
|
Discussion
P
a
per
|
served for nitrate during the same period, showing no obvious denitrification effect of power generation plants. During winter, PLAM decreased from 2006 to 2009 and re-mained at a similar level at∼130 from 2010 to 2013. However, the value was low in
2011, thereby showing that the effect of bad weather on aerosol pollution is medium in the SCB area (Fig. 5-left panel-upper part).
5
The background concentrations of SO2−
4 , OC, NO
−
3, NH
+
4, EC, and mineral dust in
this region are 23, 22, 9, 7, 5, and 65 µg m−3
, respectively, which are similar to the HBP value, with slightly higher masses for SO2−
4 and OC and slightly lower values for
NO−3 and mineral dust. The corresponding winter values are 43, 47, 23, 18, 14, and 145 µg m−3
. The difference between the winter and background concentrations in the
10
SCB area is very similar to that in the HBP area, thereby showing the relatively polluted condition in this area.
In general, two values of OC/EC were obtained:∼3.1 in December to January and ∼0.41 in February. The higher OC/EC ratio is quite similar to biomass fuel
combus-tion (3.3), and the lower value is close to gasoline (1.4) (Cao et al., 2010). These
re-15
sults suggest the contributions of biomass burning for heating during winter in the SCB area, and the contribution from motor vehicle was also observed. The low OC/EC ratio during winter is also similar to most values of OC/EC during other seasons, thereby showing the strong influences of motor vehicle to OC and EC in this area.
4 Summary
20
On the basis of mass concentration of sulfate, OC, nitrate, ammonium, EC, and mineral dust from 24 h aerosol particle (PM10) collected from various CAWNET stations from
2006 to 2013, the change in these major water-soluble constituents, carbonaceous species, mineral aerosol and PM10 since 2006 and the contribution of meteorological condition were investigated in this study. The mass concentration and comparison of
25
de-ACPD
15, 19197–19238, 2015Changes in chemical components of aerosol particles in
different haze regions in China
X. Y. Zhang et al.
Title Page
Abstract Introduction
Conclusions References
Tables Figures
◭ ◮
◭ ◮
Back Close
Full Screen / Esc
Printer-friendly Version Interactive Discussion
Discussion
P
a
per
|
Discussion
P
a
per
|
Discussion
P
a
per
|
Discussion
P
a
per
tails for 2012 and 2013 in particular, in hope to strengthen the understanding of the growing haze-fog over the years in China. Moreover, this study can also serve as a ba-sis in chemical composition aspect for further evaluation the effect of implementation of various pollution control countermeasures after 2013, called “atmospheric pollution prevention and control of the ten measures of China” by Chinese government. This
in-5
vestigation also provides the inputs and validation of haze-fog forecasting system that used a lot of near-real time (NRT) data.
The major findings of this study can be summarized as follows:
– During 2013, the mineral aerosol was found still to be the largest component of PM10in almost all stations in different haze areas, thereby showing the high “dust”
10
characteristics in aerosol pollution of China, in which the contribution of coal-ash should not be ignored. Thus, a high mineral concentration was observed even at southern part of the urban areas in China. The high regional background loading of 90 µg m−3
in mineral aerosol was observed in the Haze Region II, which not only caused by sand-dust-storm dust, urban fugitive dust, but also coal ash that
15
is highly related with the large amount of coal combustion activities in this area. The winter concentration of mineral aerosol is around 130 µg m−3
. Sulphate con-tributed the second, and the first large anthropogenic, mass fraction to the atmo-spheric aerosol (i.e., 12 to 25 %) in most of areas of China except rural northwest China. At stations of Gucheng, XiAn and Panyu, the sulphate fraction were bit
20
lower than OC and ranked the third, but still with a percentages of 9 to 16 %. OC normally ranked the third and accounted for about 7 to 19 % by mass, with high proportions in Gucheng and Panyu. The mass fractions of nitrate and ammonium were normally around 5 to 10 and 3 to 7 %, while in most areas of China, elemen-tal carbon represented 2 to 4 %. All these percentage are similar with the results
25
ACPD
15, 19197–19238, 2015Changes in chemical components of aerosol particles in
different haze regions in China
X. Y. Zhang et al.
Title Page
Abstract Introduction
Conclusions References
Tables Figures
◭ ◮
◭ ◮
Back Close
Full Screen / Esc
Printer-friendly Version Interactive Discussion
Discussion
P
a
per
|
Discussion
P
a
per
|
Discussion
P
a
per
|
Discussion
P
a
per
|
Region II. The result suggests that coal-combustion also has an important contri-bution to the increased nitrate concentration in this area. NH+4 concentration are much higher in HBP than in other regions, with the background and winter con-centrations of 7.5 and 23 µg m−3
, respectively, which imply that the major sources of NH+4 are located in the HBP. Agricultural activity is the most important source
5
of ammonium.
– Excessive amount of unclean energy-consumption was the most fundamental reason for the increased severity of haze and fog events in China, in which coal-combustion was still the largest anthropogenic source for aerosol pollution in vari-ous areas of China in 2013. The proportion of each chemical component of PM10
10
had no evident changes from 2006 to 2013, which also shows that the sources for aerosol particles did not significantly change from 2006 to 2013.
– Wintertime mass concentrations of aerosol chemical components and PM10 are
more important than annual mean value in evaluating of aerosol pollution for a year. In the HBP area, the winter concentration in various components normally
15
exhibited a decline during 2006 to 2010 (considered as the first phase for the pol-lution change during 2006–2013), and then rose till 2013 (called second phase). The wintertime PM10was 1.2 times higher in 2013 than it in 2010, in which∼28 %
of the increase in PM10 concentration from 2010 to 2013 can be attributed to the
worsening specific meteorological conditions based on the PLAM results. The
in-20
creased sulfate, OC, nitrate, ammonium, EC and mineral dust contributed about 20, 41, 18, 16, 2.0, and−5.0 % to the increased PM10 concentration from 2010 to
2013, and∼9 % of the increased PM10 concentration can be attributable to other
components, including trace metal, other water soluble species, other organic matter, and biogenic aerosol. The winter concentrations were usually around 43,
25
55, 28, 23, 21 and 130 µg m−3
for SO2−
4 , OC, NO
−
3, NH
+
4, EC and mineral dust,
ACPD
15, 19197–19238, 2015Changes in chemical components of aerosol particles in
different haze regions in China
X. Y. Zhang et al.
Title Page
Abstract Introduction
Conclusions References
Tables Figures
◭ ◮
◭ ◮
Back Close
Full Screen / Esc
Printer-friendly Version Interactive Discussion
Discussion
P
a
per
|
Discussion
P
a
per
|
Discussion
P
a
per
|
Discussion
P
a
per
– Given the ∼25 % increase in PM10 concentration in January of 2013, relative to
2012 in the HBP area, while the winter values of SO24− and NH+4 concentrations in 2013 even increased by 1 or near 1 factor in 2013, relative to 2012. The OC concentration increased by∼50 %. All these resulted in persistent haze-fog event
in January of 2013, which did not happen in the winter of 2012. About ∼60 %
5
of this increment can be attributable to worsening meteorological conditions. The APEC summit period (8–10 November 2014) was associated with bad meteo-rological conditions with ∼100 to 120 of PLAM at Beijing, ∼35 % reduction of
pollutant emission in the BIV area by various control measures. This∼35 % cut
resulted in good air quality, and was called “APEC blue” in media (all the details
10
will be introduced in a companioned paper separately). From the fact of incre-ment of∼25 % pollutants in the HBP area resulted in persistent haze-fog event in
winter 2013, and∼35 % cutting derived in APEC Blue in 2014 winter, one could
approximately estimates that there will be no frequent persistent haze-fog event induced by aerosol pollution if ∼one third of pollutant emission can be reduced
15
on the basis of winter emission level of 2013 in BIV. The∼one-third reduction of
2013 winter emission might be considered as the upper limit of capacity of aerosol pollution in this area.
– OC contributed the largest in the increase in PM10 concentration during winter
from 2010 to 2013 in the HBP area, in which the contribution from biomass fuel
20
burning for heating was identified in addition to the contribution from the scat-tered and central coal-combustion for heating. The phenomenon was also found in YRD area and SCB but not in PRD area, where the contribution from the coal-combustion to various chemical components was noted before 2009, but after 2010, the contributions from motor vehicle increased.
25