25
Determination Of Longevity Of Teeth In Buckets
Of Loading Equipment In Coal Mines - A Case
Study
Aarif Jamal, Ramesh Kumar, R.P. Singh, Nilesh Pratap Singh, Anup Kumar Digarse
Abstract: The life of bucket teeth in shovel and dragline deployed in handling of overburden rock is an important contributor to the stores cost and is also responsible for the loss of valuable availability and utilisation time of these critical equipment. To ascertain the effect of rock type on longevity of bucket teeth, a study has been conducted in two large opencast mines of Singrauli Coalfields. The results of this study is presented in this paper. There was a significant variation as compared to the actual figures of the mine, it establish useful relationship between the type of mineral present in the overburden and the life of bucket teeth of shovel and dragline.
Index Terms: abrasivity, bucket teeth, dragline, longevity, shovel, Singrauli Coalfield
————————————————————
INTRODUCTION
The increasing demand of coal for meeting the requirement of the country paved to exploit the coal by opencast mechanized mining at ever increasing stripping ratio. While shovel has been the most widely used equipment, increasing use of dragline is being made in view of high capacity and lower operating cost of a dragline. The replacement of the teeth in shovel and dragline has been a matter of serious concern for the mine operators due to its associated cost and the idling of these equipment. Every Ground Engaging Tool (GET) manufacturing company claims good life of teeth, but such data relates to ideal condition and generally far from the actual condition of the mine. In actual conditions the life of a tooth is much less than what the manufacturing companies claim. Bucket teeth require replacement under the following two conditions:- i) Breakage of tooth
ii) Wearing out of tooth
The later is the major cause for most of the tooth replacement and varies from project to project. To evaluate this effect, the relationship between the rock type and the bucket tooth life has been studied. Abrasiveness of rock affects the wear of the ground engaging tool, besides the speed and the force employed on it. On the one hand wear depends on the force and its direction as employed by the excavating machine, on the other it also depends on the rock and the geological conditions prevailing in the mine.
The abrasivity of rock which is a main contributory geological condition can be described by the petrographic composition, in particular the contribution of hard minerals like quartz. Determination of quartz or equivalent quartz content can be done by microscopic examination of a thin section. Alternatively by laboratory tests where some kind of model or index test is used. In the present paper the Cerchar abrasivity test as well as the Laboratoire des Ponts et Chaussées (LCPC) abrasivity test is employed and its comparison with other methods has also been made. Abrasion is the wearing or tearing away of particles from the surface. More abrasive the rocks are, the higher the operation costs. The mechanization of the excavation methods associated with increased advancement rate or increased production rates in mining require a greater knowledge of rock abrasivity. Abrasiveness of rock cannot be predicted with a high degree of accuracy. In recent years, the studies on determining the abrasiveness of rocks have been carried out intensively. There are several methods for estimating the abrasiveness of rocks and minerals, used with various degree of success and relevance. They can be broadly divided into three categories:
Indirect methods – abrasivity assessment through a combination of hardness, compressive strength and other fundamental rock properties such as, grain size and size distributions, grain shape and orientation, porosity, micro cracking.
Direct methods – abrasivity assessment from test methods where there is a relative movement of rock sample and a wear tool in contact under standard controlled test conditions.
Holistic approaches – abrasivity assessment via a combination of fundamental rock properties and many varied process parameters and environmental conditions.
As an example of indirect measurements, Atkinson (1986) and Atkinson and Cassapi (1989) assessed rock abrasiveness through standard mechanical property tests such as Schmidt hammer, shore scleroscope and the cone Indenter tests. The test results were complemented with the values of fundamental properties of rocks including unconfined compressive strength, indirect tensile strength, rock hardness and toughness. As an example of a holistic _________________________
Aarif Jamal, Ramesh Kumar, R.P. Singh, Nilesh
Pratap Singh, Anup Kumar Digarse
Department of mining engineering, Indian Institute of Technology (Banaras Hindu University) Varanasi 221005, India
Professor (Department of Mining Engineering,
26 approach, wear of the rolls in a high pressure grinding
device was studied. The study took into account the effects of machine scale, wear surface structure of the rolls, grinding pressures and rolls speed, gap settings, feed size distribution and moisture content for a range of ores. The authors proposed a prevailing wear mechanism and a methodology for minimising wear of the grinding rolls, specific to the high pressure grinding device only. An example of a direct method, Bond (1964) and Buchi (1995) developed testing apparatus that determine rock abrasiveness in a low abrasion/medium impact mode of wear where rock abrasiveness is measured as the amount of material lost by a standard steel paddle which rotates on a shaft in a sample of loose rock particles of a certain specified size range. As can be seen from the above examples, the indirect methods of rock abrasivity assessment have the advantage of using data which is either readily available or relatively straightforward to obtain. However, they do not take into account process variables for specific modes of wear. Hence, they are normally not used in isolation, but rather in combination with direct methods, or holistic approaches, to supplement or confirm other more relevant direct measures. However, there is no universally accepted one standard test to determine the rock abrasivity although a large number of different tests are in use. All the studies about rock abrasiveness are concentrated on the amount of quartz, grain size and cementation degree of quartz, the geometry of the abrasive mineral and mechanical strength of rock.
FIELD STUDY
Field studies were carried out, to collect the required data and samples were drawn from Northern Coalfields Limited (NCL). Details regarding life of teeth of dragline and shovel were obtained and different type of rock samples were collected for the purpose of laboratory study. Brief description of area Northern Coalfields Limited (NCL) is a subsidiary of Coal India Limited (CIL) located in the Sonbhadra district in Uttar Pradesh, and the singrauli region of Sidhi district of Madhya Pradessh. The coal reserve in the north-eastern part of Singrauli coalfield, covering an area of around 220km2 is 9,121 million tonnes, out of which 2,724 million tonnes are proved reserves and the rest is inferred or indicated. Important coal seams in this part of Singrauli coalfield are: Jhingurda (130-162 m thick), Purewa (8-25 m thick) and turra (12-22 m thick). Coal of these seams are generally high moisture (6-9 %) and high ash (17-40 %) coals. The volatile matter ranges from 25-30 %. The volatile matter ranges from 25-30 %. The calorific value of the coal varies from 4,200-5,900 kcal/kg.
Jayant Project: a brief description
The rocks of Jayant block are of Barakar formation and exposed in the form of a plateau. There are five coal seams as follows –
1. Kota 2. Turra
3. Purewa bottom 4. Purewa top 5. Turrea A
The thickness varies from 0.2m to 1.9m for Turrea A and available only in some part and thus not viable for
commercial exploitation by opencast mining. There are a number of dirt bands in Turrea A seam, some more than 1m thick. The strike of coal seam is from east to west and the dip varies from 10 to 40 in northern direction.
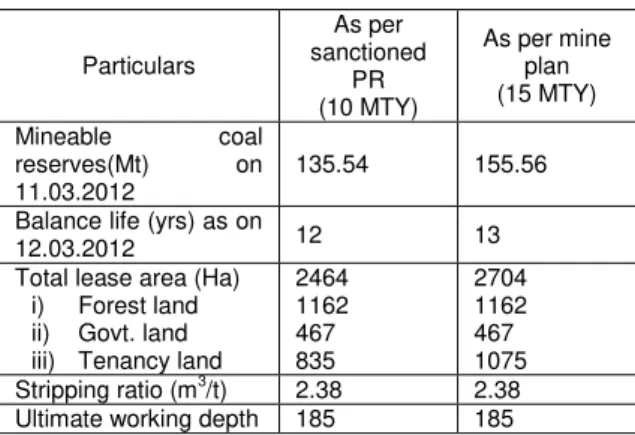
Table 1: Project parameters of Jayant Project
Particulars
As per sanctioned
PR (10 MTY)
As per mine plan (15 MTY)
Mineable coal reserves(Mt) on 11.03.2012
135.54 155.56
Balance life (yrs) as on
12.03.2012 12 13
Total lease area (Ha) i) Forest land ii) Govt. land iii) Tenancy land
2464 1162 467 835 2704 1162 467 1075 Stripping ratio (m3
/t) 2.38 2.38
Ultimate working depth 185 185
Table 2: Project parameters of Jayant Project
Particulars Value
Coal seam details (m) i) Purewa top ii) Purewa bottom iii) Turra
Thickness (m)
Reserve (Mt)
5-9 40.06
9-12 91.06
13-19 217.50 Total reserve 348.93
Gradient (dip) 20 - 50 Average grade C,E,F
For exacavation of coal, various type of equipment has been used in NCL. The study was carried out for Dragline and Shovel. There are three dragline and 14 shovels working in jayant project.
Amlohri project: a brief description
The full thickness of Purewa merged seam including all dirt bands varies from 19.50m to 26.15m. The immediate roof of Purewa merged seam is represented by coarse grained sandstone, grey shale, carbonaceous shale and carbonaceous sandy shale in order of abundance. The floor is generally represented by sandy shale, carbonaceous sandy shale, fine to medium grained sandstone, alternate bands of shale and sandstone, carbonaceous shale and grey shale. The Purewa merged seam is a highly inter-banded seam making it a much inferior quality coal. The dirt bands are represented by carbonaceous shale, carbonaceous sandy shale and grey shale.
Table 3: Project parameters of Amlohri mine
Coal seams Net proved coal reserves (Mt.)
Turra Purewa merged Total Moher block Moher-Amlohri extension block Total
27 Table 4: Project parameters of Amlohri mine
Blocks Net geological reserves (Mt)
Volume of total overburden(Mm3)
Moher block 316.66 1123.41
Moher-Amlohri
extension block 258.34 1220.35
Total 575.00 2343.76
The thickness of overburden overlying Purewa seam varies from 84.70 m to 198.47 m. the parting between Turra and Purewa seams varies from 51.97 m to 68.70 m. The initial depth of occurance of Turra seam is 12.40 m.
Table 5: Project parameters of Amlohri mine
Particulars 12 MTPA 20 MTPA
Net geological
reserves(MT) 575.00 575.00
Extractable coal
reserves (MT) 446.91 470.43
Percentage of
extraction (%) 77.72 81.80
Estimated volume
of OB (Mm3) 1893.73 1893.73
Stripping ratio
(m3/t) 4.24 4.03
According to field data, the replacement time interval for shovel tooth in Jayant mine is 30 days. The type of shovel tooth used is J250 of CATERPILLAR. Weight of the tooth = 6100 gm Dimensions = 167 x 65 x 86 mm It has been observed that the availability of the shovel is 70% and the tooth is replaced when there is a 60% of loss of material by abrasion.
Table 6: Project parameters of Amlohri mine
S.No. HEMM Size/capacity No. for 12MTPA
No. for 20MTPA
A. OB removal
1 Dragline 55-65m3/90R 2
2 Dragline 46m3/116R 2
3 Rope shovel 35-38m3 4 6
4 RBH drill 311mm 2 4
5 RBH drill 250 mm 6 10
6 Rear dumper 240 t 24 42
7 Dozer 850 HP 3 6
8 Dozer 560 HP 4 6
B. Coal production
1 Rope shovel 35-38 m3 1
2 Rope shovel 10 m3 4
3 Front end loader 28-30 m3
2
4 Rotary blast hole
drill 160 mm 4 8
5 Rear dumper coal
body 240 T 13
6 Rear dumper coal
body 100 T 16
7 Dozer with ripper 850 HP 2 2
8 Dozer 560 HP 2 2
C. Common
1 Grader 280 HP 4 7
2 Crane 200 T 1 1
3 Crane 90 T 1 1
4 Front end loader 10-11 m3 1
5 Wheel dozer 450 HP 2 2
6 Hyd. Shovel (BH) 2-4 m3 2 1
7 Dozer 240 HP 2 2
8 Lowboy 275 T 2
D. Reclamation
1 Dozer 560 HP 2 2
2 Grader 280 HP 2 2
3 Water sprinkler 60-70 Kl 3 6
FACTORS AFFECTING LIFE OF TEETH
28 from the working surface of a tool by mechanical means.
The wear resistance property is an important characteristics of intrinsic quality of mining tools; however, it is influenced by rock mineral composition, hardness and grain size, rock strength and hardness, cutting depth and speed of bit, bit attack angle, bit geometry, impact load of tool, cutting type or acting shape of bit (impact, rotary and grinding), cooling fluid applied to the rock surface and tool, effective cutting and crushing, and resistance to strength and abrasiveness.
LAB INVESTIGATION
Abrasive testing method
The well established method for determining abrasiveness has been adopted with a variation that instead of ball mill used for steel cube test for abrasiveness we used well arranged abrasion tester. Process involved in this method included:-
i) Specimen preparation:
Specimen was prepared from broken teeth of bucket of dragline and shovel into a rectangular shape. Since it is made of tungsten carbide, it was not easy to make rectangular shape from broken teeth of a dragline. By the great effort of IIT-bhu workshop, it could be possible to make rectangular shape.
ii) Preparation of sample:
Sample has prepared by crushing the quartz up to a size +30 to +50. After crushing 1000 gms of quartz samples
were drawn for all experimental readings. Similarly samples of sandstone, shale and coal were prepared.
iii) Weighing of specimen:
After preparing the specimen into circular section, weight of each sample is shown below in tabular form.
Table 7: Project parameters
Specimen no. Weight (gms)
D1 90.7741
D2 85.5649
S1 101.526
S2 95.5672
iv) Abrasion between specimen and rock samples: The specimen with rock sample was put in to the special arranged apparatus for testing of abrasiveness. Initially weight of each specimen was noted after starting of machine and again difference in weight after 1hour, 2hours and 3hours was noted and process was repeated for several times.
RESULTS AND DISCUSSION
Table 8: Average percentage weight loss of Dragline teeth specimen (D1) with quartzite for 1 hr in abrasion tester.
S. No. Size of Sample
Initial wt. of metal chip (gms)
Wt. of chip after
abrasion (gms) Wt. loss % Wt. loss
% Avg. Wt. loss
1. +30 to +50 90.7741 90.7730 0.0011 12.11
2. +30 to +50 90.7730 90.7717 0.0013 14.32
3. +30 to +50 90.7717 90.7697 0.0020 22.03
4. +30 to +50 90.7697 90.7673 0.0024 26.07
5. +30 to +50 90.7673 90.7654 0.0019 21.22 20.44
6. +30 to +50 90.7654 90.7637 0.0017 18.23
7. +30 to +50 90.7637 90.7615 0.0022 24.52
8. +30 to +50 90.7615 90.7590 0.0025 27.05
9. +30 to +50 90.7590 90.7574 0.0016 18.55
29 Table 9: Average percentage weight loss of Dragline teeth specimen (D1) with quartzite for 2hr in abrasion tester.
S. No. Size of Sample
Initial wt. of metal chip (gms)
Wt. of chip after
abrasion (gms) Wt. loss % Wt. loss % Avg. Wt. loss
1. +30 to +50 90.7559 90.7543 0.0016 17.66
2. +30 to +50 90.7543 90.7521 0.0022 24.25
3. +30 to +50 90.7521 90.7492 0.0029 31.96
4. +30 to +50 90.7492 90.7466 0.0026 27.66
5. +30 to +50 90.7466 90.7436 0.0030 32.24 27.54
6. +30 to +50 90.7436 90.7411 0.0025 26.57
7. +30 to +50 90.7411 90.7387 0.0024 25.89
8. +30 to +50 90.7387 90.7359 0.0028 30.11
9. +30 to +50 90.7359 90.7328 0.0031 34.55
10. +30 to +50 90.7328 90.7302 0.0026 27.50
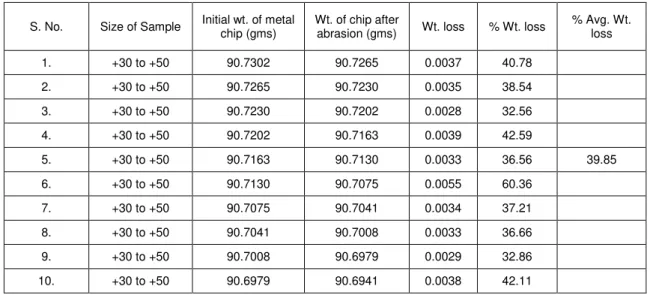
Table 10: Average percentage weight loss of Dragline teeth specimen (D1) with quartzite for 3hr in abrasion tester.
S. No. Size of Sample Initial wt. of metal chip (gms)
Wt. of chip after
abrasion (gms) Wt. loss % Wt. loss
% Avg. Wt. loss
1. +30 to +50 90.7302 90.7265 0.0037 40.78
2. +30 to +50 90.7265 90.7230 0.0035 38.54
3. +30 to +50 90.7230 90.7202 0.0028 32.56
4. +30 to +50 90.7202 90.7163 0.0039 42.59
5. +30 to +50 90.7163 90.7130 0.0033 36.56 39.85
6. +30 to +50 90.7130 90.7075 0.0055 60.36
7. +30 to +50 90.7075 90.7041 0.0034 37.21
8. +30 to +50 90.7041 90.7008 0.0033 36.66
9. +30 to +50 90.7008 90.6979 0.0029 32.86
10. +30 to +50 90.6979 90.6941 0.0038 42.11
Table 11: Average percentage weight loss of Shovel teeth specimen (S1) with quartzite for 1hr in abrasion tester.
S. No. Size of Sample Initial wt. of metal chip (gms)
Wt. of chip after abrasion (gms)
Wt. loss
% Wt. loss
% Avg. Wt. loss
1. +30 to +50 101.526 101.524 0.002 19.69
2. +30 to +50 101.524 101.521 0.003 29.58
3. +30 to +50 101.521 101.519 0.002 19.71
4. +30 to +50 101.519 101.518 0.001 09.83
5. +30 to +50 101.518 101.514 0.004 39.40 22.56
6. +30 to +50 101.514 101.511 0.003 29.76
7. +30 to +50 101.511 101.509 0.002 19.82
8. +30 to +50 101.509 101.506 0.003 29.76
9. +30 to +50 101.506 101.504 0.002 19.85
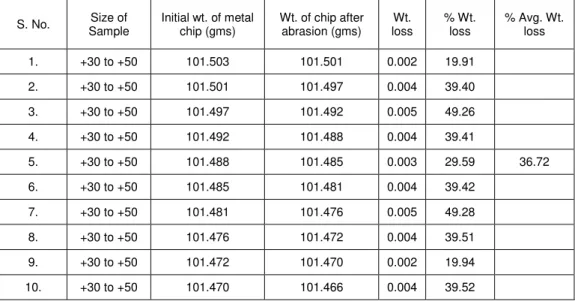
30 Table 12: Average percentage weight loss of Shovel teeth specimen (S1) with quartzite for 2hr in abrasion tester.
S. No. Size of Sample
Initial wt. of metal chip (gms)
Wt. of chip after abrasion (gms)
Wt. loss
% Wt. loss
% Avg. Wt. loss
1. +30 to +50 101.503 101.501 0.002 19.91
2. +30 to +50 101.501 101.497 0.004 39.40
3. +30 to +50 101.497 101.492 0.005 49.26
4. +30 to +50 101.492 101.488 0.004 39.41
5. +30 to +50 101.488 101.485 0.003 29.59 36.72
6. +30 to +50 101.485 101.481 0.004 39.42
7. +30 to +50 101.481 101.476 0.005 49.28
8. +30 to +50 101.476 101.472 0.004 39.51
9. +30 to +50 101.472 101.470 0.002 19.94
10. +30 to +50 101.470 101.466 0.004 39.52
Table 13: Average percentage weight loss of Shovel teeth specimen (S1) with quartzite for 3hr in abrasion tester.
S. No. Size of Sample
Initial wt. of metal chip (gms)
Wt. of chip after abrasion (gms)
Wt.
loss % Wt. loss
% Avg. Wt. loss
1. +30 to +50 101.466 101.461 0.005 49.28
2. +30 to +50 101.461 101.455 0.006 59.13
3. +30 to +50 101.455 101.451 0.004 39.43
4. +30 to +50 101.451 101.445 0.006 59.15
5. +30 to +50 101.445 101.441 0.004 39.44 51.59
6. +30 to +50 101.441 101.435 0.006 59.16
7. +30 to +50 101.435 101.430 0.005 49.29
8. +30 to +50 101.430 101.424 0.006 59.17
9. +30 to +50 101.424 101.420 0.004 39.45
10. +30 to +50 101.420 101.414 0.006 59.19
Table 14: Average percentage weight loss of Dragline teeth specimen (D2) with coal and associated rocks for 1hr in abrasion tester.
S. No. Size of Sample
Initial wt. of metal chip (gms)
Wt. of chip after abrasion (gms)
Wt. loss
% Wt. loss
% Avg. Wt. loss
Sandstone1. +30 to +50 85.5649 85.5641 0.0008 09.35
Sandstone2. +30 to +50 85.5641 85.5631 0.0010 12.65 18.94 Sandstone3. +30 to +50 85.5631 85.5610 0.0021 24.54
Sandstone4. +30 to +50 85.5610 85.5585 0.0025 29.21 Shale5. +30 to +50 85.5585 85.5581 0.0004 04.71
Shale6. +30 to +50 85.5581 85.5575 0.0006 07.08 06.64 Shale7. +30 to +50 85.5575 85.5570 0.0005 05.59
Shale8. +30 to +50 85.5570 85.5561 0.0009 09.38 Coal9. +30 to +50 85.5561 85.5559 0.0002 02.33
Coal10. +30 to +50 85.5559 85.5558 0.0001 01.17 02.06 Coal11. +30 to +50 85.5558 85.5555 0.0003 03.56
31 Table 15: Average percentage weight loss of Dragline teeth specimen (D2) with coal and associated rocks for 2hr in abrasion
tester.
S. No. Size of Sample
Initial wt. of metal chip (gms)
Wt. of chip after abrasion (gms)
Wt. loss
% Wt. loss
% Avg. Wt. loss
Sandstone1. +30 to +50 85.5554 85.5542 0.0012 14.08
Sandstone2. +30 to +50 85.5542 85.5527 0.0015 17.64 24.92 Sandstone3. +30 to +50 85.5527 85.5495 0.0032 37.64
Sandstone4. +30 to +50 85.5495 85.5459 0.0036 42.35 Shale5. +30 to +50 85.5459 85.5453 0.0006 07.05
Shale6. +30 to +50 85.5453 85.5445 0.0008 09.42 09.20 Shale7. +30 to +50 85.5445 85.5435 0.0010 10.94
Shale8. +30 to +50 85.5435 85.5426 0.0009 09.39 Coal9. +30 to +50 85.5426 85.5424 0.0002 02.45
Coal10. +30 to +50 85.5424 85.5420 0.0004 04.71 03.28 Coal11. +30 to +50 85.5420 85.5417 0.0003 03.53
Coal12. +30 to +50 85.5417 85.5415 0.0002 02.46
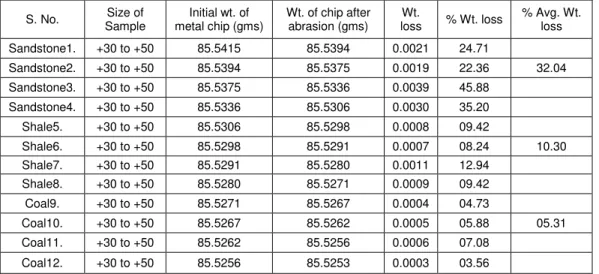
Table 16: Average percentage weight loss of Dragline teeth specimen (D2) with coal and associated rocks for 3hr in abrasion tester.
S. No. Size of Sample
Initial wt. of metal chip (gms)
Wt. of chip after abrasion (gms)
Wt.
loss % Wt. loss
% Avg. Wt. loss
Sandstone1. +30 to +50 85.5415 85.5394 0.0021 24.71
Sandstone2. +30 to +50 85.5394 85.5375 0.0019 22.36 32.04 Sandstone3. +30 to +50 85.5375 85.5336 0.0039 45.88
Sandstone4. +30 to +50 85.5336 85.5306 0.0030 35.20 Shale5. +30 to +50 85.5306 85.5298 0.0008 09.42
Shale6. +30 to +50 85.5298 85.5291 0.0007 08.24 10.30 Shale7. +30 to +50 85.5291 85.5280 0.0011 12.94
Shale8. +30 to +50 85.5280 85.5271 0.0009 09.42 Coal9. +30 to +50 85.5271 85.5267 0.0004 04.73
Coal10. +30 to +50 85.5267 85.5262 0.0005 05.88 05.31 Coal11. +30 to +50 85.5262 85.5256 0.0006 07.08
Coal12. +30 to +50 85.5256 85.5253 0.0003 03.56
Table 17: Average percentage weight loss of Shovel teeth specimen (S2) with coal and associated rocks for 1hr in abrasion tester.
S. No. Size of Sample
Initial wt. of metal chip (gms)
Wt. of chip after abrasion (gms)
Wt.
loss % Wt. loss
% Avg. Wt. loss
Sandstone1. +30 to +50 95.5672 95.5661 0.0011 11.51
Sandstone2. +30 to +50 95.5661 95.5641 0.0020 20.93 20.89 Sandstone3. +30 to +50 95.5641 95.5623 0.0028 29.30
Sandstone4. +30 to +50 95.5623 95.5601 0.0022 21.85 Shale5. +30 to +50 95.5601 95.5554 0.0007 07.33
Shale6. +30 to +50 95.5554 95.5540 0.0010 10.95 09.14 Shale7. +30 to +50 95.5540 95.5531 0.0009 09.85
Shale8. +30 to +50 95.5531 95.5523 0.0008 08.42 Coal9. +30 to +50 95.5523 95.5519 0.0004 04.27
Coal10. +30 to +50 95.5519 95.5514 0.0005 05.57 03.83 Coal11. +30 to +50 95.5514 95.5511 0.0003 03.19
32 Table 18: Average percentage weight loss of Shovel teeth specimen (S2) with coal and associated rocks for 2hr in abrasion
tester.
S. No. Sample Size of Initial wt. of metal chip (gms) Wt. of chip after abrasion (gms) loss Wt. % Wt. loss % Avg. Wt. loss
Sandstone1. +30 to +50 95.5509 95.5494 0.0015 15.66
Sandstone2. +30 to +50 95.5494 95.5467 0.0027 26.82 29.36
Sandstone3. +30 to +50 95.5467 95.5428 0.0039 40.12 Sandstone4. +30 to +50 95.5428 95.5394 0.0034 34.85
Shale5. +30 to +50 95.5394 95.5384 0.0010 11.26
Shale6. +30 to +50 95.5384 95.5373 0.0011 12.50 11.78
Shale7. +30 to +50 95.5373 95.5361 0.0012 14.01
Shale8. +30 to +50 95.5361 95.5352 0.0009 09.36
Coal9. +30 to +50 95.5352 95.5346 0.0006 06.15
Coal10. +30 to +50 95.5346 95.5339 0.0007 07.72 05.96
Coal11. +30 to +50 95.5339 95.5335 0.0004 04.33
Coal12. +30 to +50 95.5335 95.5330 0.0005 05.67
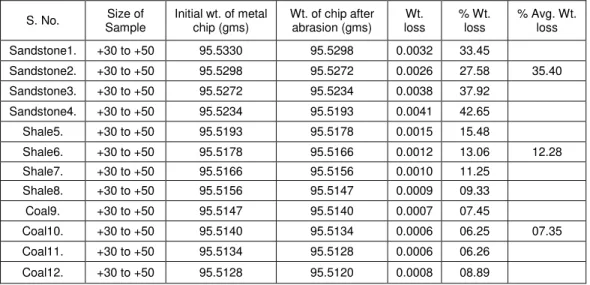
Table 19: Average percentage weight loss of Shovel teeth specimen (S2) with coal and associated rocks for 3hr in abrasion tester.
S. No. Size of Sample
Initial wt. of metal chip (gms)
Wt. of chip after abrasion (gms)
Wt. loss
% Wt. loss
% Avg. Wt. loss
Sandstone1. +30 to +50 95.5330 95.5298 0.0032 33.45
Sandstone2. +30 to +50 95.5298 95.5272 0.0026 27.58 35.40
Sandstone3. +30 to +50 95.5272 95.5234 0.0038 37.92 Sandstone4. +30 to +50 95.5234 95.5193 0.0041 42.65 Shale5. +30 to +50 95.5193 95.5178 0.0015 15.48
Shale6. +30 to +50 95.5178 95.5166 0.0012 13.06 12.28 Shale7. +30 to +50 95.5166 95.5156 0.0010 11.25
Shale8. +30 to +50 95.5156 95.5147 0.0009 09.33
Coal9. +30 to +50 95.5147 95.5140 0.0007 07.45
Coal10. +30 to +50 95.5140 95.5134 0.0006 06.25 07.35 Coal11. +30 to +50 95.5134 95.5128 0.0006 06.26
Coal12. +30 to +50 95.5128 95.5120 0.0008 08.89
Table 20: Schmidt Hammer method for determination of compressive strength of rocks
S. No.
Name of the specimen
Rebound no. (R) (Average of 20 readings)
Correspondence Compressive strength in MPa
1. JyS.st1 22 16
2. JyS.st2 32 28
3. JyS.st3 42 48
4. JyS.sh1 21 15
5. JyS.sh2 24 19
6. JyS.sh3 29 26
7. Alm.st1 23 18
8. Alm.st2 28 24
9. Alm.st3 32 32
10. Alm.sh1 22 16
11. Alm.sh2 25 21
33 Table 21: Density measurements of given rock sample
S. No. Name of the
specimen Mass (gm) Length (cm) Radius (cm)
Volume of the core (cm3
)
Density (M/V)
1. JyS.st1 160 4 2.5 66.44 2.41
2. JyS.st2 865 20 2.5 382.03 2.27
3. JyS.st3 700 15 2.5 265.73 2.63
4. JyS.sh1 250 9 2.5 149.50 1.74
5. JyS.sh2 195 10 2.5 166.10 1.41
6. JyS.sh3 280 10 2.5 166.50 2.48
7. Alm.st1 330 8 2.5 132.90 2.51
8. Alm.st2 250 6 2.5 99.76 2.51
9. Alm.st3 145 4 2.5 66.44 2.18
10. Alm.sh1 115 3 2.5 49.83 1.31
11. Alm.sh2 220 11 2.5 155.56 1.66
12. Alm.sh3 260 13 2.5 168.52 1.75
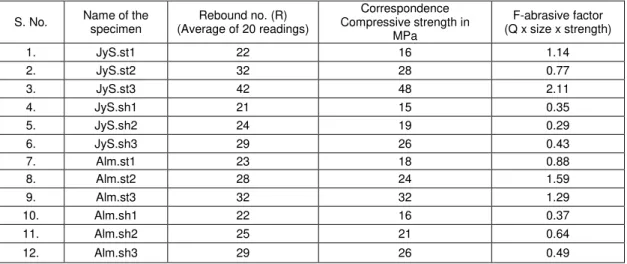
Table 22: Determination of F-abrasivity factor
S. No. Name of the specimen
Rebound no. (R) (Average of 20 readings)
Correspondence Compressive strength in
MPa
F-abrasive factor (Q x size x strength)
1. JyS.st1 22 16 1.14
2. JyS.st2 32 28 0.77
3. JyS.st3 42 48 2.11
4. JyS.sh1 21 15 0.35
5. JyS.sh2 24 19 0.29
6. JyS.sh3 29 26 0.43
7. Alm.st1 23 18 0.88
8. Alm.st2 28 24 1.59
9. Alm.st3 32 32 1.29
10. Alm.sh1 22 16 0.37
11. Alm.sh2 25 21 0.64
12. Alm.sh3 29 26 0.49
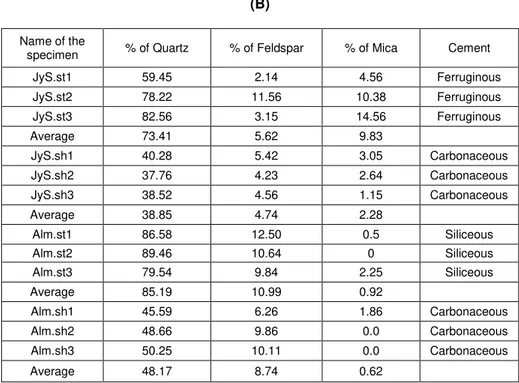
Table 23: Petro graphical model analysis of different rock
(A)
Name of the specimen Quartz grain Feldspar grain Mica grain Others Total
JyS.st1 75 3 6 32 116
JyS.st2 96 12 11 NP 119
JyS.st3 461 23 87 2 573
Average 210.67 12.67 34.67 11.33 269.33
JyS.sh1 25 7 4 30 66
JyS.sh2 32 5 3 42 82
JyS.sh3 55 2 3 54 114
Average 37.33 4.67 3.33 42 87.33
Alm.st1 90 10 1 1 102
Alm.st2 106 12 2 NP 120
Alm.st3 95 12 NP 2 109
Average 97 11.33 1 1 110.33
Alm.sh1 35 5 8 41 89
Alm.sh2 44 2 NP 46 92
Alm.sh3 55 4 NP 52 111
34 (B)
Name of the
specimen % of Quartz % of Feldspar % of Mica Cement
JyS.st1 59.45 2.14 4.56 Ferruginous
JyS.st2 78.22 11.56 10.38 Ferruginous
JyS.st3 82.56 3.15 14.56 Ferruginous
Average 73.41 5.62 9.83
JyS.sh1 40.28 5.42 3.05 Carbonaceous
JyS.sh2 37.76 4.23 2.64 Carbonaceous
JyS.sh3 38.52 4.56 1.15 Carbonaceous
Average 38.85 4.74 2.28
Alm.st1 86.58 12.50 0.5 Siliceous
Alm.st2 89.46 10.64 0 Siliceous
Alm.st3 79.54 9.84 2.25 Siliceous
Average 85.19 10.99 0.92
Alm.sh1 45.59 6.26 1.86 Carbonaceous
Alm.sh2 48.66 9.86 0.0 Carbonaceous
Alm.sh3 50.25 10.11 0.0 Carbonaceous
Average 48.17 8.74 0.62
Table 24: Mineralogical composition of samples supplied
Sample no. Project Aggregate
colour Quartz (%) Feldspar (%) Mica (%)
Cement Matrix (%)
Others
(%) Abrasiveness
Sandstone Amlohri Dark brown
56.2 60.4 62.5 6.2 4.4 5.4 4.4 1.5 1.8 32.2 34.7 31.3 0.5 0.3 2.7 Considerable
Average 59.7 5.33 2.57 32.73 1.17
Shale Amlohri Dark brownish-blue 32.6 34.8 35.6 4.2 4.8 5.2 1.2 0.5 0.3 33.2 34.6 32.8 30.4 27.5 28.4 Considerable
Average 34.33 4.73 0.67 33.53 28.77
Sandstone Jayant Brown
44.2 54.4 56.4 4.6 6.2 4.1 2.4 3.2 2.8 33.6 36.4 34.6 12.5 2.6 3.2 Considerably low
Average 51.67 4.97 2.8 34.87 6.1
Shale Jayant Dark blue
27.6 25.4 26.2 4.4 4.1 3.4 4.2 3.2 1.2 32.5 34.2 38.5 33.2 31.8 31.4 Considerably low
Average 26.4 3.97 2.87 35.07 32.13
CONCLUSIONS
From above lab experiment we conclude that abrasiveness increases with increase in quartz percentage.
The above result can be used to predict relative wearing rate of different equipment that can be used in a given mining condition.
Life of teeth of dragline and shovel depends on various factors and mineral composition is the most important factor.
From above experiment it is suggested that when manufacturers launch any heavy mining equipment in market apart from other properties mineral composition also be kept in to considerations.
RECOMMENDATIONS
FOR
FIELD
APPLICATION
35 shovel and dragline teeth keeping in view the abrasivity and
hardness of coal and associated rocks in mines.
REFERENCES
[1] Büchi, E., Mathier, J.-F., &Wyss, ch.1995. Rock Abrasivity – a significant cost factor for mechanical tunnelling in loose and hard rock. Tunnel, 5, 38-43 .
[2] Hoek, E & Franklin J.A. 1968. A simple triaxial cell for field and laboratory testing. Trans. Inst. Min. Metal, 22-26. Plinninger, R.J., Käsling, H., Thuro, K., Spaun, G.2003. Testing conditions and geomechanical properties influencing the CERCHAR abrasiveness index (CAI) value. International Journal of Rock Mechanics and Mining Sciences, 40, 2: 259-263.
[3] West, G. 1989.Rock abrasiveness testing for tunnelling. International Journal of Rock Mechanics and Mining Science, Vol. 26, No. 2, pp. 151-160.
[4] Al-Ameen and Waller, 1994 S.I. Al-Ameen and M.D. Waller, The influence of rock strength and abrasive mineral content on the Crechar Abrasive Index, Eng. Geol. 36 (1994), pp. 293-301
[5] West G., (1989), Technical Note – Rock Abrasiveness Testing for Tunnelling, International Journal of Rock Mechanics and Mining Science, Vol. 26, No. 2, pp. 151-160.
[6] T.Atkinson, V.B. Cassapy and I. Singh, Assessment of abrasive wear resistance potential in rock excavation machinery, Int. J. Min. Geol. Eng. 3 (1986), pp. 151-163
[7] H.J.R. Deketh, Wear of Rock Cutting Tools laboratory Experiments on the Abrasivity of Rock, AA Balkema, Rotterdam, Netherlands (1995) pp. 143-145
[8] R. Plinninger, H. Kasling, K. Thuro and G. Spaun, Testing conditions and geomechanical properties influencing the Crechar abrasiveness index (CAI) value. Technical note, Int. Journal of Rock Mech. Min. Sci. 40 (2003), pp.259-263.
[9] Al-Ameen & Waller 1993. The influence of rock strength and abrasive mineral content on the Cerchar Abrasive Index. Engineering Geology 36: 293-301
[10]Michalakopoulos, T. N., Anagnostou, V.G., Bassanou, M. E. &Panagiotou, G. N. 2005 The influence of steel styli hardness on the Crechar abrasiveness index value. Int. J. Rock Mech. Min Sci. & Geomech. Abstr. 43: 321-327
[11]Matern, N. von, Hjelmer, A., 1943. Försök med pågrus (―Tests with Chippings‖), Medelande nr. 65, Statens väginstitut, Stockholm, 65pp. (English summary, pp. 56-60)
[12]NTH, 1983. Hard Rock Tunnel Boring, Project Report 1-83. Norwegian Institute of Technology, Div. of Construction Engineering, Trondheim, p. 94
[13]Rostami, J., Ozdemir, L., Bruland, A., Dahl, F., 2005. Review of issues related to Cerchar abrasivity testing and their implications on geotechnical investigations and cutter cost estimates. Proceedings of the RETC, 738-751
[14]Selmer-Olsen, R., Blindheim, O.T., 1970. On the drillability of rock by percussive drilling. Proc. 2nd Congress of ISRM, Belgrade.
[15]West, G., 1989. Rock abrasiveness testing for tunnelling. International journal of Rock Mechanics and Mining Sciences & Geomechanics Abstracts 26 (2), 151-160