Chemical Industry & Chemical Engineering Quarterly www.ache.org.rs/CICEQ
Chem. Ind. Chem. Eng. Q. 21 (2) 249−259 (2015) CI&CEQ
MARIJA S. PETROVIĆ1 TATJANA D. ŠOŠTARIĆ1 LATO L. PEZO2
SLAVKA M. STANKOVIĆ3
ČASLAV M. LAČNJEVAC4 JELENA V. MILOJKOVIĆ1
MIRJANA D. STOJANOVIĆ1
1Institute for Technology of Nuclear and Other Mineral Raw Materials, Belgrade, Serbia 2Institute of General and Physical Chemistry, University of Belgrade, Belgrade, Serbia 3Faculty of Technology and Metallurgy, University of Belgrade, Belgrade, Serbia 4Faculty of Agriculture, University of Belgrade, Serbia
SCIENTIFIC PAPER
UDC 66.081:634.21:633.21:54 DOI 10.2298/CICEQ140510023P
USEFULNESS OF ANN-BASED MODEL FOR
COPPER REMOVAL FROM AQUEOUS
SOLUTIONS USING AGRO INDUSTRIAL
WASTE MATERIALS
Article Highlights
• Apricot stones and corn cobs are low cost and locally available biosorbents
• SOP and ANN models were used for analysing and optimizing of the biosorption process
• Among the input parameters, biosorbent mass has the most significant influence on biosorption
• ANN model yield a bit better fit of experimental data, according to r2 and SOS of both models
• Both materials can be used as biosorbents for the removal of copper ions from aqueous solution
Abstract
The purpose of this study was to investigate the adsorption properties of locally available lignocellulose biomaterials as biosorbents for the removal of copper ions from aqueous solution. Materials are generated from juice production (apricot stones) and from the corn milling process (corn cob). Such solid wastes have little or no economic value and very often present a disposal problem. Using batch adsorption techniques the effects of initial Cu(II) ions concentration (Ci), amount of biomass (m) and volume of metal solution (V) on biosorption efficiency and capacity were studied for both materials, without any pre-treatments. The optimal parameters for both biosorbents were selected depending on the highest sorption capability of biosorbent in removal of Cu(II). Experimental data were compared with second order polynomial regression models (SOPs) and artificial neural networks (ANNs). SOPs showed accept-able coefficients of determination (0.842-0.997), while ANNs performed with high prediction accuracy (0.980-0.986) in comparison to experimental results.
Keywords: biosorption, apricot stones, corn cob, copper ions, SOPs, ANN.
Copper is a heavy metal and the most common pollutant of the environment due to its wide use in different industries including electroplating, azo dye manufacture, engraving, lithography, petroleum refin-ing and pyrotechnics etc. [1,2]. Copper ion concen-trations can approach 100-120 mg L-1 in industrial wastewaters [3]. Although copper is an essential nutrient for living organisms, it is a common and ser-ious environmental pollutant because of its toxicity
Correspondence: M.S. Petrović, Institute for Technology of Nuc-lear and Other Mineral Raw Materials, Bulevar Franše d’Eperea 86, 11000 Belgrade, Serbia.
E-mail: [email protected] Paper received: 10 May, 2014 Paper revised: 20 June, 2014 Paper accepted: 24 June, 2014
and its bioaccumulation in the food chains [4]. Due to its toxic effect on living organisms, treatment of cop-per contaminated water is necessary. One possible treatment could be the process of biosorption.
low-cost biosorbents for heavy metal removal from water solution.
The purpose of this work was to investigate the application of locally available agro industrial waste such as apricot stones (Prunus armeniaca L.) and corn cobs (Zea mays L.) as biosorbents for the rem-oval of copper ions from aqueous solutions.
Treatment of contaminated water using biosorp-tion is a complex process due to the influence of dif-ferent variables on biosorption efficiency. The effects of different variables can be evaluated using artificial neural network (ANN) [15]. Recently, second order polynomials models (SOPs) and ANNs have been used jointly for both modelling and optimization purposes in environmental studies [16]. ANN models are recognized as a good modelling tools since they provide the solution to the problems from a set of experimental data, and are capable of handling com-plex systems with nonlinearities and interactions between decision variables. Prediction of biosorption process using ANN has been attempted by many researchers with a reasonably good degree of suc-cess [17-19].
The specific objective in this study was to inves-tigate the effect of amount of biomass (m), initial con-centration (Ci) and volume (V) for two biosorption materials (apricot stones and corn cobs) on sorption of Cu(II). The performance of ANNs was compared with the SOP models, and also with experimental results. The focus of this study was to determine the optimal m, Ci and V for apricot stones and corn cobs, depending on maximum removal efficiency (R) and biosorption capacity (q). Developed empirical models give a reasonable fit to experimental data and suc-cessfully predict sorption characteristics.
METHODS
Biosorbent preparation
Apricot stones were obtained from Juice Factory “Vino Župa” Aleksandrovac and corn cobs were obtained from Maize Research Institute, Zemun Polje, Serbia. Both biomaterials were milled (KHD Humbolt Wedag AG) and <1 mm fraction was chosen for the biosorption tests without any pre-treatment.
Characterization of the biosorbents
Surface morphology of apricot stones and corn cob was determined by SEM-EDX (JEOL JSM-6610LV model). FTIR-ATR spectroscopic analyses were carried out using a Nicolet 380 spectrophoto-meter in the spectral range 4000 to 400 cm-1. FTIR characterization was performed in order to determine chemical functional groups that might be involved in
the biosorption process. The ANKOM 2000 fiber analyzer was used for determination of neutral deter-gent fiber (NDF) content of both biomaterials.
Preparation of stock solution
Stock solutions were obtained by dissolving pre-cise amount of Cu(NO3)2⋅3H2O (p.a. grade) in deion-ized water. Desired solutions of different copper ion concentrations were prepared by appropriate dilution of stock solution. Using a pH meter (Sension MM340), the pH value was adjusted with 0.1 M HNO3 and 0.1 M NaOH solutions. Buffering was not used due to unknown effects of buffer compounds on bio-sorption [20]. All experiments were performed in trip-licate.
Batch experiments
In order to optimize the experimental conditions, the batch studies were performed with different amounts of biomass (from 0.1 to 1.0 g), volumes of metal solution (50, 75 and 100 mL) and initial con-centrations of copper ions (60, 120, 180 and 240 mg L−1). The solutions including the metal ions and bio-sorbent were shaken during optimum contact time in shaker at 250 rpm. Equilibrium of the process was reached at 120 min of contact time [21,22]. After equilibrium was reached, the contents of the flasks were filtered and analyzed for the amount of copper remaining in the solution. The final concentration of Cu(II) ions was measured by atomic absorption spec-trometry (Perkin-Elmer, AAnalyst 300).
Variables affecting the biosorption process were: initial metal-ion concentration, amount of bio-mass, pH, sorption time, particle size, temperature, agitation rate [23]. The initial concentration of Cu(II) ions, amount of biomass and volume of metal sol-utions were three variables which were used as input vectors to train the network. The other variables were kept constant at their optimum values, as previous studies had indicated (pH 4.5, t = 120 min, T = 25 °C) [21,22].
The biosorption capacity of the biosorbent (q, mg g−1) was calculated as:
=( i − eq) /
q C C V m (1)
The removal efficiency of copper ions (R / %) was calculated as:
=100( i − eq) / i
R C C C (2)
Mathematical model
Second order polynomial (SOP) model
In order to check the significant effect of the input variables over the output and to justify the use of ANN model by coefficient of determination (r2
), it is recommended to perform a statistical analysis of the available data, such as analysis of variance (ANOVA). For each dependent variable where factors were rejected when their significance level was
p > 0.05, the SOP models were developed. All the analysis and mathematical modelling were performed using Statistica 10 software [25].
The SOP model estimated the main effect of the process variables on final products properties during the sorption of Cu(II). The independent variables were: m, Ci and V. The influences of independent variables on sorption characteristics of Cu(II), for both sorption materials, are presented in this work. All SOP models were fitted to data collected by expe-rimental measurements. The models of the following form were developed to relate six dependent outputs (Y) to three process variables (X):
β β β
β = = = = + = + + + +
3 3 2 0 1 1 3 3 1 1k k ki i kii i
i i
kij i j i j i
Y X X
X X
, k = 6 (3)
where: βk0, βki, βkii, βkij are constant regression coef-ficients; Yk, either equilibrium concentration of Cu(II) (Ceq), removal efficiency (R), biosorption capacity (q) for either apricot stones or corn cobs; while Xk are either sorbent weight (m), initial concentration (Ci) or volume (V). The significant terms in the model were found using ANOVA for each dependent variable.
Artificial neural network (ANN) modelling
According to StatSoft Statistica’s recommend-ations, the database is randomly divided to: training data (60% of data), cross-validation (20%) and testing data (20%). The cross-validation data set was used to test the performance of the network while training was in progress as an indicator of the level of general-ization and the time at which the network has begun to over train. Testing data set was used to examine the network generalization capability.
To improve the behaviour of the ANN, both input and output data were normalized according to Eq. (4):
(
) (
)
= − −
. min( ) / max( ) min( )
i norm i i i i
x x x x x (4)
where xi is i-th case, with measured Ceq, R or q, for either apricot stones or corn cobs. Normalized vari-ables gained values in the range of 0 to 1, and have no physical meaning.
In order to obtain good network behaviour, it is necessary to make a trial and error procedure and also to choose the number of hidden layers, and the number of neurons in hidden layer(s). The use of only one layer is advisable, because more layers exacer-bates the problem of local minima [26].
A multi-layer perceptron models (MLP) con-sisted of three layers (input, hidden and output), which is the most common, flexible and general-pur-pose kind of ANN. Such a model has been proven as a quite capable of approximating nonlinear functions [26], which is why it was chosen for this study. The network consists of one layer of linear output neurons and one hidden layer of nonlinear neurons. The MLP neural network learns using an algorithm called “back propagation”. The Levenberg-Marquardt algorithm proved to be the fastest and particularly adapted for networks of moderate size. During this iterative pro-cess, input data are repeatedly presented to the net-work [27].
The first estimation of the number of neurons can be obtained from the following equation [28,29]:
= ( +1)+ ( +1)
w n x y n (5)
where x and y represent the number of input and output neurons, respectively, n is the number of neu-rons in the hidden layer and w is the number of weights (connections between layers) in the neural network. W can be taken as the number of training exemplars divided by 10. Some suggestions regard-ing the number of hidden neurons are as follows: this number should be between the sizes of the input and output layers, it should be 2/3 the size of the input layer, plus the size of the output layer, or less than twice the size of the input layer [28].
In this work, the ANN procedure of StatSoft Sta-tistica was used to model the ANN, and the number of hidden neurons, n, varied from 8 to 9. There were
x = 3 inputs, y = 6 outputs, and 86 to 96 weight coef-ficients, w (depending on n). The Broyden-Fletcher- -Goldfarb-Shanno (BFGS) algorithm, implemented in StatSoft Statistica’s evaluation routine, was used for ANN modelling. The most common nonlinear acti-vation functions used in StatSoft Statistica ANN cal-culation are: logistic, sigmoid, hyperbolic and tangent functions (also exponential, sine, softmax, Gausian). In most applications, hyperbolic tangent function beh-aves better as compared to the other functions [30].
respect-ively, and X is the matrix of input variables, it is pos-sible to represent the neural network, by using matrix notation, as follows [31]:
= 1( 2 2( 1 + 1)+ 2)
Y f W f W X B B (6)
Weights (elements of matrices W1 and W2) are determined during the training step which updates them using optimization procedures to minimize the error function between network and experimental outputs [28,29], evaluated according to the sum of squares (SOS) and BFGS algorithm, used to speed up and stabilize convergence [32].
Training, testing and system implementation
After defining the architecture of ANN, the train-ing step is initiated. The traintrain-ing process was rep-eated several times in order to get the best per-formance of the ANN, due to a high degree of vari-ability of parameters. It was accepted that the suc-cessful training was achieved when learning and cross-validation curves (SOS vs. training cycles) approached zero. Testing was carried out with the best weights stored during the training step. Coef-ficient of determination (r2) and SOS were used as parameters to check the performance (i.e., the accu-racy) of the obtained ANNs.
After the best behaved ANN is chosen, the model is implemented using an algebraic system of equations to predict Ceq, R or q, for either apricot stones or corn cobs, using Eq. (6). This step can be easily achieved in some spreadsheet calculus (Mic-rosoft Office Excel, for instance).
Fuzzy synthetic optimization
The optimization procedure was performed using the fuzzy synthetic evaluation (FSE) algorithm implemented in Microsoft Excel 2007, in order to determine the workable optimum conditions for the biosorption of Cu(II). The FSE method was imple-mented using the results of models proposed to rep-resent R or q, for either apricot stones or corn cobs, using Eq. (7). FSE is commonly used technique to solve problems with constraints involving non-linear functions. The method aims to solve a sequence of simple problems whose solutions converge to the solution of the original problem.
Trapezoidal membership function used in this calculation, could be written as:
−
≤ <
−
= ≤ <
−
≤ < −
−
,
( , , , , ) , 1
, 1
x a
a x u
u a
A x a u v b u x v
x v
v x b
b v
(7)
where x is whether R or q, for each biosorption material, and the values of a, b, u and v are function parameters. The interval a-b represents the range in which measured values occurred, while u-v is the expected optimal values range for output variables.
RESULTS AND DISCUSSION
Characterization of biosorbents
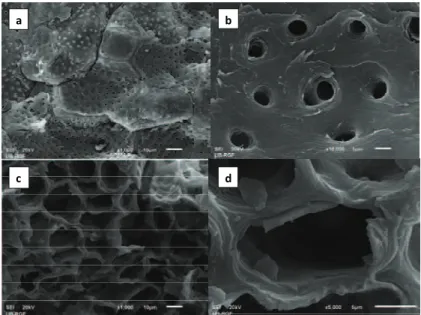
In order to identify surface morphology of bio-sorbents, apricot stones and corn cobs were char-acterized by SEM-EDX (JEOL JSM-6610 LV electron micrograph). SEM micrographs (Figure 1) showed a
a b
c d
highly porous surface of apricot stones. At 10,000× magnification, single pores with diameter of 1 μm can be seen. In comparison with apricot stones, surface of corn cob has a low porosity and on the corn cob surface only channels with diameter of 10 μm are vis-ible. Leyva-Ramos et al. have indicated that natural corn cob is an almost nonporous material because its surface area is less than 5 m2 g-1 [12].
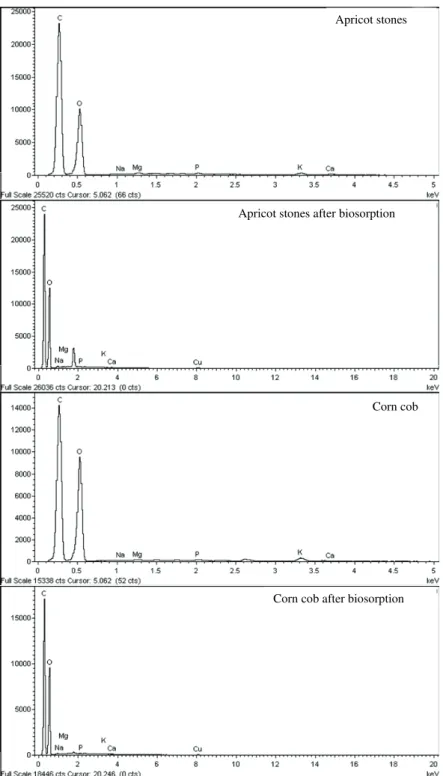
The EDX spectra of apricot stones and corn cobs are shown in Figure 2. Both spectra indicate the
presence of potassium, magnesium, phosphorus and calcium. Also, the spectra reveal presence of copper after biosorption treatment, indicating that binding of copper ions to the surface of the material has occur-red.
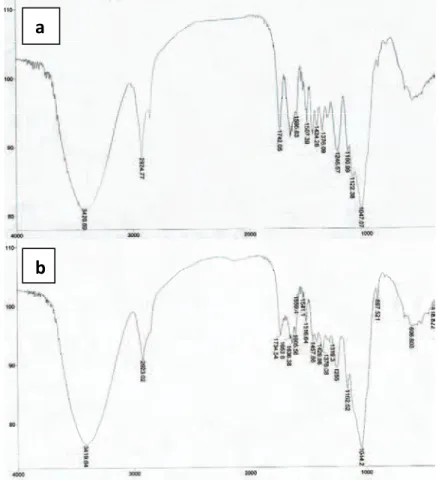
Analyses of NDF content (neutral detergent fiber) confirmed that both materials, apricot stones and corn cob, are lignocellulosic consisting of 79.05 and 84.74% of lignin, hemicellulose and cellulose, respectively. FTIR analysis of the selected
biomat-Apricot stones
Apricot stones after biosorption
Corn cob
Corn cob after biosorption
erials (Figure 3) showed high content of –COOH and – OH groups. Hydroxyl groups corresponding to carbo-xylic acids in cellulose and lignin are represented by broad, intense peaks at 3420 and 3421 cm-1 assigned to stretching vibrations of inter- and intra-molecular hydrogen bonds of polymeric compounds [33,34]. Furthermore, peaks observed at 2924 cm–1 can be attributed to symmetric and asymmetric C–H stretch-ing vibration of aliphatic acids, and peaks at 1742 cm-1 correspond to stretching vibration of C=O bonds pre-sent in non-ionic carboxyl groups like –COOH. Also, peaks at 1636 and 1647 cm-1 can be assigned to C=O stretching vibrations. Peaks at 1595 and 1605 cm-1 possibly relate to C=C stretching vibration, while 1507 and 1516 cm-1 could indicate presence of aromatic ring with C=C bonds. Two peaks at 1457 and 1424 cm-1 can be ascribed to C–O bond present in carbo-xylic groups, whereas number of peaks between 1376 and 1047 cm-1 can be assigned to C–O bonds in phe-nols. Intense peaks at 1047 and 1044 cm-1 can be ascribed to stretching vibrations of C–O bond present in carboxylic acids and alcohols [35]. It is highly possible that these groups in de-protonated forms are key sites for coordination of heavy metals [36].
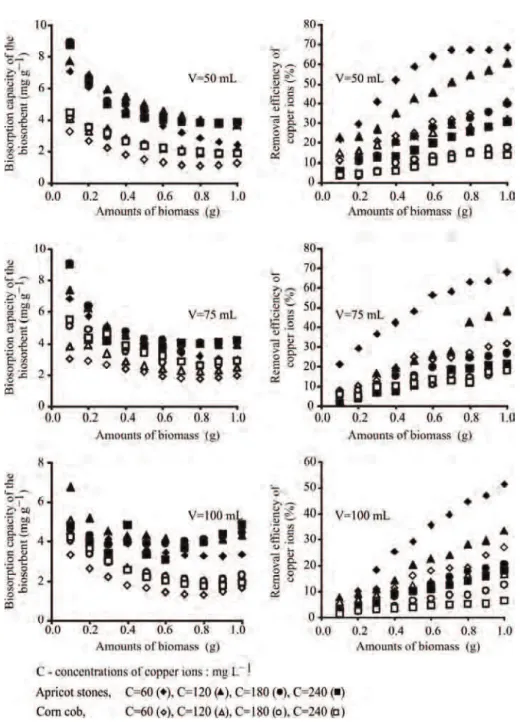
Figure 4 summarizes all experimental data and shows the effect of three variables (amount of
bio-mass, volume and initial concentration of metal sol-ution) on biosorption capacity and removal efficiency for both biosorbents. The ratio of amount of biomass and volume of metal solution is a very significant fac-tor for metal removal during biosorption process as it determines equilibrium of sorbent and sorbate in the system [37,38]. With increase of the amount of bio-mass, the biosorption capacity decreased, which can be attributed to overlapping or aggregation of biosorp-tion sites [39,40]. Figure 3 reveals that biosorpbiosorp-tion capacity increased and removal efficiency decreased with increase of initial concentration of copper ions in solution, which means that the biosorption process is highly dependent on initial concentration of copper ions [38]. Due to saturation of the active sites on the surface of the biosorbents, the biosorption capacity has a tendency to stagnate (the curve becomes flat-tened).
Comparison between biosorption capacities of some adsorbents investigated by other researches is shown in Table 1. The results of present study are compatible with similar biosorbents by its potential for heavy metal removal from aqueous solution.
Variables Ceq, R or q, for either apricot stones or corn cobs, varied significantly, implying that fitting of the experimental data could be performed using SOP
a
b
and ANN modelling. Calculation of objective function
F has been performed using Eq. (7).
Table 1. The biosorption capacites obtained for sorption of Cu(II) onto different types of agro-industrial wastes
Biosorbent q / mg g-1 Ref.
Pine cone shell 6.81 [7] Rice shell 2.95 [9] Cocoa shell 2.87 [10] Banana peel 4.75 [11] Orange peel 5.25 [11] Barley straw 4.64 [14]
Analysis of variance and SOP models
and V have been found statistically significant, and also interchange terms m×Ciand m×V). R was almost equally affected by linear terms of m and Ci, statis-tically significant at p < 0.05 level. It was also strongly affected by m, and also V and Ci (at p < 0.05 level). The quadratic term of Ci showed statistically signi-ficant impact on R calculation q was mostly influenced by linear and quadratic terms of m. Both linear and quadratic terms of Ci and V have been found statis-tically significant at p < 0.05 level. All variables con-sidered in the ANOVA analysis were also used for the ANN modelling.
The residual variance, marked as error in Table 2, presents the model disagreement with the expe-rimental values (contributions of other members that are not described in the SOP model). All the deve-loped models showed statistically insignificant devi-ation from the experimental values of the model, which confirmed their suitability. The r2
is also a share of output variability of the system, which was cal-culated based on regression analysis. High r2
values also indicated that the experimental data satisfactorily coincided with the mathematical models.
Analysis revealed that linear, quadratic, as well as interchange terms considerably influenced forming SOP models. It is concluded that all of the obtained models were statistically significant and in agreement with experimental results.
Neurons in the ANN hidden layer
Determination of the appropriate number of hid-den layers and number of hidhid-den neurons in each layer is one of the most critical tasks in ANN design. The number of neurons in a hidden layer depends on the complexity of the relationship between inputs and
outputs. As this relationship becomes more complex, more neurons should be added [30].
The optimum number of hidden neurons was chosen upon minimizing the difference between pre-dicted ANN values and desired outputs, using SOS
during testing as performance indicator. Results of
Ceq, R and q, for both apricot stones and corn cobs during testing with eight to nine neurons in the hidden layer are presented. Used MLPs are marked accord-ing to StatSoft Statistica’s notation, MLP followed by number of inputs, number of neurons in the hidden layer, and the number of outputs. According to ANN performance, regarding the sum of r2 and SOSs for all variables in one ANN, it was noticed that the optimal number of neurons in the hidden layer is 8 (network MLP 3-8-6), when obtaining high values of r2
and also low values of SOS.
The SOS between the experimental and the network predicted values was used as the iteration termination criterion, as StatSoft Statistica’s default. As soon as the cross-validation SOS starts to inc-rease, the training step is terminated; otherwise, the training step ends after a fixed number of epochs or training cycles [32].
Simulation of the ANNs
Process outputs Ceq, R and q, for both apricot stones and corn cobs can be calculated by the Eq. (6), using matrices W1 and B1, and matrices W2 and
B2, which represent the system, incorporating coef-ficients associated with the hidden layer (both weights and biases). Output variables are calculated by apply-ing transfer functions f1 and f2 (from Table 2) in the hidden and output layers, respectively, onto the mat-rix of input variables X using Eq. (6). The algebraic Table 2. ANOVA calculation; * - significant at p < 0.05 level; ** - significant at p < 0.10; level 95% confidence limit, error terms were found statistically insignificant; df - degrees of freedom
Variable df
Sum of squares
Apricot stones Corn cobs
Ceq R q Ceq R q
m 1 1501.3* 6335.5* 27.1* 340.7* 1538.8* 4.5*
m2 1 106.1* 135.1* 32.1* 19.2 15.3 11.4*
Ci 1 11274.9 *
2826.5* 8.6* 14227.1* 386.4* 7.4*
Ci2 1 595.3* 958.8* 7.5* 85.7* 101.5* 4.3*
V 1 977.4* 3022.3* 0.4 139.3* 652.4* 0.3*
V2 1 14.6 2.5 0.8** 183.4* 7.4 10.9*
m×Ci 1 628.2 *
1287.8* 2.2* 138.6* 339.2* 0.9*
m×V 1 621.6* 182.9* 23.7* 217.8* 89.8* 0.0
Ci×V 1 14.4 728.1 *
0.4 7.6 141.9* 0.2 Error 110 2034.0 1328.5 30.8 1452.4 809.8 7.3
system of equations is easily evaluated in a spread-sheet (i.e., Microsoft Excel) to predict Ceq, R and q, for both apricot stones and corn cobs, using Eq. (6), with shown calculated weights and biases matrices.
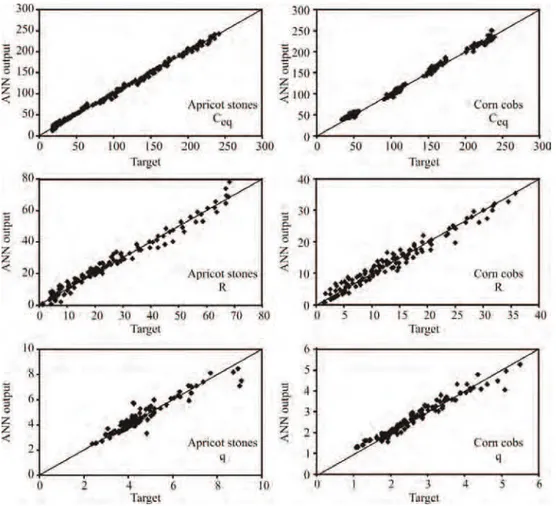
ANN models were used to predict experimental variables for both biosorption materials (Ceq, R and q). Figure 5 shows simulated curves in comparison with experimental data, for the best network found (MLP 3- -8-6). This network was able to predict reasonably well all process outputs for a broad range of the process variables, shown in Table 2. The predicted values were very close to the desired values in most cases, in terms of r2
value, for both SOP and ANN models. SOSs obtained with ANN models are of the same order of magnitude as experimental errors for
Ceq, R and q reported in the literature [32].
SOP models using StatSoft Statistica 10 were also developed, and sum of squares and r2 values are presented in Table 2. It can be seen that these r2 values are much lower than those associated with the ANN model, which is in agreement with other authors [28,29,32]. Although ANN models are more complex (86-96 weights-biases for Ceq, R and q model, for five different ANNs) than SOPs, ANNs performed a bit better because of the high nonlinearity of the
deve-loped system [32]. ANN models gained somewhat better results, compared to SOPs (Table 2), regarding the r2
comparison between experimental and cal-culated outputs. The r2
values between experimental and SOP model outputs for Ceq, R and q, were 0.996, 0.966 and 0.842, respectively (for apricot stones) and 0.997, 0.907 and 0.928, respectively (for corn cobs), while the best ANN model (MLP 3-8-6, No 1) gained: 0.998, 0.987 and 0.927, respectively (for apricot stones) and 0.998, 0.986 and 0.982, respectively (for corn cobs), during the training period.
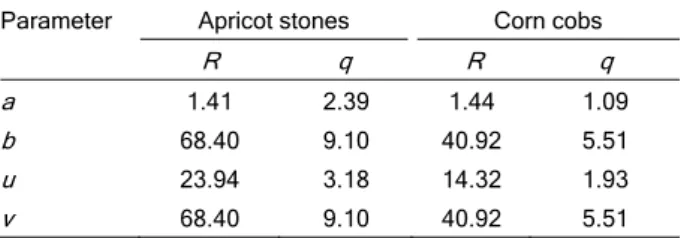
Fuzzy synthetic optimization
Fuzzy synthetic optimization of the output vari-ables was accomplished in order to find the m, Ci and
V that give optimums of R and q. Trapezoidal mem-bership function was used, according to Eq. (7), in which a-b covered the complete interval of obtained output values, and u-v represented the optimal values (Table 3). The optimal parameters, used for FSE evaluation, were given based on our experience, calculating m as 35% of b.
The objective function (F) is the mathematical function whose maximum would be determined, by summing the FSE results for the ANN model,
ing to Eq. (6). Each input parameter (m, Ci and V) has the equal influence on the function F:
= +
( , i, )
F m C V R q (8)
Table 3. Trapezoidal membership function parameters
Parameter Apricot stones Corn cobs
R q R q a 1.41 2.39 1.44 1.09
b 68.40 9.10 40.92 5.51
u 23.94 3.18 14.32 1.93
v 68.40 9.10 40.92 5.51
The maximum of function F represents the optimal m, Ci and V, and also the optimum of R and q, for both biosorption materials. The values of F were determined using Eq. (8). Values of membership function closer to 1 show the tendency of processing parameters to be optimal. Optimized process para-meters (inputs and outputs) for all groups are shown in Table 4.
Table 4. Optimizing parameters
Parameter Apricot stones Corn cobs Optimal inputs m Ci V m Ci V
0.3 120 50 0.3 120 50 Optimal outputs R q R q
26.9 5.9 18.9 3.4
CONCLUSIONS
SOP- and ANNs-based models were developed to find adequate parameters (amount of biomass, initial concentration and volume of metal solution) in order to get optimal relation between biosorption efficiency (R) and biosorption capacity (q) from a given set of experimental data (240 experimental runs). As compared to SOP model, the ANN model yielded a bit better fit of experimental data, according to r2 and SOS of both models. The determined opti-mal parameters for both materials were the same: 0.3 g of biomass, initial concentration of 120 mg L-1 and solution volume of 50 mL. At these conditions, the copper removal efficiency was 26.9, 18.9 and bio-sorption capacity was 5.9 and 3.4 mg g-1 for apricot stones and corn cob, respectively. Firstly, study demonstrates the usefulness of ANN-based model for copper biosorption from aqueous solutions using sel-ected agro industrial waste materials. Secondly, the results of present investigation show that apricot stones and corn cob can be used as low cost adsorb-ents for removing the Cu(II) ions from aqueous sol-ution.
Acknowledgement
The authors are grateful to the Ministry of Education, Science and Technological Development of the Republic of Serbia for the financial support of this investigation included in the projects TR 31003 and TR 31055, project cycle 2011-2015.
REFERENCES
[1] A. Özer, D. Özer, A. Özer, Process Biochem. 39 (2004) 2183–2191
[2] J.L. Zuane, R. J. Kiff, Hand book of drinking water quality, second ed., Van Nostrand Reinhold, New York, 1996 [3] F. Ekmekyapar, A. Aslan, Y.K. Bayhan, A. Cakici, J.
Hazard. Mater. 137 (2006) 293–298
[4] F.J. Cerino-Córdova, A.M. García-León, E. Soto-Regal-ado, M.N. Sánchez-González, T. Lozano-Ramírez, B.C. García-Avalos, J.A. Loredo-Medrano, J. Environ. Manage. 95 (2012) S77-S82
[5] N. Prakash, S.A. Manikandan, L. Govindarajan, V. Vijaya-gopal, J. Hazard. Mater. 152 (2008) 1268–1275
[6] J. Bayo, Chem. Eng. J. 191 (2012) 278–287
[7] G. Blázquez, M.A. Martín-Lara, E. Dionisio-Ruiz, G. Ten-orio, M. Calero, Ind. Eng. Chem. 18 (2012) 1741–1750 [8] N. Fiol, I. Villaescusa, M. Martinez, N. Miralles, J. Poch,
J. Serarols, Sep. Purif. Technol. 50 (2006) 132–140 [9] H. Aydin, Y. Bulut, C. Yerlikaya, J. Environ. Manage. 87
(2008) 37–45
[10] N. Meunier, J. Laroulandie, J.F. Blais, R.D Tyagi, Biores. Technol. 90 (2003) 255–263
[11] A. Annadurai, R.S. Juang, D.J. Lee, Water Sci. Technol. 47 (2002) 185–190
[12] R. Ramos, L.E. Landin-Rodriguez, S. Leyva-Ramos, N.A. Medellin-Castillo, Chem. Eng. J. 180 (2012) 113–120
[13] Z. Lopičić, J. Milojković, T. Šoštarić, M. Petrović, M. Mihajlović, Č. Lačnjevac, M. Stojanović, Hem. Iind. 67 (2013) 1007-1015
[14] E. Pehlivan, T. Altun, S. Parlayici, J. Hazard. Mater. 164 (2009) 982-986
[15] G. Annadurai, Y.L. La, F.L. Jiunn, Afr. J. Biotech. 6 (2007) 296–303
[16] F. Geyikci, E. Kılıc, S. Coruh, Ghosh Elevli, Chem. Eng. J. 183 (2012) 53–59
[17] K.H. Chu, Eur. J. Miner. Process. Environ. Prot. 3 (2003) 119–127
[18] K. Yetilmezsoy, S. Demirel, J. Hazard. Mater. 153 (2008) 1288–1300
[19] A.Ghosh, K. Sinha, P.D. Saha, Desalination Water Treat. 51 (2013) 7791-7799
[20] S. Klimmek, H.J. Stan, A. Wilke, G. Bunke, R. Buchholz, Environ. Sci. Technol. 35 (2001) 4283-4288
Processing Industry, Jahorina, Bosnia and Herzegovina, 2013, pp. 340-346
[22] T. Šoštarić, M. Petrović, Z. Lopičić, J. Milojković, Č. Lač -njevac, M. Stojanović, in Proceedings of III International Congress “Engineering, Environment and Materials in Processing Industry, Jahorina, Bosnia and Herzegovina, 2013, pp. 323-327
[23] M. Torab-Mostaedi. Chem. Ind. Chem. Eng. Q. 19 (2013); 79-88
[24] N. Chubar, J.R. Carvalho, M.J.N. Correia, Colloids Surfaces A: Physicochem. Eng. Aspects 230 (2003) 57– -65
[25] Statistica (Data Analysis Software System), v.10, StatSoft, Inc, Tulsa, OK, USA, 2010, (http://www.statsoft.com)
[26] M. Arsenović, Z. Radojević, S. Stanković, Ž. Lalić, L. Pezo, Ceram. Int. 39 (2013) 1667-1675
[27] S. Grieua, O. Faugeroux, A. Traoré, B. Claudet, J.L. Bodnar, Energy Build. 43 (2011) 543–554
[28] L.L. Pezo, B.Lj. Ćurčić, V.S. Filipović, M.R. Nićetin, G.B. Koprivica, N.M. Mišljenović, Lj.B. Lević, Hem. Ind. 67 (2013) 465-475
[29] I.C. Trulea, A.L. Raoult-Wack, G. Trystram, Food Sci. Technol. Int. 3 (1997) 459–465
[30] B.J. Taylor, Methods and Procedures for the Verification and Validation of Artificial Neural Networks, Springer Science and Business Media, Inc., New York, 2006 [31] T. Kollo, D. von Rosen, Advanced Multivariate Statistics
with Matrices, Mathematics and its applications, Vol. 579, Springer, Dordrecht, 2005.
[32] L.A. Basheer, M. Hajmeer, J. Microbiol. Meth. 43 (2000) 3–31
[33] R. Gnanasambandam, A. Protor, Food Chem.68 (2000) 327-332
[34] M. Iqbal, A. Saeed, S.I. Zafar, J. Hazard. Mater. 164 (2009) 161-171
[35] G. Guibaud, N. Tixier, A. Bouju, M. Baudu, Chemosphere 52 (2003) 1701-1710
[36] R. Ashkenazy, L. Gottlieb, S. Yannai, Biotechnol. Bioeng. 55 (1997) 1-10
[37] M.A. Hanif, R. Nadeem, H.N. Bhatti, N.R. Ahmed, T.M. Ansari, Ni(II) biosorption by Cassia fistula (golden shower) biomass, J. Hazard. Mater. 139 (2007) 345-355 [38] N. Ahalya, R.D. Kanamacdi, T.V. Ramachandra, Eur. J.
Biotechnol. 8 (2005) 258-264
[39] A.A. Pal, S. Ghosh, A.K. Paul, Bioresour. Technol. 97 (2006) 1253–1258
[40] S. Kahraman, D. Asma (Hamamci), S. Erdemoglu, O. Yesilada, Eng. Life Sci. 5 (2005) 72–77.
MARIJA S. PETROVIĆ1 TATJANA D. ŠOŠTARIĆ1 LATO L. PEZO2 SLAVKA M. STANKOVIĆ3
ČASLAV M. LAČNJEVAC4 JELENA V. MILOJKOVIĆ1 MIRJANA D. STOJANOVIĆ1 1
Institut za tehnologiju nuklearih I drugih mineralnih sirovina, Beograd
2
Institut za opštu i fizičku hemiju, Univerzitet u Beogradu, Beograd
3
Tehnološko-metalurški fakultet, Univerzitet u Beogradu, Beograd
4
Poljoprivredni fakultet, Univerzitet u Beogradu, Beograd
NAUČNI RAD
PRIMENA ANN MODELA NA PROCES
UKLANJANJA BAKRA IZ VODENIH RASTVORA
UPOTREBOM AGRO-INDUSTRIJSKOG OTPADA
U radu je ispitana mogućnost upotrebe lokalno dostupnih lignoceluloznih materijala kao potencijalnih biosorbenata u svrhu uklanjanja jona bakra iz vodenih rastvora. Ispitivani materijali predstavljaju čvrst otpad koji nastaje nakon prerade kukuruza (oklasak kukuruza) i nakon prerade voća (koštice kajsije). Ovakav otpad ima malu ekonomsku vrednost a njegovo odlaganje predstavlja ekološki problem. U šaržnom sistemu ispitani su uticaj inicijalne koncentracije Cu(II) jona (Ci), količine biomase (m) i zapremine rastvora (V) na
efikasnost biosorpcije i vrednost biosorpcionog kapaciteta. Utvrđeni su optimalni procesni parametri. Eksperimentalni rezultati su poređeni sa dva modela: SOP (second order poly-nomial regression models) i ANN (artificial neural networks), pri čemu je SOP model pokazao prihvatljiv determinacioni koefijent (0,842-0,997), dok je ANN pokazao visoku tačnost prognoze (0,980-0,986) u odnosu na eksperimentalne rezultate.