Article
Printed in Brazil - ©2016 Sociedade Brasileira de Química0103 - 5053 $6.00+0.00*e-mail: [email protected], [email protected]
Poly(dimethylsiloxane) and Poly[vinyltrimethoxysilane
-co-
2-(dimethylamino)
ethyl methacrylate] Based Cross-Linked Organic-Inorganic Hybrid Adsorbent for
Copper(II) Removal from Aqueous Solutions
Fábio A. B. Silva,a Fátima A. Chagas-Silva,a Fábio H. Florenzanob and
Fábio L. Pissetti*,a
aInstituto de Química, Universidade Federal de Alfenas (UNIFAL-MG),
37130-000 Alfenas-MG, Brazil
bDepartamento de Engenharia de Materiais, Escola de Engenharia de Lorena, Universidade de São
Paulo (USP), 12602-810 Lorena-SP, Brazil
An organic-inorganic hybrid adsorbent was prepared and its application for the uptake of CuII ions from aqueous solutions was studied. The polymer network was composed of
poly(dimethylsiloxane) (PDMS), vinyltrimethoxysilane (VTMS), and 2-(dimethylamino)ethyl methacrylate (DMAEMA), described as PDMS-net-P(VTMS-co-DMAEMA). The chemical groups, thermal stability and morphology of this hybrid adsorbent were characterized using techniques of attenuated total reflectance Fourier transform infrared spectroscopy (ATR-FTIR), differential scanning calorimetry (DSC), thermogravimetric analysis (TGA), and scanning electron microscopy (SEM). In adsorption studies, saturation of the active sites of the material was observed at pH 5, after 3 days, with each gram of material capable of adsorbing 0.48 mmol of copper(II). The fractionary-order and Sips models provided the best fits to the experimental data in kinetic and equilibrium studies of the adsorption process, respectively. Moreover, an acceptable reusability was found for this cross-linked organic-inorganic hybrid adsorbent after usage-regeneration cycles without significantly losing its original activity.
Keywords: poly(dimethylsiloxane), 2-(dimethylamino)ethyl methacrylate, polymer network, heavy metal ions removal, adsorption-desorption cycles
Introduction
The contamination of water resources with metal ions such as zinc, copper, nickel, mercury, cadmium, lead, and chromium has attracted much attention because of their non-biodegradable nature and tendency to accumulate in living organisms.1-3 Among these metals, copper is a trace element that is essential for the growth of plants, animals, and humans. However, excess of copper in the environment can threaten aquatic species and human health. For example, a high concentration of copper in the human body can damage the liver and kidneys.4,5 Therefore, it has become necessary to exploit practical techniques employed for efficiently removing copper from aqueous solutions.
Different methods have been used for the removal of heavy metal ions, including chemical precipitation, ion exchange, adsorption, membrane filtration, and
electrochemical treatment technologies.6 Among these, adsorption is known to be one of the most effective and economical heavy metal separation methods for wastewater treatment. Furthermore, because of the reversible nature of most adsorption processes, the adsorbents can be regenerated using desorption processes.7
Organic-inorganic hybrid materials have attracted attention in the search for selective adsorbents that are stable and can be applied for the removal of metals from aqueous solutions.7-12 Some of the most important characteristics that can be obtained with this type of material are thermal and mechanical stabilities derived from inorganic bonds, combined to hydrophilicity and selectivity from the organic functional groups.13
flexibility, high thermal stability, high oxidation stability, low chemical reactivity, and low toxicity.19,20 Polysiloxanes networks can be prepared by condensation of the terminal silanol (Si−OH) with a crosslinker containing alkoxy or silanol functions.21,22 These reactions can be catalyzed by alkyl tin salts.23 An example of a trifunctional crosslinker for this purpose is vinyltrimethoxysilane (VTMS) [H2C=CHSi(OCH3)3], which also features a vinyl group (−CH=CH2) in its structure that can be used to perform free radical polymerization.24,25
Various organic functional groups can be incorporated into a material to be used in copper removal, such as the carboxyl,26 hydroxyl,27 amine,28 thiol,29 sulfonic,30 and phosphoric31 groups. For example, 2-(dimethylamino) e t hy l m e t h a c r y l a t e ( D M A E M A ) [ C H2= C ( C H3) COOCH2CH2N(CH3)2] is a hydrophilic monomer with ester and tertiary amine groups in its structure, along with a vinyl function allowing its polymerization. According to the literature, DMAEMA-containing materials exhibit high efficiency when applied to the removal of heavy metals from aqueous solutions.1,4,32-36
This paper reports the preparation and characterization of an organic-inorganic hybrid material for the removal of copper(II) from aqueous solutions, based on PDMS as an inorganic precursor, VTMS as a crosslinker, and DMAEMA as an organic component with adsorbent potential.
Experimental
Materials
The following materials were used: vinyltrimethoxysilane 98%, 2-(dimethylamino)ethyl methacrylate 98%, poly(dimethylsiloxane) containing silanol terminals groups (viscosity 90-150 cSt), benzoyl peroxide, dibutyltin diacetate (all from Sigma-Aldrich, St. Louis, MO, USA) and toluene (Synth, Diadema, SP, Brazil). De-Hibit-200 resin (Polysciences, Warrington, PA, USA) was previously used to remove the inhibitor present from DMAEMA monomer.
Preparation of P(VTMS-co-DMAEMA) and PDMAEMA
Poly[vinyltrimethoxysilane-co-2-(dimethylamino)ethyl methacrylate] P(VTMS-co-DMAEMA) was prepared by free radical polymerization (FRP) of VTMS:DMAEMA with a molar ratio of 1:2, using benzoyl peroxide as initiator and toluene as the solvent. The reaction mixture was stirred using a magnetic stir-bar for 5 h at about 80 °C, under reflux in a nitrogen atmosphere (N2). To terminate the polymerization, the flask was immersed in ice water. The reaction product was reserved for the next step.
P o l y [ 2 - ( d i m e t hy l a m i n o ) e t hy l m e t h a c r y l a t e ] (PDMAEMA) was prepared as a reference material under the same conditions described above for the copolymer.
Preparation of polymer network based on PDMS and P(VTMS-co-DMAEMA)
Poly(dimethylsiloxane) containing silanol terminals groups was added to the reaction product from the previous step at a weight ratio of 1:1 relative to VTMS. Dibutyltin diacetate was used as a catalyst (1% by weight relative to PDMS). This mixture was stirred for 30 min. The resulting viscous solution was placed in TeflonTM petri dishes. After complete curing, the solid film obtained was immersed in water for 30 days to remove any unbound reagents from the network. After this period, the material was powdered and washed with tetrahydrofuran and ethanol to remove remaining residues and possible by-products of the PDMS chain condensation. Finally, the material was dried at 60 °C under vacuum for 48 h. The polymer network was designated as PVD, i.e., PDMS-net-P(VTMS -co-DMAEMA).
Characterization methods
Attenuated total reflectance Fourier transform infrared (ATR-FTIR) spectra were obtained using a Thermo Scientific spectrophotometer model Nicolet iS50 FT-IR (Waltham, MA, USA) with the Pike GladiATR accessory. The measurements were obtained at a 4 cm−1 resolution from 32 scans.
Curves of differential scanning calorimetry (DSC) were obtained using a Seiko Exstar 7020 (Torrance, CA, USA) under flowing nitrogen (50 mL min−1), at a temperature ranging from 15 to 75 °C and a heating rate of 3 °C min−1.
The thermogravimetric curves were acquired using TA Instruments equipment model TGA 2950 (New Castle, DE, USA). The measurements were performed under nitrogen (100 mL min−1) at a heating rate of 20 °C min−1 over a temperature range of 25-1100 °C.
Micrographs were obtained using a Hitachi TM3000 (Tokyo, Japan) tabletop scanning electron microscope (SEM) with an accelerating voltage of 15 kV. The samples were first covered with a thin gold layer using a BalTec MED 020 sputtering instrument (Canonsburg, PA, USA).
Swelling measurements in water
water at 30 °C. The weight of the swollen sample was measured periodically after rapid drying on filter paper. The amount of water adsorbed at time t per gram of film (g H2O g−1 film), defined as Qwt, was calculated as follows:37
(1)
where Ws is the weight of the swollen sample at time t (g), and Wd is the weight of the dry sample (g).
Copper(II) adsorption study
In this study, 100 mg samples of the powdered material and 50 mL of a CuCl2 aqueous solution were placed in 125 mL Erlenmeyer flasks. The solutions were stirred for 3 days at 30 °C using a Quimis Dubnoff bath model Q226M (Diadema, SP, Brazil).
The effect of the pH (1-5) was investigated using initial concentrations of 5 mmol L−1 of copper(II). The pH values were adjusted with dilute solutions of HCl and NaOH using a Bel Engineering pH meter model W3B (Monza, MB, Italy). This study was performed up to pH 5, because the precipitation of metal hydroxide occurs at higher pH values.38 The influence of the pH on the copper(II) adsorption was plotted as the adsorbed capacity vs. initial pH, because it was possible to obtain the pH at which the adsorption reached the maximum capacity.
The study of the adsorption capacity was done using adsorption isotherms. Solutions were prepared with different molar concentrations of copper(II), ranging from 0.4 to 5 mmol L−1. The concentrations were determined using a flame atomic absorption spectrophotometer (FAAS; model AA-7000, Shimadzu, Tokyo, Japan).
The amount of adsorbed metal was determined by equation 2:16
(2)
where qe is the amount of adsorbed metal at equilibrium per gram of material (mmol g−1); n0 is the initial molar amount of metal (mmol) in solution; ne is the molar amount of metal in solution on the equilibrium (mmol); and m is the mass of the adsorbent (g).
Kinetic and equilibrium models
The kinetic and equilibrium models were fitted with a non-linear fitting method using OriginPro 8.5 software (OriginLab, Northampton, UK).
The following models were tested to evaluate the adsorption kinetics: pseudo-first order,39 pseudo-second order,40 chemisorption (Elovich),41 fractionary order (Avrami),42 and intraparticle diffusion.43
The isotherm models used to evaluate the equilibrium isotherm were: Langmuir,44 Freundlich,45 Sips,46 and Redlich-Peterson.47
Statistical evaluation of kinetic and isotherm parameters
The models were evaluated using an error function (Ferror), which measured the differences in the amounts of metal adsorbed by the adsorbent (q), as predicted by the models and measured experimentally, considering the number of parameters of the fitted model. Equation 3 shows how Ferror was calculated:48
(3)
where n is the number of experiments performed; p is the number of parameters of the fitted model; qi,exp is each value of q measured experimentally; and qi,model is each value of q predicted by the fitted model.
However, to define if the model is adequate to the experimental data, Fexp value was calculated to compare the (Ferror)2 (residual dispersion) with the dispersion of single experimental values (Sqexp)2 (standard deviation) as follows:48
(4)
A comparison of it with the corresponding critical value (Fcrit) was performed (5% point of the F distribution for (n − p) and α degrees of freedom. When Fexp > Fcrit, the model cannot be considered as adequate to the adsorption system.
Desorption and reuse studies
(5)
Results and Discussion
The first step describes the preparation of P(VTMS
-co-DMAEMA) by FRP of VTMS:DMAEMA, as reported in a previous work.49 Figure S1 (see Supplementary Information) show proton (1H) nuclear magnetic resonance (NMR) spectrum of this copolymer at different ranges of chemical shift. Singlet at 2.370 ppm was assigned to the –N(CH3)2, whereas, –Si–O–CH3 protons shows triplet at 3.240 ppm. Singlet at 1.429 ppm aroused due to −CH2−(DMAEMA) attached to the other end of VTMS unit, while singlet at 1.175 ppm was attributed to −CH2−(VTMS) attached to the DMAEMA unit on one end.49 ATR-FTIR spectrum of P(VTMS-co-DMAEMA) (Figure S2) presented absorption bands between 1075-1212 cm−1 due to Si–O–CH2 vibrations. Absorption band at 1454 cm−1 was related to scissor vibrations of –CH2 and at 1722 cm−1 due to C=O stretching vibrations. Absorption band at 2821 cm−1 was aroused due to –CH2 asymmetric vibrations. Bands between 1236 and 1058 cm−1 were observed due to stretching vibrations of tertiary amine groups.50,51 All these results suggest the formation of copolymer between VTMS and DMAEMA as represented in Scheme 1.
Scheme 2 illustrates the initial formation of the polymer network designated as PVD [PDMS-net-P(VTMS
-co-DMAEMA)]. In this step, polycondensation reactions are observed between silanol terminations (Si−OH) of PDMS and methoxy functions of vinyltrimethoxysilane.14-18,21,22
Attenuated total reflectance Fourier transform infrared spectroscopy (ATR-FTIR)
Figure 1 presents the infrared spectra for PDMS, VTMS, PDMAEMA, and PVD. For the PVD, bands were observed between 1100 and 1020 cm−1, those
represent the asymmetric stretching of Si–O–Si and are characteristic of a PDMS polymeric network.14 The bands at 1408 and 1258 cm−1 were related to the asymmetric and symmetrical deformations of the C–H bond of the Si(CH3)2 groups, respectively. The rocking deformation of C–H and Si–C bond stretching were observed at 843 and 790 cm−1, respectively.15 The band at 1728 cm−1 was related to –C(O)O– (ester) vibrational stretching derived from DMAEMA.50,51 These results suggest the inclusion of DMAEMA in the prepared PDMS network.
Thermal analyses: differential scanning calorimetry (DSC) and thermogravimetric analysis (TGA)
Figures 2a and 2c show DSC curves for PDMAEMA and PVD, respectively. The glass transition temperature (Tg) characteristic of DMAEMA was observed at approximately 32 °C for both materials,52,53 indicating the formation of the polymer into the polymeric network.
The thermogravimetric analisis (TGA) and their derivatives (derivative thermogravimetric analysis, DTG) for PDMAEMA and PVD are presented in Figures 2b and 2d, respectively. For PDMAEMA, a weight loss of about 50% was observed between 245 and 365 °C, followed by another event between 365 and 475 °C, until its complete decomposition.54 PVD was thermally stable up to 270 °C. A
Scheme 1. Schematic representation of preparation of P(VTMS
-co-DMAEMA).
Scheme 2. Schematic representation of preparation of PVD [PDMS
weight loss of 5% at 350 °C can be associated with the first DMAEMA degradation step. Next, another weight loss was observed associated with simultaneous events involving the final decomposition of DMAEMA and depolymerization of PDMS chains. A mass residue of 60% at 1100 °C is obtained, indicating a high degree of reticulation.22 Based on the value of the first weight loss, it is estimated that 10% of the material was composed of DMAEMA.
These results indicate the formation of a PDMS network with the incorporation of DMAEMA and a high rate of
crosslinking, with the possible formation of silsesquioxane clusters with larger dimensions than those reported in the existing literature.15,18
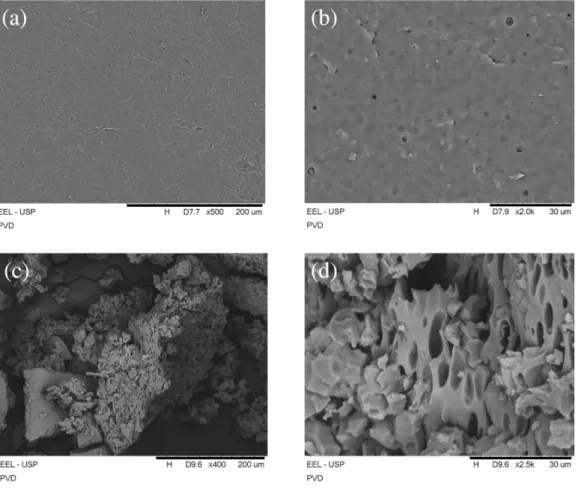
Scanning electron microscopy (SEM)
Figure 3 shows SEM micrographs of PVD. According to the literature, pure PDMS materials exhibit a homogeneous, dense, and smooth surface, with a nonporous morphology.55,56 In Figures 3a and 3b, it can be observed that the surface of
Figure 1. Fourier transform infrared spectroscopy (ATR-FTIR) spectra: (a) poly(dimethylsiloxane) (PDMS); (b) vinyltrimethoxysilane (VTMS); (c) poly[2-(dimethylamino)ethyl methacrylate] (PDMAEMA); and (d) PDMS-net-P(VTMS-co-DMAEMA) (PVD).
the PVD film has a small number of pores. However, the micrographs from the fractures (Figures 3c and 3d) show a morphology with a higher degree of porosity. This pore formation of PVD indicates the presence of DMAEMA inside the modified PDMS network.
Swelling measurements in water
The swelling equilibrium (Figure 4) was reached at 0.24 g H2O g−1 film, after approximately 25 days. This time can be justified by the high hydrophobicity of PDMS, which hindered the diffusion of water into the film.57,58 It is also interesting to note that, once equilibrium was reached, the water swelling remained practically constant until 40 days, indicating the absence of DMAEMA leaching phenomena during this period. This result indicates that PVD has the potential to be applied in an aqueous medium. However, the process is overall time-consuming and one of the main obstacles of the prepared adsorbent.
Effects of pH on adsorption
The pH of a solution can affect the surface charge and
degree of ionization of the adsorbents, which can lead to a shift in the process kinetics and equilibrium characteristics of the adsorption.59
The study of the initial pH effect on copper(II) adsorption capacity of PVD in water is presented in Figure 5. At acidic conditions, lower amount of copper ions was adsorbed due to the protonation of the amino group to form ammonium salts. With increase in the pH of the
Figure 3. Scanning electron microscopy (SEM) micrographs of PDMS-net-P(VTMS-co-DMAEMA) (PVD) at different magnifications: (a), (b) film surface and (c), (d) powdered material.
Figure 4. Amount of water adsorbed by PDMS-net-P(VTMS
solution, the adsorbed amount of copper ion increased, reaching a maximum at pH 5. This effect can be associated to a lower extension of protonation of amino groups due the higher pH. Similar phenomenon was obtained for the sorption of Cu2+ ions on activated carbon functionalized with PDMAEMA.33
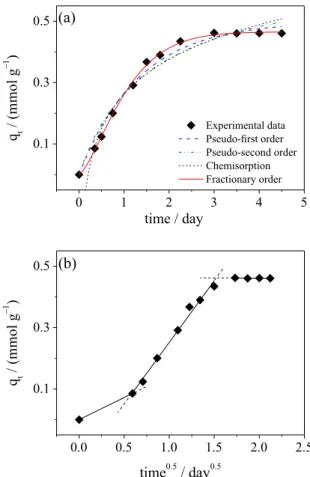
Kinetic studies
Figure 6 and Table 1 present the kinetic studies and parameter values of copper(II) adsorption for PVD from aqueous solutions, respectively. The adsorbent and adsorbate interaction time required to achieve equilibrium (or saturation) was measured to be 3 days (72 h).
To study the adsorbate-adsorbent correlation over time, theoretical models were employed using a nonlinear adjustment method (Figure 6a). To all models studied Fexp < Fcrit showing that these can describe the experimental data of the kinetic studies.
The calculated qe values from the kinetic models of pseudo-first order, pseudo-second order and fractionary order were 0.499, 0.667 and 0.465, respectively. When comparing with experimental qe (0.48), it can be observed that the pseudo-first order and fractionary order are closer. However, the fractionary model of Avrami was presented the best correlation, with the greatest determination factor (R2 = 0.9983) and the minor error function (Ferror = 0.00614).
The intraparticle diffusion model was used to assess the effect of resistance on the mass transfer in the copper(II) adsorption by the active sites of the material.60 Figure 6b shows the amount of adsorbed metal at time t per gram of material (qt) vs. the root square of time (time0.5). According to this Weber-Morris model, the intraparticle diffusion may be considered as the rate-limiting step only in the case of linear dependence of qt on time0.5.43 The multilinearity of
the plot indicates that the intraparticle diffusion is not the only rate-limiting step.
Equilibrium studies
Figure 7 presents the adsorption isotherms of copper(II) for PVD in water and simulation curves obtained using the several adsorption models studied. The adsorption maximum was 0.48 mmol of copper(II) (or 30 mg) per gram of material.
The parameters of the studied models for copper(II) adsorption of PVD are listed in Table 2. All models can be considered as adequate since Fexp < Fcrit. However, the Sips model showed the best fit to the experimental data, with a low error function value (0.0302) and high R2 value (0.9982). This model is a combination of the Langmuir and Freundlich models. At low concentrations, it follows the Freundlich model, considering multilayer adsorption, while at high concentrations, it follows the Langmuir model, considering the existence of a saturation point, characterized by monolayer adsorption.60 The Sips model suggests which the surface is energetically heterogeneous.61
Figure 5. Effect of initial pH on copper(II) adsorption capacity of PDMS -net-P(VTMS-co-DMAEMA) (PVD) from aqueous solutions.
Figure 6. Adsorption kinetic of copper(II) for PDMS-net-P(VTMS
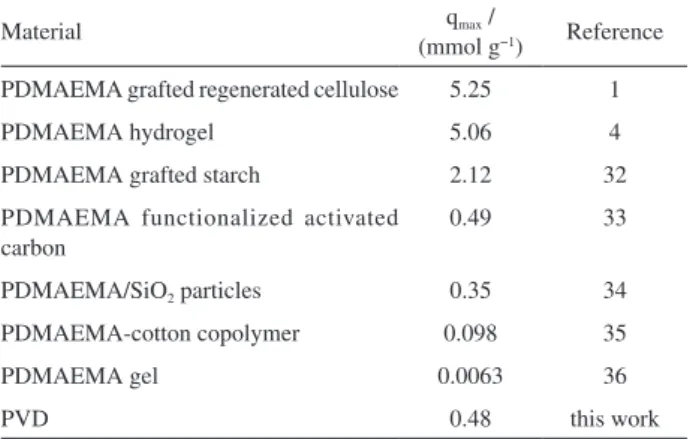
Copper(II) adsorption capacities of different functional materials are listed in Table 3. The polymeric network prepared in this work presents a copper(II) removal similar to some other materials that also contain PDMAEMA in their compositions, where the amount removed varies
according to the amount of functional groups incorporated into each material.
Desorption and reuse studies
Figure 5 (effect of the pH on adsorption) showed that hybrid adsorbent did not adsorb significantly CuII ions at pH < 2, which suggested that the adsorbed metal ions could possibly be desorbed in a solution with such pH values. Other similar studies62-64 have also reported effective desorption of adsorbed metals in acidic conditions.
Furthermore, adsorption-desorption cycles can be repeated to examine the reusability and metal recovery efficiency of the adsorbent. Figure 8 shows the CuII ions removal after three sequential runs, with a reduction rate of about 5% after each cycle. This result indicates that the adsorbent can be regenerate and used several times.
Conclusions
This paper described the preparation and characterization
Table 1. Kinetic parameters for copper(II) adsorption on PDMS-net-P(VTMS-co-DMAEMA) (PVD)
Kinetic model Equation Parameter Data
Pseudo-first order
qe / (mmol g−1) k1 / h−1
R2 Ferror
Fexp Fcrit
0.499 0.758 0.9819 0.0228 0.0181 2.54
Pseudo-second order
qe / (mmol g−1) k2 / (g mmol−1 h−1)
R2 Ferror
Fexp Fcrit
0.667 0.979 0.9666 0.0307 0.0334 2.54
Chemisorption (Elovich)
α / (mmol g−1 h−1)
β/ (g mmol−1) R2 Ferror
Fexp Fcrit
0.816 6.13 0.9702 0.0290 0.0298 2.54
Fractionary order (Avrami)
qe / (mmol g−1) kAV / h−1
nAV R2 Ferror
Fexp Fcrit
0.465 0.872 1.40 0.9983 0.00614 0.00134 2.71
Intraparticle diffusion kid / (mmol g−1 h−0.5) 0.403a
aSecond stage. q
t: Amount of metal ions adsorbed at time t; qe: amount of adsorbed metal at equilibrium per gram material; t: time of contact; k1: pseudo-first order rate constant; k2: pseudo-second order rate constant; α: initial adsorption rate of Elovich equation; β: Elovich constant related to the extent of surface coverage and also to the activation energy involved in chemisorption; kAV: Avrami kinetic constant; nAV: fractionary reaction order (Avrami) related to adsorption mechanism; kid: intraparticle diffusion rate constant.
of a hybrid polymer network based on PDMS and P(VTMS-co-DMAEMA). This material showed potential for adsorption of heavy metals such as copper(II) from aqueous solutions, achieving the highest efficiency at pH 5. The fractionary order and Sips models were the best ones from those studied to describe the adsorption kinetics
and adsorbent-adsorbate interactions, respectively. The regeneration studies also revealed the good potential of this hybrid material as a reusable adsorbent.
Supplementary Information
Supplementary data are available free of charge at http://jbcs.sbq.org.br as PDF file.
Table 2. Isotherm parameters for copper(II) adsorption on PDMS-net-P(VTMS-co-DMAEMA) (PVD)
Isotherm model Equation Parameter Data
Langmuir
qs / (mmol g−1) KL / (mmol L−1)
R2 Ferror Fexp Fcrit
1.38 0.165 0.9318 0.0565 0.111
2.93
Freundlich
KF / (mmol g−1) (mmol L−1)n nF
R2 Ferror Fexp Fcrit
0.190 1.25 0.9064 0.0648 0.146
2.93
Sips
qs / (mmol g−1) Ks / (mmol L−1)
nS R2 Ferror Fexp Fcrit
0.522 0.458 0.386 0.9982 0.0302 0.0318 3.23
Redlich-Peterson
KR / (g L−1) aR / (mmol L− 1)
g R2 Ferror Fexp Fcrit
0.228 0.164 1.00 0.9221 0.0605 0.127
3.23
qe: Amount of adsorbed metal at equilibrium per gram material; qS: theoretical saturation capacity; KL: Langmuir affinity constant; Ce: metal concentration at equilibrium; KF and nF: constant and exponent of Freundlich model, respectively; KS and nS: constant and exponent of Sips model, respectively; KR and aR: constant and g is exponent of Redlich–Peterson model, respectively.
Table 3. Comparison of maxima adsorption capacities (qmax) of copper(II) on different materials
Material qmax /
(mmol g−1) Reference
PDMAEMA grafted regenerated cellulose 5.25 1
PDMAEMA hydrogel 5.06 4
PDMAEMA grafted starch 2.12 32
PDMAEMA functionalized activated carbon
0.49 33
PDMAEMA/SiO2 particles 0.35 34
PDMAEMA-cotton copolymer 0.098 35
PDMAEMA gel 0.0063 36
PVD 0.48 this work
DMAEMA: 2-(Dimethylamino)ethyl methacrylate; PDMAEMA: poly[2-(dimethylamino)ethyl methacrylate]; PDMS: poly(dimethylsiloxane); PVD: PDMS-net-P(VTMS-co-DMAEMA); VTMS: vinyltrimethoxysilane.
Figure 8. Cycles of CuII adsorption-desorption for PDMS-net-P(VTMS
Acknowledgments
The authors are indebted to CAPES for the F. A. B. S. PhD fellowship; and CNPq, FAPEMIG, and FAPESP for their financial support.
References
1. Jiang, M.; Wang, J.; Li, L.; Pan, K.; Cao, B.; RSC Adv. 2013,
3, 20625.
2. Torres, J. D.; Faria, E. A.; Prado, A. G.; J. Hazard. Mater.2006,
129, 239.
3. Jiang, Y.; Pang, H.; Liao, B.; J. Hazard. Mater. 2009,
164, 1.
4. Kavakh, P. A.; Yilmaz, Z.; Sen, M.; Sep. Sci. Technol. (Philadelphia, U. S.)2007, 42, 1245.
5. Kampalanonwat, P.; Supaphol, P.; Ind. Eng. Chem. Res.2011,
50, 11912.
6. Fu, F.; Wang, Q.; J. Environ. Manage. 2011, 92, 407. 7. Samiey, B.; Cheng, C. H.; Wu, J. N.; Materials2014, 7, 673. 8. Hoffmann, F.; Cornelius, M.; Morell, J.; Fröba, M.; Angew.
Chem., Int. Ed.2006, 45, 3216.
9. Bozbas, S. K.; Ay, U.; Kayan, A.; Desalin. Water Treat. 2013,
51, 7208.
10. Zhang, Y.; Wang, X.; Liu, J.; Wu, L.; J. Chem. Eng. Data2013,
58, 1141.
11. Larraza, I.; Lopez-Gonzalez, M.; Corrales, T.; Marcelo, G.; J. Colloid Interface Sci.2012, 385, 24.
12. Pandey, S.; Mishra, S. B.; J. Sol-Gel Sci. Technol. 2011, 59, 73. 13. Rao, H.-X.; Liu, F.-N.; Zhang, Z.-Y.; J. Membr. Sci.2007, 303,
132.
14. Pissetti, F. L.; Magosso, H. A.; Yoshida, I. V.; Gushikem, Y.; Myernyi, S. O.; Kholin, Y. V.; J. Colloid Interface Sci.2007,
314, 38.
15. Pissetti, F. L.; Yoshida, I. V. P.; Gushikem, Y.; Kholin, Y. V.;
Colloids Surf., A 2008, 328, 21.
16. dos Santos, M. P.; Magosso, H. A.; Yoshida, I. V. P.; Gushikem, Y.; Colloids Surf., A 2012, 398, 1.
17. Silva, F. A. B.; Pissetti, F. L.; J. Colloid Interface Sci.2014,
416, 95.
18. Pissetti, F. L.; de Araújo, P. L.; Silva, F. A. B.; Poirier, G. Y.;
J. Braz. Chem. Soc.2015, 26, 266.
19. Zhang, X.; Lin, G.; Kumar, S. R.; Mark, J. E.; Polymer2009,
50, 5414.
20. Mark, J. E.; Acc. Chem. Res. 2004, 37, 946.
21. Ibrahim, W. A. W.; Ismail, W. N. W.; Keyon, A. S. A.; Sanagi, M. M.; J. Sol-Gel Sci. Technol.2011, 58, 602.
22. Silva, F. A. B.; Florenzano, F. H.; Pissetti, F. L.; J. Sol-Gel Sci. Technol.2014, 72, 227.
23. Vankelecom, I. F. J.; Chem. Rev. (Washington, DC, U. S.)2002,
102, 3779.
24. Lim, M.; Kim, D.; Seo, J.; Han, H.; Macromol. Res.2014, 22, 1096.
25. Abe, Y.; Namiki, T.; Tuchida, K.; Nagao, Y.; Misono, T.;
J. Non-Cryst. Solids1992, 147, 47. 26. Crini, G.; Prog. Polym. Sci.2005, 30, 38.
27. Fristak, V.; Pipiska, M.; Lesny, J.; Soja, G.; Friesl-Hanl, W.; Packova, A.; Environ. Monit. Assess.2015, 187, 4093. 28. Neghlani, P. K.; Rafizadeh, M.; Taromi, F. A.; J. Hazard. Mater.
2011, 186, 182.
29. Yong, S. K.; Bolan, N.; Lombi, E.; Skinner, W.; Water, Air, Soil Pollut.2013, 224, 1720.
30. Ge, Y.; Li, Z.; Xiao, D.; Xiong, P.; Ye, N.; J. Ind. Eng. Chem. (Amsterdam, Neth.)2014, 20, 1765.
31. Huynh, H. T.; Tanaka, M.; Ind. Eng. Chem. Res.2003, 42, 4050.
32. Zhang, L. M.; Chen, D. Q.; Colloids Surf., A2002, 205, 231. 33. Zhu, S.; Yang, N.; Zhang, D.; Mater. Chem. Phys.2009, 113,
784.
34. Gao, B.; Chen, Y.; Zhang, Z.; Appl. Surf. Sci.2010, 257, 254. 35. Waly, A.; Abdel-Mohdy, F. A.; Aly, A. S.; Hebeish, A.; J. Appl.
Polym. Sci.1998, 68, 2151.
36. Tokuyama, H.; Ishihara, N.; React. Funct. Polym.2010, 70, 610.
37. Panou, A. I.; Papadokostaki, K. G.; Tarantili, P. A.; Sanopoulou, M.; Eur. Polym. J.2013, 49, 1803.
38. Wu, A.; Jia, J.; Luan, S.; Colloids Surf., A2011, 384, 180. 39. Lagergren, S.; Kgl. Vetenskaps Akad.1898, 24, 1.
40. Ho, Y. S.; McKay, G.; Process Biochem. (Oxford, U. K.)1999,
34, 451.
41. Elovich, S. Y.; Zhabrova, G. M.; Zh. Fiz. Khim.1939, 13, 1761. 42. Cardoso, N. F.; Lima, E. C.; Pinto, I. S.; Amavisca, C. V.; Royer,
B.; Pinto, R. B.; Alencar, W. S.; Pereira, S. F. P.; J. Environ. Manage.2011, 92, 1237.
43. Weber, W.; Morris, J.; J. Sanit. Eng. Div., Am. Soc. Civ. Eng.
1963, 89, 31.
44. Langmuir, I.; J. Am. Chem. Soc.1918, 40, 1361. 45. Freundlich, H. M. F.; Z. Phys. Chem.1906, 57, 385.
46. Ghaznavi, F.; Fatemi, S.; Joda, M.; Can. J. Chem. Eng.2012,
90, 769.
47. Redlich, O.; Peterson, D. L.; J. Phys. Chem.1959, 63, 1024. 48. Skoog, D. A.; West, D. M.; Holler, F. J.; Crouch, S. R.;
Fundamentals of Analytical Chemistry, 9th ed.; Cengage
Learning: Boston, 2013.
49. Chakrabarty, T.; Prakash, S.; Shahi, V. K.; J. Membr. Sci.2013,
428, 86.
50. Estrada-Villegas, G. M.; Macossay, J.; Bucio, E.; J. Radioanal. Nucl. Chem.2010, 284, 131.
51. Hernández-Martínez, A. R.; Bucio, E.; J. Radioanal. Nucl. Chem.2010, 283, 559.
52. Gao, C.; Liu, M.; Chen, J.; Chen, C.; Polym. Adv. Technol.2012,
53. Chen, S.-C.; Kuo, S.-W.; Liao, C.-S.; Chang, F.-C.;
Macromolecules (Washington, DC, U. S.)2008, 41, 8865. 54. Pal, S.; Roy, S. G.; De, P.; Polym. Chem. 2014, 5, 1275. 55. Naeimi, M.; Karkhaneh, A.; Barzin, J.; Khorasani, M. T.;
Ghaffarieh, A.; J. Appl. Polym. Sci.2013, 127, 3940. 56. Li, S.; Qin, F.; Qin, P.; Karim, M. N.; Tan, T.; Green Chem.
2013, 15, 2180.
57. Bodas, D.; Khan-Malek, C.; Sens. Actuators, B2007, 123, 368. 58. Hillborg, H.; Gedde, U. W.; IEEE Trans. Dielectr. Electr. Insul.
1999, 6, 703.
59. Srivastava, V. C.; Mall, I. D.; Mishra, I. M.; J. Hazard. Mater.
2006, 134, 257.
60. Royer, B.; Cardoso, N. F.; Lima, E. C.; Vaghetti, J. C. P.; Simon, N. M.; Calvete, T.; Veses, R. C.; J. Hazard. Mater.2009, 164, 1213.
61. Foo, K. Y.; Hameed, B. H.; Chem. Eng. J. (Amsterdam, Neth.)
2010, 156, 2.
62. Ge, F.; Li, M.-M.; Ye, H.; Zhao, B.-X.; J. Hazard. Mater.2012,
211-212, 366.
63. Hao, Y. M.; Man, C.; Hu, Z. B.; J. Hazard. Mater.2010, 184, 392.
64. Emik, S.; React. Funct. Polym. 2014, 75, 63.
Submitted: January 18, 2016 Published online: April 8, 2016