GABRIEL BORGES MUNDIM
Genetic diversity, path analysis and association mapping for
nitrogen use efficiency in popcorn
Dissertação apresentada à Universidade Federal de Viçosa, como parte das exigências do Programa de Pós-Graduação em Genética e Melhoramento, para obtenção do título de Magister Scientiae.
VIÇOSA
Ficha catalográfica preparada pela Seção de Catalogação e Classificação da Biblioteca Central da UFV
T
Mundim, Gabriel Borges, 1987-
M965g Genetic diversity, path analysis and association mapping for 2013 nitrogen use efficiency in popcorn / Gabriel Borges Mundim.
– Viçosa, MG, 2013. vii, 38f. : il. ; 29cm.
Orientador: José Marcelo Soriano Viana
Dissertação (mestrado) - Universidade Federal de Viçosa. Referências bibliográficas: f. 18-25
1. Milho - Melhoramento genético. 2. Nitrogênio. 3. Milho - Seleção. 4. Genética quantitativa. I. Universidade Federal de Viçosa. Departamento de Fitotecnia. Programa de Pós- Graduação em Genética e Melhoramento. II. Título.
i
Aos meus pais, Edilson e Maria Perpétua,
À minha irmã Luísa e aos meus avós,
Ao meu avô TiFio (in memoriam),
À minha namorada Vanessa,
Aos meus demais familiares e amigos.
ii
AGRADECIMENTOS
Agradeço a Deus, pela sabedoria e por guiar os meus passos.
Aos meus pais, Edilson e Maria Perpétua, pelo amor, carinho, apoio e
confiança em mim depositados.
À minha irmã Luísa, pela amizade e pelo carinho.
Aos meus avós, Oldemar (TiFio) e Purcínia, Jovino e Felinda, pelo carinho e
atenção.
À minha namorada Vanessa, pelo amor, companheirismo, paciência e por me
apoiar em todos os momentos. Aos seus pais, José Francisco e Olga, pela amizade e
confiança.
Aos meus demais familiares, pelo apoio, incentivo e amizade.
À Universidade Federal de Viçosa (UFV) e ao Programa de Pós-Graduação em
Genética e Melhoramento, pela oportunidade.
Ao Conselho Nacional de Desenvolvimento Científico e Tecnológico (CNPq),
à Coordenação de Aperfeiçoamento de Pessoal de Nível Superior (CAPES) e à
Fundação de Amparo à Pesquisa do estado de Minas Gerais (FAPEMIG), pelo apoio
financeiro.
Ao meu orientador, professor José Marcelo Soriano Viana, por sua orientação
segura, amizade, incentivo, dedicação e pelos seus ensinamentos.
Ao professor Roberto Fritsche Neto e ao Dr. Rogério Faria Vieira, pela
disponibilidade de participação na banca e pelas valiosas contribuições.
Aos colegas do Programa Milho-Pipoca, Vinícius Faria, Rodrigo de Lima, Ciro
Maia, Geísa, Mágno, Vinícius Almeida, Yasmim e Manu, pelo trabalho em equipe e
pela colaboração no desenvolvimento deste trabalho.
Aos funcionários Leonardo, Márcio e Vicente, pela amizade e apoio na
condução dos experimentos.
A todos os meus amigos com os quais eu convivi desde a graduação, e a todos
os companheiros de república, pela amizade, confiança e apoio.
A todos que contribuíram para o desenvolvimento desse trabalho e para a
minha formação profissional.
iii
BIOGRAFIA
GABRIEL BORGES MUNDIM, filho de Edilson Borges da Silva e Maria
Perpétua Mundim Borges, nasceu em 15 de novembro de 1987, em Patos de Minas,
Minas Gerais.
Estudou na Escola Estadual "Coronel Cristiano", em Lagoa Formosa, Minas
Gerais e concluiu o Ensino Médio em 2005, no Colégio Marista de Patos de Minas,
Minas Gerais.
Em maio de 2006, ingressou no curso de Agronomia da Universidade Federal
de Viçosa, obtendo o título de Engenheiro Agrônomo em janeiro de 2011.
Em março de 2011, iniciou o curso de Mestrado em Genética e Melhoramento
pela Universidade Federal de Viçosa, submetendo-se à defesa da dissertação em
iv
SUMÁRIO
LIST OF MAIN ABBREVIATIONS AND SYMBOLS v
RESUMO vi
ABSTRACT vii
1. Introduction 1
2. Materials and methods 4
2.1. Plant materials 4
2.2. Experimental procedures 4
2.3. Trait measurements 6
2.4. DNA finger printing 7
2.5. Statistical analysis 7
3. Results and discussion 9
3.1. Inbred lines performance 9
3.2. Genetic diversity 12
3.3. Path analysis 14
3.4. Association mapping 16
4. Conclusions 17
5. Acknowledgments 17
v
LIST OF MAIN ABBREVIATIONS AND SYMBOLS
NUE Nitrogen use efficiency
NUpE Nitrogen uptake efficiency
NUtE Nitrogen utilization efficiency
SDW Shoot dry weight
RDW Root dry weight
TDW Total plant dry weight
RSR Root:shoot ratio
DG Daily growth
RAD Root average diameter
TRL Total root length
RSA Root surface area
RV Root volume
V6 Six fully expanded leaves
QTL Quantitative trait locus
AM Association mapping
SSR Simple sequence repeat
PCA Principal component analysis
df Degrees of freedom
IL Inbred line
CV (%) Coefficient of variation
vi
RESUMO
MUNDIM, Gabriel Borges, M. Sc., Universidade Federal de Viçosa, fevereiro de 2013. Diversidade genética, análise de trilha e mapeamento associativo para
eficiência no uso de nitrogênio em milho-pipoca. Orientador: José Marcelo
Soriano Viana. Coorientadores: Fabyano Fonseca e Silva e Glauco Vieira Miranda.
Os objetivos deste estudo foram (i) identificar linhagens de milho-pipoca eficientes
no uso de nitrogênio; (ii) avaliar a diversidade genética entre linhagens de
milho-pipoca em alto e baixo N; (iii) investigar os efeitos causais de vários caracteres sobre
a eficiência no uso de nitrogênio (NUE) e (iv) identificar marcadores SSR associados
com caracteres relacionados à NUE. Foram avaliadas 25 linhagens-elite de
milho-pipoca pertencentes às populações 'Viçosa' e 'Beija-Flor', em alto e baixo N. Foram
mensurados os seguintes caracteres: crescimento diário (DG, cm), massa de parte
aérea (SDW, mg), de raiz (RDW, mg), e da planta total seca (TDW, mg), razão parte
aérea:raiz seca (RSR), eficiência no uso (NUE, mg mg-¹), na absorção (NUpE, mg
mg-¹) e na utilização (NUtE, mg mg-¹) de nitrogênio, diâmetro médio (RAD, mm),
comprimento total (TRL, cm), área superficial (RSA, cm²) e volume (RV, cm³) de
raízes. Foram identificadas linhagens eficientes em cada nível de N. A avaliação da
diversidade genética pelo método de agrupamento UPGMA baseado no quadrado da
Distância Euclidiana Média resultou em quatro grupos de linhagens para cada nível
de N e a análise de componentes principais mostrou que as linhagens poderiam ser
agrupadas predominantemente pelos seus caracteres de parte aérea. A eficiência na
absorção de N (NUpE) foi a característica mais importante para a NUE em estádios
precoces de desenvolvimento da planta em ambos os níveis de N, por apresentar alta
correlação e alto efeito direto sobre a variável principal (NUE) na análise de trilha.
Em baixo N, a eficiência na utilização de N (NUtE) também apresentou alta
correlação e alto efeito direto sobre a variável NUE, mostrando ser uma característica
importante para esta condição nesses estádios. Contudo, a seleção direta ainda parece
ser o melhor método para aumentar a eficiência de seleção para NUE em estádios
precoces. Três marcadores SSR foram validados como associados com os caracteres
vii
ABSTRACT
MUNDIM, Gabriel Borges, M. Sc., Universidade Federal de Viçosa, February, 2013.
Genetic diversity, path analysis and association mapping for nitrogen use efficiency in popcorn. Adviser: José Marcelo Soriano Viana. Co-advisers: Fabyano
Fonseca e Silva and Glauco Vieira Miranda.
The objectives of this study were to (i) identify efficient inbred lines in nitrogen use;
(ii) assess the genetic diversity among popcorn inbred lines under high and low N;
(iii) investigate the causal effects of several traits in nitrogen use efficiency (NUE)
and (iv) identify SSR markers associated with the traits related to NUE. Twenty-five
elite popcorn inbred lines belonging to the 'Viçosa' and 'Beija-Flor' populations were
evaluated under high and low N. The following traits were assessed: daily growth
(DG, cm), shoot dry weight (SDW, mg), root dry weight (RDW, mg), total plant dry
weight (TDW, mg), root:shoot ratio (RSR), nitrogen use efficiency (NUE, mg mg-¹),
nitrogen uptake efficiency (NUpE, mg mg-¹), nitrogen utilization efficiency (NUtE,
mg mg-¹), root average diameter (RAD, mm), total root length (TRL, cm), root
surface area (RSA, cm²) and root volume (RV, cm³). Efficient inbred lines were
identified under each N level. The genetic diversity assessment using the UPGMA
method based on the squared Mean Euclidean distance grouped the inbred lines into
four clusters for each N level and the principal component analysis revealed that the
inbred lines could be categorized predominantly by their shoot traits. Nitrogen
uptake efficiency (NUpE) was the most important trait for NUE in the early stages of
plant development under both N levels, due its high correlation with and high direct
effect on NUE obtained in the path analysis. Under low N, nitrogen utilization
efficiency (NUtE) also showed high correlation with and direct effect on NUE,
demonstrating its importance in this N level in these early stages. Notwithstanding,
the direct selection still seems to be the best method to increase the selection
efficiency for NUE in these early stages. Furthermore, three SSR markers were
identified as true associations with the traits related to NUE, through the association
1
1. Introduction
Nitrogen use efficiency (NUE) can be defined as the ratio between grain yield
per unit of nitrogen applied to plants and is a function of nitrogen uptake efficiency
(NUpE) and nitrogen utilization efficiency (NUtE). Nitrogen uptake efficiency is
defined as the ratio between the quantities of nitrogen absorbed and applied, while
NUtE corresponds to the ability of a particular genotype to convert the absorbed
nitrogen into biomass or grain yield or the ratio between grain yield and nitrogen
absorbed (Moll et al. 1982). In studies conducted during the early stages of plant
development, NUE is usually estimated based on shoot dry weight (SDW) instead of
grain yield. According to Hirel et al. (2007), increased NUE can be obtained by
increasing any of its components. Increased NUpE can be achieved through
modifying root architecture and morphological traits (Garnett et al. 2009; Liu et al.
2009), while increased NUtE results from improving enzymatic and metabolic
processes (Hirel et al. 2001).
Recently, many studies aiming to identify markers related to NUE and nitrogen
stress tolerance have been performed in different species (Schnaithmann & Pillen
2013; Wei et al. 2012; Liu et al. 2008). The most important methods used for this
purpose are QTL analysis and, more recently, the association mapping (AM), which
is described by Liu et al. (2011) as a powerful approach for the dissection of the
genetic architecture of quantitative traits. Chen et al. (2011) reported that AM can be
useful for marker-assisted selection by enhancing previously known information
about quantitative trait loci (QTLs). To investigate responses to abiotic stress, Cai et
al. (2012a,b) evaluated a set of 218 maize recombinant inbred lines (RILs) under low
2
area, chlorophyll content, plant height, ear height and grain yield. They reported that
these QTLs identify chromosomal regions as targets for genetic improvement of low
nitrogen and low phosphorus tolerance and may be useful for improving lodging
resistance in intensive maize cropping systems with high fertilizer inputs. Given the
importance of the root system for nutrient uptake, some studies have also tried to
detect QTLs controlling root traits to understand the genetic basis of these traits and
their contribution to grain yield (Cai et al. 2012c; Ku et al. 2012).
Information about the genetic diversity of the germplasm available is essential
to maize breeders to develop better breeding strategies in any breeding program.
Makumbi et al. (2011) evaluated the combining ability, heterosis and genetic
diversity of 15 tropical maize inbred lines under drought stress, low N stress and
well-watered conditions, aiming to identify breeding strategies for stress and
non-stress environments. They assessed the genetic diversity using RFLP (Restriction
Fragment Length Polymorphism), AFLP (Amplified Fragment Length
Polymorphism) and Simple Sequence Repeat (SSR) markers and their results
revealed clustering of most lines in accordance with known pedigree and origin,
which is consistent with other studies in tropical maize (Betrán et al. 2003;
Warburton et al. 2002). In the study of Kumar et al. (2012), the clustering of lines
based on root morphology was not consistent with the genetic background and origin
of maize lines. Studies of genetic diversity with popcorn germplasm have also been
performed. Franzoni et al. (2012) evaluated changes in genetic variability and genetic
structure during eight cycles of recurrent selection in the population CMS-43 using
SSR markers and concluded that there was no tendency in changes in the allele
frequencies, probably, because of the major proportion of the variation in the SSR
3
Comparisons among maize genotypes under normal and stressed nitrogen
conditions allow breeders to develop breeding strategies for each specific condition.
Studies try to evaluate the genetic effects involved in NUE, the selection efficiency
in each condition and the relationship among traits associated with NUE. DoVale et
al. (2012) detected high magnitude correlations between NUpE and NUE and
between these efficiencies and shoot dry weight (SDW) under high and low N
conditions and identified the additive genetic effects as the most important for the
traits associated with NUE. However, these high correlation values indicate no
perfect cause and effect relationship among the traits. Badu-Apraku et al. (2012)
evaluated ninety extra early maize inbred lines under low N to confirm the reliability
of ears per plant and anthesis-silking interval (ASI) for selecting for low N tolerance.
Aiming to partition the correlations among several traits into causal and residual
effects, Wu et al. (2011) evaluated maize inbred lines under normal and low N
conditions and performed the path analysis to investigate the direct and indirect
effects of each trait on low-N agronomic efficiency (LNAE).
Considering the foregoing, the objectives of this study were to (i) identify
efficient inbred lines in nitrogen use; (ii) assess the genetic diversity among popcorn
inbred lines under high and low N; (iii) investigate the causal effects of several traits
4
2. Materials and methods
2.1. Plant materials
A total of 25 popcorn inbred lines (S6) belonging to the popcorn breeding
program of the Federal University of Viçosa (UFV), Minas Gerais, Brazil, were used
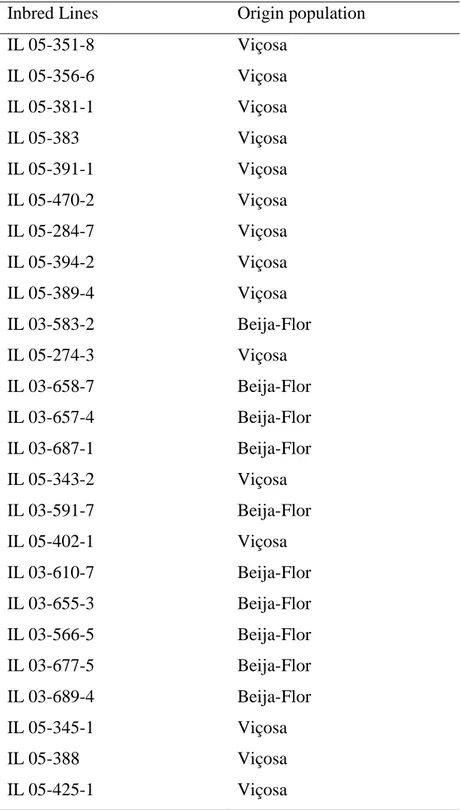
in this study (Table 1). The inbred lines were chosen among the elite inbred lines of
the program, which were selected for improving the popping volume, one of the most
important traits for popcorn quality. The 25 inbred lines represent a sample of the
two populations used as germplasm in the program; with 15 belonging to the 'Viçosa'
population and 10 to the 'Beija-Flor' population, which are the base populations of
the program. As there is not a definition of heterotic groups of popcorn, the
populations cannot be stated as representatives of different heterotic groups. Both
populations have similar cycle, vegetative development, shape of grain (pearl),
quality and grain yield (Viana et al. 2011).
2.2. Experimental procedures
The contrasting N levels were defined in a preliminary experiment, where two
popcorn inbred lines were evaluated under eight N levels (196, 224, 252 and 280 mg
L-1 - equivalent to the high N levels; and 19.6, 22.4, 25.2 and 28.0 mg L-1 -
equivalent to the low N levels) with two replications. The results indicated that the
contrasting N levels should be 224 and 22.4 mg L-1, for high and low N conditions,
respectively, due to a 49% of reduction on SDW of the inbred lines grown under low
5
The experiment was conducted in March 2012 at a greenhouse in the UFV (20º
50' S, 42° 48' W). The seeds were pre-germinated in trays with separate germination
cells containing a sand-vermiculite mixture. After emergence, the seedlings were
transplanted to 9 dm³ cylindrical plastic pots (diameter 150 mm and height 50 cm)
containing a mixture of 50% sand (0.25-0.5 mm diameter) washed with deionized
water for five consecutive days and 50% fine vermiculite (minimum capacity to
retain water (m/m) = 60%; cationic exchange capacity = 200 cmolc/dm³; maximum
humidity (m/m) = 25%), as recommended by Walk et al. (2006). Each plot had a
single plant in a pot. Plants were harvested in the vegetative stage V6 (six fully
expanded leaves), approximately 30 days after sowing. The plants were cut off at the
soil surface and the roots were separated from the sand-vermiculite mixture gently
after soaking them in water. The remaining mixture adhering to the roots was then
washed away. Then, the shoot was dried in a forced-air oven at 60°C for 72h and the
root system was placed in a solution of 70% alcohol for posterior image analysis.
The experiment was conducted in a factorial arrangement (25 inbred lines x 2 N
levels) in the randomized block design with four replications, resulting in 200 pots.
The nutrient solutions were supplied every two days from the seventh day after
transplantation. The solutions contained (in mmol L-1): 2.0 Ca(NO3)2, 0.75 K2SO4,
0.65 MgSO4, 0.1 KCl, 0.25 KH2PO4, 1 x 10⁻³ H3BO3, 1 x 10⁻³ MnSO4, 1 x 10⁻⁴
CuSO4, 1 x 10⁻³ ZnSO4, 5 x 10⁻⁶ (NH4)6Mo7O24, and 0.1 Fe-EDTA, at two nitrogen
levels (low N - LN; and high N - HN). The LN solution contained 10 times less N
(0.2 mmol L-1 Ca(NO3)2) than the HN solution. The low Ca concentration was
compensated by the addition of CaCl2 in the LN solution, as described by Chun et al.
6
2.3. Trait measurements
The root system was divided into primary, seminal and crown roots, according
to Hochholdinger & Tuberosa (2009). Samples of the seminal and crown roots were
obtained from each plot. Then, the root samples were floated in a transparent plastic
tray (15 x 20 cm) and scanned using the WinRHIZO Pro 2009 software (Regent
Instruments, Quebec, Canada) coupled to an EPSON Perfection V700/V750 scanner
equipped with additional light (transparency unit) at a resolution of 400 dpi. The
following traits were assessed: root average diameter (RAD, mm), total root length
(TRL, cm), root surface area (RSA, cm²) and root volume (RV, cm³). Then, the total
root system was dried in a forced-air oven at 60°C for 72h to obtain the root dry
weight (RDW, mg).
At harvest time, the plant height was measured until the insertion node of the
last fully expanded leaf. To calculate the daily growth (DG, cm), the plant height was
divided by the number of days that each inbred line took to reach the V6 stage. After
drying the shoot and the root system, the shoot dry weight (SDW, mg), the total plant
dry weight (TDW, mg) and root:shoot ratio (RSR) were calculated. Furthermore, the
genotypes were evaluated for nitrogen use efficiency (NUE = shoot dry weight/N
applied, mg mg-1) and its two components using the following concepts (Hirel et al.
2007): nitrogen uptake efficiency (NUpE) = N in plant/N applied (mg mg-1) and
nitrogen utilization efficiency (NUtE) = shoot dry weight/N in plant (mg mg-1). The
content of N in plant was obtained through samples of 0.2 g from SDW for each plot,
7
2.4. DNA finger printing
The inbred lines were genotyped for 90 SSR loci chosen from the MaizeGDB
database. These markers are related to QTLs for traits associated with abiotic stress
(Chen et al. 2009; Chen et al. 2008), popping ability (Babu et al. 2006) and grain
yield components (Messmer et al. 2009). Genomic DNA was extracted from young
leaf tissue using hexadecyltrimethylammonium bromide (CTAB) following a
modified protocol described by Doyle & Doyle (1990). Polymerase chain reactions
(PCRs) were performed in a thermal cycler PTC-200 (MJ Research, Watertown,
MA) using a touchdown profile and the products were analyzed by gel
electrophoresis in 0.8% (w/v) agarose gels. Each PCR mixture contained 1x buffer, 1
mM MgCl2, 0.5 U Taq polymerase, 0.1 µM of each primer, 0.1 µM of each
deoxynucleotide (dATP, dTTP, dGTP, and dCTP) and 30 ng of template DNA
diluted with water to a total reaction volume of 20 μl. Electrophoresis was conducted
in 1x TBE buffer (pH 8.0) at 50 W for 2-3 h in a Sequi-Gen GT (Bio-Rad) apparatus.
Bands were visualized using silver nitrate staining.
2.5. Statistical analysis
The analysis of variance under each N level, the joint analysis and the
estimation of genetic parameters for all the traits were performed using the restricted
maximum likelihood/best linear unbiased prediction (REML/BLUP) method
(Patterson & Thompson 1971; Henderson 1974). In matrix terms, assuming the
inbred lines as a random factor, and blocks and N levels as fixed effects, the models
8
X Z1u1
y , for the individual analysis and
X Z1u1 Z2u2
y , for the joint analysis
where y is the vector of phenotypic values; X is the incidence matrix of the fixed
effects; is the vector of fixed effects; Z1 and Z2 are the incidence matrices of the
random effects; u1 is the vector of genotypic values of the inbred lines, where
) G , 0 ( N ~
u1 1 , being G1 A2g; u2 is the vector of genotype x N levels interaction,
where u2 ~N(0,G2), being G2 I2ge and is the residuals vector, where
) R , 0 ( N ~
, being 2
e I R .
In this study, the coefficient of coancestry (A) was not considered and,
consequently, the matrix G1 was assumed as an identity matrix. Thus, g2
corresponds to the genetic variance among the inbred lines and the vector u~ 1
corresponds to the predictions of the genotypic values of the inbred lines. Based on
the predicted genotypic values, the genotypic correlation matrix among the traits
studied was estimated using the Pearson's coefficient. The probability values of the
significance tests were obtained from the standardized normal distribution (Littell et
al. 2006). The analyses were performed using the MIXED procedure of the SAS
System v.9.2 (SAS Institute 2007). All other analyses were performed for each N
level.
The phenotypic dataset was analyzed using the NTSYSpc v.2.2 software
(Rohlf 2009) to assess the genetic diversity among the inbred lines. The data were
standardized to minimize problems relative to units of each measure. Then, the
squared Mean Euclidean distance was calculated. The distance matrix was used to
9
for most of the variation among the studied inbred lines. The inbred lines were also
grouped using the Unweighted Pair-Group Method using Arithmetic Averages
(UPGMA). Furthermore, the genotypic correlation matrix was used to perform a path
analysis in order to partition the genotypic correlations into causal and residual
effects, and the causal effects into direct and indirect effects. This analysis was
performed using the procedures CORR and IML of the SAS System v.9.2 (SAS
Institute 2007).
The association mapping (AM) analysis was performed using the single-locus
F-test procedure in the PowerMarker software (Liu & Muse 2005). In this test, each
marker is regarded as a factor in a one-way ANOVA layout, as each genotype stands
for a different level, and an F-test is then performed for each marker. The set of
inbred lines was subdivided into two subsets, each one belonging to its origin
population. Ten markers described in chromosome 5 and close to the gene "nnr2 -
nitrate reductase2" (Long et al. 1992) were considered. The analysis was performed
for the following traits: SDW, RDW, NUpE, NUtE, NUE and TRL. A p-value < 0.05
was considered to identify the markers associated with each trait.
3. Results and discussion
3.1. Inbred lines performance
At harvest time of the experiment, the plants grown under high N were better
nourished than the plants grown under low N. These latter presented the lower leaves
10
embryonic primary root; from one to four seminal roots depending on the genotype;
the first postembryonic crown roots and lateral roots.
The genotypes presented differential behavior for most traits under the two
contrasting N levels, which can be evidenced by the significant effect of the G x N
interaction (Table 2). These results demonstrate the differential expression of genes
under each N level and the need for evaluation under each environment separately.
For the traits DG, NUpE and RAD, the selection could be realized in any N level or
when considering the means of the inbred lines across the two N levels, as evidenced
by the absence of significance for the G x N interaction (Table 2). Rare studies
(Gardner et al. 1990; DoVale et al. 2012) concluded that there was no G x N
interaction. Clearly, these results depend on the set of genotypes studied and it is
mainly evidenced when hybrids are evaluated.
Another way to show G x N interaction is to consider the correlation between
the two N levels
rgHN,LN
. These correlations also allow us to infer about the natureof the G x N interaction. The correlation among the inbred lines under high and low
N levels ranged from 0.04 to 0.97 and indicates the simple G x N interaction for most
traits, except for NUtE (Table 2). Bertin & Gallais (2000) and Presterl et al. (2003)
found an average correlation coefficient of 0.75. According to Robertson (1959), the
simple G x N interaction is provided only by the differences in variability among
genotypes in the two environments and it is not a problem for the selection of the
superior genotypes.
Regardless of the N level, the analyses showed significant genetic variability
among the inbred lines for most traits (Tables 3 and 4), except for RAD under low N
(Table 4) and for NUtE under high N (Table 3). These results demonstrate the
11
nitrogen use. Many studies have shown a genetic variability for NUE or at least one
of its two components under a given level of N (DoVale et al. 2012; Presterl et al.
2002; Worku et al. 2007; Bertin & Gallais 2000). Regarding the NUtE, the genetic
variability among the inbred lines under high N may have been suppressed over time
due to the advance of selfing generations and selection of superior inbred lines was
always conducted under optimal conditions of N supply. Moreover, the NUtE tends
to be less pronounced in the early stages of plant development (Caixeta 2012).
The coefficients of variation (CVs) ranged from 9.3 to 36.0% under high N
(Table 3) and from 10.9 to 43.0% under low N (Table 4). The CVs were high for
several traits; however, they are in the range observed in other studies of abiotic
stresses (DoVale et al. 2012; Maia et al. 2011; Souza et al. 2008) and indicate
satisfactory experimental precision and high reliability of the results, since the CVs
need to be classified according to each trait evaluated (Fritsche-Neto et al. 2012).
Regarding the broad-sense heritabilities, the estimates ranged from 0.25 to 0.83
under high N (Table 3) and from 0.22 to 0.79 under low N (Table 4). The estimates
of heritability were generally lower under low N and in accordance with other studies
(Abdel-Ghani et al. 2013; Wu et al. 2011). According to Coque & Gallais (2006), the
genetic variability and the heritabilities are reduced under conditions of low N due to
an increase in environmental error and because the genotypes tend to present a
similar performance, which hampers the selection.
The SDW of the plants grown under low N (Table 4) decreased 14.6%
compared with the plants grown under high N (Table 3). The RDW remained almost
constant across the two N levels (Tables 3 and 4), while the TRL of the plants grown
under low N (Table 4) increased 15.5% compared with the TRL of the plants grown
12
root growth under N deficiency, as reported by other authors (Liu et al. 2008; Chun
et al. 2005).
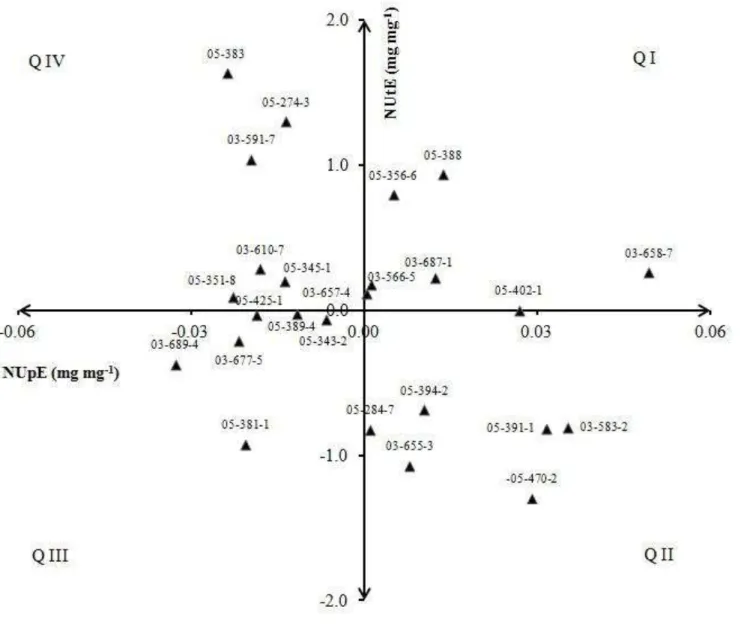
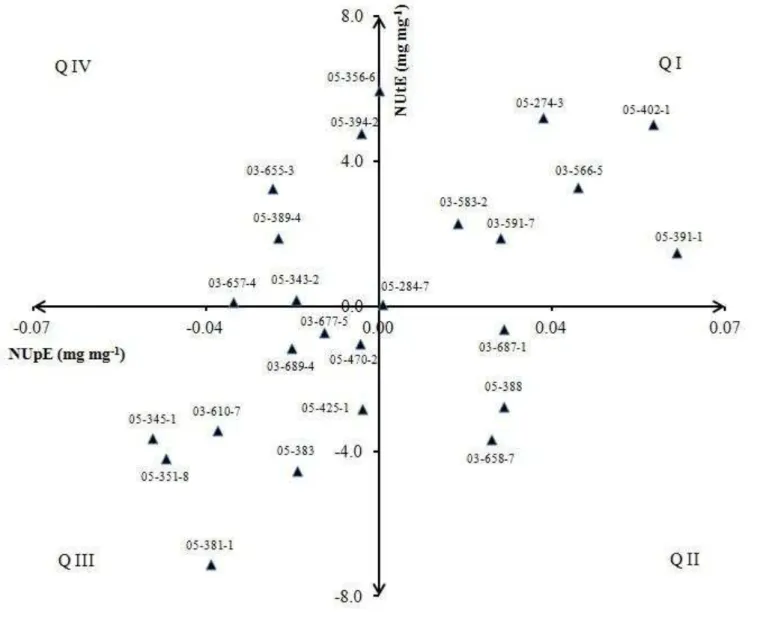
To achieve gains in NUE, breeders should select those genotypes that are more
efficient in terms of nitrogen uptake and utilization (Hirel et al. 2001). The predicted
genotypic values of the inbred lines for NUpE and NUtE under high and low N are
shown in the Figures 1 and 2, respectively. Through this representation, it is possible
to identify the desired genotypes regarding the two components of nitrogen use
efficiency. Some inbred lines had predicted genotypic values very contrasting
according to the N level, such as the IL 05-383, IL 05-391-1 and 03-583-2, as well as
shown in the evaluation of maize inbred lines under contrasting N and P levels
performed by DoVale et al. (2013). Under high N, the inbred line 03-658-7 was the
most efficient in nitrogen use due to its highest genotypic value for NUpE (Figure 1).
Under low N, the IL 05-402-1 was the most efficient due to its high genotypic values
for NUpE and NUtE (Figure 2). This inbred line also had the second highest
genotypic value for NUpE under high N, revealing its genetic potential for NUE
under the two N levels.
3.2. Genetic diversity
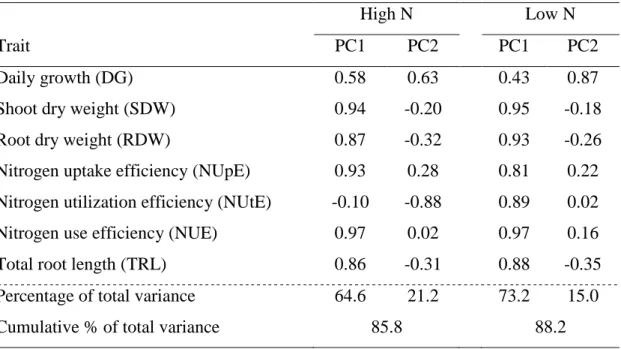
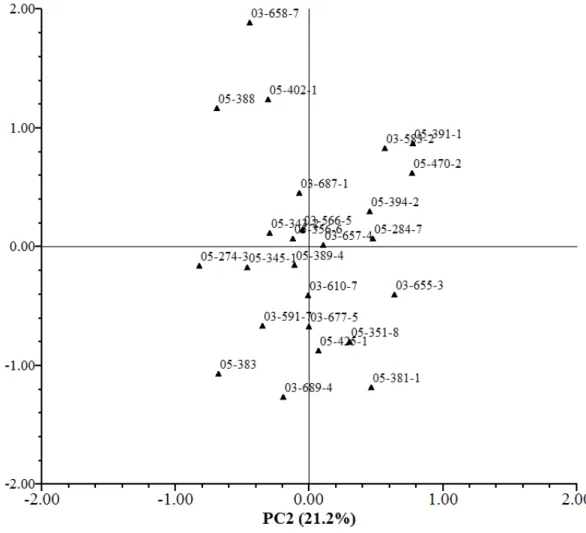
The results obtained with the principal component analysis (PCA) are shown in
Table 5. The scores of the inbred lines under high (Figure 3) and low N (Figure 4)
were plotted in a plane defined by the two principal components. Under high N, the
first two principal components explained about 85.8% of the total variation among
the inbred lines (Table 5). The relative magnitude of eigenvectors for the first
13
through the correlation coefficients higher than 0.90 among these traits and the first
component (Table 5). From the second principal component, which contributed with
21.2% of the total variation, the most predominant trait was DG. Under low N, the
first component explained 73.2% of the total variation with contributions from NUE,
SDW and RDW. Once again, DG was the highest contributor for the second
component, which explained 15.0% of the total variation. The popcorn inbred lines
could be categorized predominantly by their shoot traits, such as NUE and SDW
under the two N levels. Only one trait of the root system had significant contribution
for the PCA. The RDW was responsible for a small portion of the total phenotypic
variation under low N.
Before assessing the genetic diversity among the inbred lines, an analysis to
compute the relative contribution of each trait to the diversity was performed using a
procedure based on canonical variables. According to this evaluation, the TDW and
RSA traits were eliminated, as they were considered to be less variant among
genotypes and therefore redundant. Then, the squared Mean Euclidean distance
matrix was computed based on the 10 remaining traits to perform the UPGMA
cluster analysis. For each N level, a dendrogram was created (Figures 5 and 6), in
which the presence of four clusters of inbred lines can be noticed. Just as in the
principal component analysis, the efficient inbred lines were grouped closely, as
were the inefficient lines. Sharma et al. (2010) also found four major clusters through
phenotypic and molecular characterization of a set of 48 selected maize landrace
accessions. The majority of the populations from the same geographical origin were
grouped together, due its similarity for the nine morphoagronomic traits evaluated.
On the other hand, the maize inbred lines used in the study of Kumar et al. (2012) did
14
level of variability for root architecture traits is still present among and within the
different genetic backgrounds.
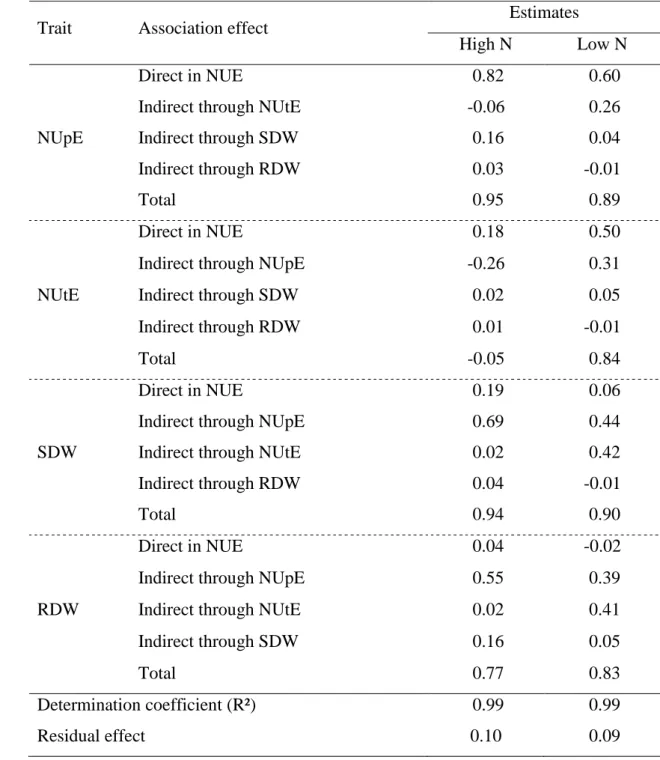
3.3. Path analysis
The path analysis involved the effects of NUpE, NUtE, SDW and RDW on
NUE (Table 6) under each one of the two N levels. These traits are the main
explanatory variables of NUE, regardless of the N level, which can be confirmed by
comparing the determination coefficients of the diagrams (R² = 0.99, for both N
levels) with the residual effects (0.10 and 0.09), which represents the effect of the
other variables not included in the diagrams. The shoot and root dry weight had high
correlations with NUE under both N levels, ranging from 0.77 to 0.94 (Table 6).
Similar results were found in the study of DoVale et al. (2012), where the
correlations between SDW and the root traits with NUE ranged from 0.83 to 1.00.
These results are in accordance with those obtained by Pereira (2011), which
identified the SDW as the essential trait for early and indirect selection of maize
genotypes with high NUE. However, it is possible that there is no clear evidence of
cause and effect relationship between SDW and RDW with NUE, due its low direct
effects, which ranged from -0.02 to 0.19 (Table 6). Thus, only these two traits may
not be adequate to perform indirect selection of superior inbred lines for NUE.
The highest contributions of the shoot and root dry weight for NUE happened
by the indirect effects through NUpE under both N levels (from 0.39 to 0.69). These
results suggest that NUpE has to be considered in the selection for NUE, regardless
of the N level. Moreover, NUpE had the highest correlations (0.95 and 0.89) and
15
uptake more nutrients than using them in the early stages of development, as well as
maize plants. Thus, the NUpE becomes the most important trait for NUE in these
early stages of development. However, in the course of plant development, the NUtE
component has its importance increased in detriment of the NUpE (Caixeta 2012).
DoVale et al. (2012) also demonstrated that the genetic differences for NUE in the
early stages of plant development were due to NUpE, regardless of the N level. The
NUtE also had a high correlation with and a direct effect on NUE (0.84 and 0.50,
respectively) under low N (Table 6). Gallais & Hirel (2004) reported that the genetic
variability for NUE occurs due to differences in NUpE at high N and is a function of
NUtE under low N, as well as described by Gallais & Coque (2005). From the
physiological point of view, it is interesting to note that the nitrogen utilization is less
pronounced under high N than under low N level. As the nitrogen from soil is not
limiting under high N, it can be absorbed at any time and in greater quantities. Then,
the need for remobilization of the nitrogen absorbed is less pronounced. In contrast,
as the nitrogen availability is limiting under low N, the processes of uptake and
utilization have to be complementary.
The use of physiological traits to help in the selection will be efficient only if
the traits used for indirect selection have the following qualities: high heritability,
greater than the primary trait (NUE); high genetic correlation with the primary trait
(NUE); easy to measure on a great number of genotypes; measurable in young stage
and highly correlated with grain yield in the end of plant development (Gallais
1983). The only trait that presented all these qualities was the SDW. However, the
direct effects of SDW on NUE were reduced in the two N levels (Table 6). Thereby,
16
direct selection in each specific condition of N availability still seems to be the best
method to increase the selection efficiency for NUE.
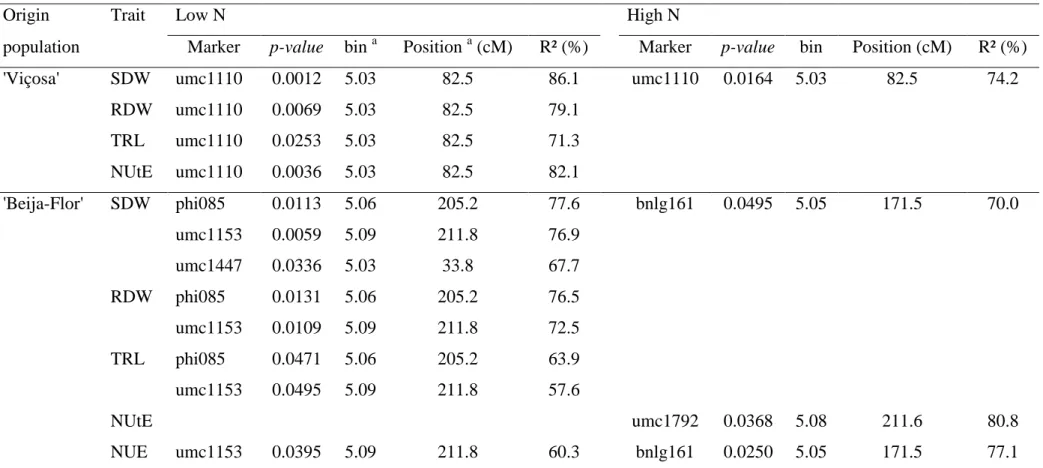
3.4. Association mapping
Considering the subset of inbred lines belonging to the 'Viçosa' population,
only one marker (umc1110, bin 5.03) was identified as associated with SDW under
high N and with SDW, RDW, TRL and NUtE under low N (Table 7). When
considering the inbred lines belonging to the 'Beija-Flor' population, three different
markers (phi085, umc1153 and umc1447) were identified as associated with SDW,
RDW, TRL and NUE under low N and two markers (bnlg161 and umc1792) were
identified as associated with SDW, NUtE and NUE under high N. Among these
markers associated with these traits related to NUE, the loci phi085, umc1792 and
umc1153 can be considered as true associations with the gene "nnr2 - nitrate
reductase2" (bin 5.07, 211.2 cM), responsible for the regulation of maize root nitrate
reductase mRNA levels, as described by Long et al. (1992). The reason why only
these associations were validated is that these markers are located very close to the
gene, with a correspondent distance less than 6.0 cM (Table 7). These markers
explained from 57.6 to 80.8% of the total variation in the traits associated with NUE
in the early stages of plant development when considered the inbred lines belonging
to the 'Beija-Flor' population (Table 7).
Under normal field conditions, nitrate (NO3-) is the most common form of
nitrogen available to plants. Nitrate taken up by the plant may be reduced in the
roots, stored in the vacuoles or transferred to the shoots before being processed. The
17
reductase (Forde 2000; Forde & Clarkson 1999; Miller & Smith 1996). Therefore,
the detection of markers very close to the gene "nnr2 - nitrate reductase2" (Long et
al. 1992) can help maize and popcorn breeders in the identification of superior
genotypes in nitrogen use through marker-assisted selection.
4. Conclusions
Twenty-five popcorn inbred lines were evaluated under high and low N.
Efficient inbred lines in nitrogen use were identified under each N level. The genetic
diversity assessment grouped the inbred lines into four clusters for each N level and
the principal component analysis revealed that the inbred lines could be categorized
predominantly by their shoot traits. Nitrogen uptake efficiency (NUpE) was the most
important trait for nitrogen use efficiency (NUE) in the early stages of plant
development under both N levels. Notwithstanding, the direct selection still seems to
be the best method to increase the selection efficiency for NUE in these early stages.
Furthermore, three SSR markers were identified as true associations with the traits
related to NUE.
5. Acknowledgements
We thank the Foundation for Research Support of Minas Gerais State (Fapemig), the
Brazilian Federal Agency for Support and Evaluation of Graduate Education (Capes)
and the National Council for Scientific and Technological Development (CNPq) for
18
6. References
Abdel-Ghani AH, Kumar B, Reyes-Matamoros J, Gonzalez-Portilla PJ, Jansen C,
San Martin JP, Lee M, Lübberstedt T (2012) Genotypic variation and
relationships between seedling and adult plant traits in maize (Zea mays L.)
inbred lines grown under contrasting nitrogen levels. Euphytica (Online first)
doi: 10.1007/s10681-012-0759-0
Babu R, Nair SK, Kumar A, Rao HS, Verma P, Gahalain A, Singh IS, Gupta HS
(2006) Mapping QTLs for popping ability in a popcorn x flint corn cross.
Theoretical and Applied Genetics 112:1392-1399 doi:
10.1007/s00122-006-0242-1
Badu-Apraku B, Akinwale RO, Franco J, Oyekunle M (2012) Assessment of
reliability of secondary traits in selecting for improved grain yield in drought
and low-nitrogen environments. Crop Science 52:2050-2062 doi:
10.2135/cropsci2011.12.0629
Bertin P, Gallais A (2000) Physiological and genetic basis of nitrogen use efficiency
in maize. I. Agrophysiological results. Maydica 45:53-66
Betrán FJ, Beck D, Bänziger M, Edmeades GO (2003) Genetic analysis of inbred
and hybrid yield under stress and nonstress environments in tropical maize. Crop
Science 43:807-817
Bremner JM, Mulvaney CS (1982) Nitrogen total. In: Page AL, Miller RH, Keeney
DR (Eds.). Methods of soil analysis. Madison: Soil Science Society of America,
1982, p. 595-624
Cai H, Chu Q, Yuan L, Liu J, Chen X, Chen F, Mi G, Zhang F (2012a) Identification
19
mays) under low nitrogen and low phosphorus supply. Molecular Breeding
30:251-266 doi: 10.1007/s11032-011-9615-5
Cai H, Chu Q, Gu R, Yuan L, Liu J, Zhang X, Chen F, Mi G, Zhang F (2012b)
Identification of QTLs for plant height, ear height and grain yield in maize (Zea
mays L.) in response to nitrogen and phosphorus supply. Plant Breeding
131:502-510 doi: 10.1111/j.1439-0523.2012.01963.x
Cai H, Chen F, Mi G, Zhang F, Maurer HP, Liu W, Reif JC, Yuan L (2012c)
Mapping QTLs for root system architecture of maize (Zea mays L.) in the field
at different developmental stages. Theoretical and Applied Genetics
125:1313-1324 doi: 10.1007/s00122-012-1915-6
Caixeta DS (2012) Seleção precoce e indireta para eficiência no uso de nitrogênio em
milho. 68 pp. Dissertação (Mestrado) - Universidade Federal de Viçosa, Viçosa,
MG.
Chen J, Xu L, Cai Y (2008) QTL mapping of phosphorus efficiency and relative
biologic characteristics in maize (Zea mays L.) at two sites. Plant Soil
313:251-266 doi: 10.1007/s11104-008-9698-x
Chen J, Xu L, Cai Y, Xu J (2009) Identification of QTLs for phosphorus utilization
efficiency in maize (Zea mays L.) across P levels. Euphytica 167:245-252 doi:
10.1007/s10681-009-9883-x
Chen J, Hu L, Zhu L, Guo J, Zhao Y, Huang Y (2011) Diversity, structure, and
marker-trait association analysis of the maize recombinant inbred line
population. Agricultural Sciences in China 10:975-986 doi:
20
Chun L, Mi GH, Li JS, Chen FJ, Zhang FS (2005) Genetic analysis of maize root
characteristics in response to low nitrogen stress. Plant Soil 276:369-382 doi:
10.1007/s11104-005-5876-2
Coque M, Gallais A (2006) Genomic regions involved in response to grain yield
selection at high and low nitrogen fertilization in maize. Theoretical and Applied
Genetics 112:1205-1220 doi: 10.1007/s00122-006-0222-5
DoVale JC, Fritsche-Neto R, Bermudez F, Miranda GV (2012) Efeitos gênicos de
caracteres associados à eficiência no uso de nitrogênio em milho. Pesquisa
Agropecuária Brasileira 47:385-392
DoVale JC, Maia C, Fritsche-Neto R, Miranda GV, Cavatte PC (2013) Genetic
responses of traits relationship to components of nitrogen and phosphorus use
efficiency in maize. Acta Scientiarum. Agronomy 35:31-38 doi:
10.4025/actasciagron.v35i1.15237
Doyle JJT, Doyle JL (1990) Isolation of plant DNA from fresh tissue. Focus
12:13-15
Forde BG (2000) Nitrate transporters in plants: structure, function and regulation.
Biochimica et Biophysica Acta 1465:219:235
Forde BG, Clarkson DT (1999) Nitrate and ammonium nutrition of plants:
physiological and molecular perspectives. Advances in Botanical Research
30:1-90
Franzoni J, Scapim CA, Beviláqua MRR, Machado MFPSM, Pacheco CAP,
Mangolin CA (2012) Application of microsatellite markers to evaluate the
heterozygosity from the popcorn composite CMS-43 (Zea mays L.) during eight
cycles of selection. Plant Breeding 131:479-485 doi:
21
Fritsche-Neto R, Vieira RA, Scapim CA, Miranda GV, Rezende LM (2012)
Updating the ranking of the coefficients of variation from maize experiments.
Acta Scientiarum. Agronomy 34:99-101 doi: 10.4025/actasciagron.v34i1.13115
Gallais A (1983) Use of indirect selection in plant breeding. pp. 45-60. In: Lange W,
Zeven AC, Hogenboom NG (Eds.), Efficiency in Plant Breeding: Proc. 10th
Eucarpia Congress, Wageningen.
Gallais A, Coque M (2005) Genetic variation and selection for nitrogen use
efficiency in maize: A synthesis. Maydica 50:531-547
Gallais A, Hirel B (2004) An approach to the genetics of nitrogen use efficiency in
maize. Journal of Experimental Botany 55: 295-306 doi: 10.1093/jxb/erh006
Gardner CAC, Bax PL, Bailey DJ, Cavlieri AJ, Clausen CR, Luce GA, Meece JM,
Murphy PA, Piper TE, Segebart RL, Smith OS, Tiffany CW, Trimble MW,
Wilson BN (1990) Response of corn hybrids to nitrogen fertilizer. Journal of
Production Agriculture 3:39-43
Henderson CR (1974) General flexibility of linear model techniques for sire
evaluation. Journal of Dairy Science 57:963-972
Hirel B, Gallais A, Bertin P, Quilléré I, Bourdoncle W, Attagnant C, Dellay C, Gouy
A, Cadiou S, Retailliau C, Falque M (2001) Towards a better understanding of
the genetic and physiological basis for nitrogen use efficiency in maize. Plant
Physiology 125:1258-1270
Hirel B, Le Gouis J, Ney B, Gallais A (2007) The challenge of improving nitrogen
use efficiency in crop plants: towards a more central role for genetic variability
and quantitative genetics within integrated approaches. Journal of Experimental
22
Hochholdinger F, Tuberosa R (2009) Genetic and genomic dissection of maize root
development and architecture. Current Opinion in Plant Biology 12:172-177 doi:
10.1016/j.pbi.2008.12.002
Ku LX, Sun ZH, Wang CL, Zhang J, Zhao RF, Liu HY, Tai GQ, Chen YH (2012)
QTL mapping and epistasis analysis of brace root traits in maize. Molecular
Breeding 30:697-708 doi: 10.1007/s11032-011-9655-x
Kumar B, Abdel-Ghani AH, Reyes-Matamoros J, Hochholdinger F, Lübberstedt T
(2012) Genotypic variation for root architecture traits in seedlings of maize (Zea
mays L.) inbred lines. Plant Breeding 131:465-478 doi:
10.1111/j.1439-0523.2012.01980.x
Littell RC, Milliken GA, Stroup WW, Wolfinger RD, Schabenberger O (2006) SAS
for mixed models. 2nd ed. SAS Institute, Cary, NC.
Liu K, Muse SV (2005) PowerMarker: Integrated analysis environment for genetic
marker data. Bioinformatics 21:2128-2129
Liu J, Li J, Chen F, Zhang F, Ren T, Zhuang Z, Mi G (2008) Mapping QTLs for root
traits under different nitrate levels at the seedling stage in maize (Zea mays L.).
Plant Soil 305:253-265 doi: 10.1007/s11104-008-9562-z
Liu J, Chen F, Olokhnuud C, Glass ADM, Tong Y, Zhang F, Mi G (2009) Root size
and nitrogen-uptake activity in two maize (Zea mays) inbred lines differing in
nitrogen-use efficiency. Journal of Plant Nutrition and Soil Science 172:230-236
doi: 10.1002/jpln.200800028
Liu W, Gowda M, Steinhoff J, Maurer HP, Würschum T, Longin CFH, Cossic F,
Reif JC (2011) Association mapping in an elite maize breeding population.
23
Long DM, Oaks A, Rothstein SJ (1992) Regulation of maize root nitrate reductase
mRNA levels. Physiologia Plantarum 85:561-566 doi:
10.1111/j.1399-3054.1992.tb04755.x
Maia C, DoVale JC, Fritsche-Neto R, Cavatte PC, Miranda GV (2011) The
difference between breeding for nutrient use efficiency and for nutrient stress
tolerance. Crop Breeding and Applied Biotechnology 11:270-275
Makumbi D, Betrán FJ, Bänzinger M, Ribaut JM (2011) Combining ability, heterosis
and genetic diversity in tropical maize (Zea mays L.) under stress and non-stress
conditions. Euphytica 180:143-162 doi: 10.1007/s10681-010-0334-5
Messmer R, Fracheboud Y, Bänziger M, Vargas M, Stamp P, Ribaut JM (2009)
Drought stress and tropical maize: QTL-by-environment interactions and
stability of QTLs across environments for yield components and secondary
traits. Theoretical and Applied Genetics 119:913-930 doi:
10.1007/s00122-009-1099-x
Miller AJ, Smith SJ (1996) Nitrate transport and compartmentation in cereal root
cells. Journal of Experimental Botany 47:843-854
Moll RH, Kamprath EJ, Jackson WA (1982) Analysis and interpretation of factors
which contribute to efficiency of nitrogen utilization. Agronomy Journal
74:562-564
Patterson HD, Thompson R (1971) Recovery of inter-block information when block
sizes are unequal. Biometrika 58:545-554
Pereira FB (2011) Relação entre caracteres determinantes da eficiência no uso de
nitrogênio e fósforo em milho. 33pp. Dissertação (Mestrado) - Universidade
24
Presterl T, Groh S, Landbeck M, Seitz G, Schmidt W, Geiger HH (2002) Nitrogen
uptake and utilization efficiency of European maize hybrids developed under
conditions of low and high nitrogen input. Plant Breeding 121:480-486
Presterl T, Seitz G, Landbeck M, Thiemt EM, Schmidt W, Geiger HH (2003)
Improving nitrogen use efficiency in European maize: estimation of quantitative
genetic parameters. Crop Science 43:1259-1265
Robertson A (1959) Experimental design on the measurement of heritabilities and
genetic correlations. Biometrical Genetics. Pergamon Press, 186pp, New York.
Rohlf FJ (2009) NTSYSpc: Numerical Taxonomy and Multivariate Analysis System.
Exeter Software, New York.
SAS Institute (2007) The SAS system for Windows, version 9.2. SAS Institute Inc.,
Cary.
Schnaithmann F, Pillen K (2013) Detection of exotic QTLs controlling nitrogen
stress tolerance among wild barley introgression lines. Euphytica (Online first)
doi: 10.1007/s10681-012-0711-3
Sharma L, Prasanna BM, Ramesh B (2010) Analysis of phenotypic and
microsatellite-based diversity of maize landraces in India, especially from the
North East Himalayan region. Genetica 138:619-631 doi:
10.1007/s10709-010-9436-1
Souza LV, Miranda GV, Galvão JCC, Eckert FR, Mantovani EE, DeLima RO,
Guimarães LJM (2008) Genetic control of grain yield and nitrogen use
efficiency in tropical maize. Pesquisa Agropecuária Brasileira 43:1517-1523
Viana JMS, Valente MSF, Scapim CA, Resende MDV, Silva FF (2011) Genetic
25
Walk TC, Jaramillo R, Lynch JP (2006) Architectural tradeoffs between adventitious
and basal roots for phosphorus acquisition. Plant Soil 279:347-366 doi:
10.1007/s11104-005-0389-6
Warburton ML, Xianchun X, Crossa J, Franco J, Melchinger AE, Frisch M, Bohn M,
Hoisington D (2002) Genetic characterization of CIMMYT inbred maize lines
and open pollinated populations using large scale fingerprinting methods. Crop
Science 42:1832-1840
Wei D, Cui K, Ye G, Pan J, Xiang J, Huang J, Nie L (2012) QTL mapping for
nitrogen-use efficiency and nitrogen-deficiency tolerance traits in rice. Plant Soil
359:281-295 doi: 10.1007/s11104-012-1142-6
Worku M, Bänziger M, Erley GS, Friesen D, Diallo AO, Horst WJ (2007) Nitrogen
uptake and utilization in contrasting nitrogen efficient tropical maize hybrids.
Crop Science 47:519-528 doi: 10.2135/cropsci2005.05.0070
Wu Y, Liu W, Li X, Li M, Zhang D, Hao Z, Weng J (2011) Low-nitrogen stress
tolerance and nitrogen agronomic efficiency among maize inbreds: comparison
of multiple indices and evaluation of genetic variation. Euphytica 180:281-290
26
Table 1 List of the 25 popcorn inbred lines with their origin populations.
Inbred Lines Origin population
IL 05-351-8 Viçosa
IL 05-356-6 Viçosa
IL 05-381-1 Viçosa
IL 05-383 Viçosa
IL 05-391-1 Viçosa
IL 05-470-2 Viçosa
IL 05-284-7 Viçosa
IL 05-394-2 Viçosa
IL 05-389-4 Viçosa
IL 03-583-2 Beija-Flor
IL 05-274-3 Viçosa
IL 03-658-7 Beija-Flor
IL 03-657-4 Beija-Flor
IL 03-687-1 Beija-Flor
IL 05-343-2 Viçosa
IL 03-591-7 Beija-Flor
IL 05-402-1 Viçosa
IL 03-610-7 Beija-Flor
IL 03-655-3 Beija-Flor
IL 03-566-5 Beija-Flor
IL 03-677-5 Beija-Flor
IL 03-689-4 Beija-Flor
IL 05-345-1 Viçosa
IL 05-388 Viçosa
27
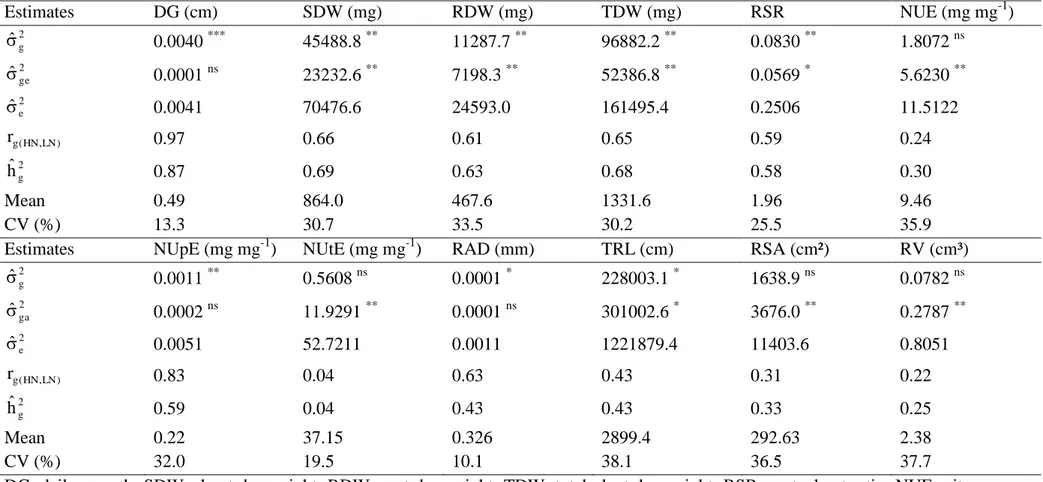
Table 2 Genetic parameters for traits associated with nitrogen use efficiency evaluated in 25 popcorn inbred lines under contrasting N levels.
DG, daily growth; SDW, shoot dry weight; RDW, root dry weight; TDW, total plant dry weight; RSR, root: shoot ratio; NUE, nitrogen use efficiency; NUpE, nitrogen uptake efficiency; NUtE, nitrogen utilization efficiency; RAD, root average diameter; TRL, total root length; RSA, root surface area; RV, root volume.
ns
non-significant; *, ** and *** significant at 0.10, 0.05 and 0.01 probability, respectively.
Estimates DG (cm) SDW (mg) RDW (mg) TDW (mg) RSR NUE (mg mg-1)
2 g ˆ
0.0040 *** 45488.8 ** 11287.7 ** 96882.2 ** 0.0830 ** 1.8072 ns
2 ge ˆ
0.0001 ns 23232.6 ** 7198.3 ** 52386.8 ** 0.0569 * 5.6230 **
2 e
ˆ
0.0041 70476.6 24593.0 161495.4 0.2506 11.5122
) LN , HN ( g
r 0.97 0.66 0.61 0.65 0.59 0.24
2 g
hˆ 0.87 0.69 0.63 0.68 0.58 0.30
Mean 0.49 864.0 467.6 1331.6 1.96 9.46
CV (%) 13.3 30.7 33.5 30.2 25.5 35.9
Estimates NUpE (mg mg-1) NUtE (mg mg-1) RAD (mm) TRL (cm) RSA (cm²) RV (cm³) 2
g ˆ
0.0011 ** 0.5608 ns 0.0001 * 228003.1 * 1638.9 ns 0.0782 ns
2 ga ˆ
0.0002 ns 11.9291 ** 0.0001 ns 301002.6 * 3676.0 ** 0.2787 **
2 e
ˆ
0.0051 52.7211 0.0011 1221879.4 11403.6 0.8051
) LN , HN ( g
r 0.83 0.04 0.63 0.43 0.31 0.22
2 g
hˆ 0.59 0.04 0.43 0.43 0.33 0.25
Mean 0.22 37.15 0.326 2899.4 292.63 2.38
28
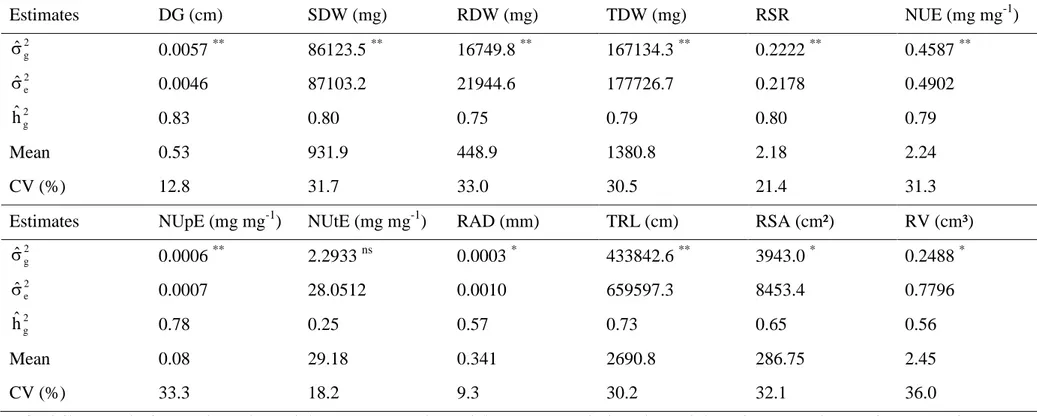
Table 3 Genetic parameters for traits associated with nitrogen use efficiency evaluated in 25 popcorn inbred lines under high N.
DG, daily growth; SDW, shoot dry weight; RDW, root dry weight; TDW, total plant dry weight; RSR, root: shoot ratio; NUE, nitrogen use efficiency; NUpE, nitrogen uptake efficiency; NUtE, nitrogen utilization efficiency; RAD, root average diameter; TRL, total root length; RSA, root surface area; RV, root volume.
ns
non-significant; *, ** significant at 0.05 and 0.01 probability, respectively.
Estimates DG (cm) SDW (mg) RDW (mg) TDW (mg) RSR NUE (mg mg-1)
2 g ˆ
0.0057 ** 86123.5 ** 16749.8 ** 167134.3 ** 0.2222 ** 0.4587 **
2 e
ˆ
0.0046 87103.2 21944.6 177726.7 0.2178 0.4902
2 g
hˆ 0.83 0.80 0.75 0.79 0.80 0.79
Mean 0.53 931.9 448.9 1380.8 2.18 2.24
CV (%) 12.8 31.7 33.0 30.5 21.4 31.3
Estimates NUpE (mg mg-1) NUtE (mg mg-1) RAD (mm) TRL (cm) RSA (cm²) RV (cm³)
2 g ˆ
0.0006 ** 2.2933 ns 0.0003 * 433842.6 ** 3943.0 * 0.2488 *
2 e
ˆ
0.0007 28.0512 0.0010 659597.3 8453.4 0.7796
2 g
hˆ 0.78 0.25 0.57 0.73 0.65 0.56
Mean 0.08 29.18 0.341 2690.8 286.75 2.45
29
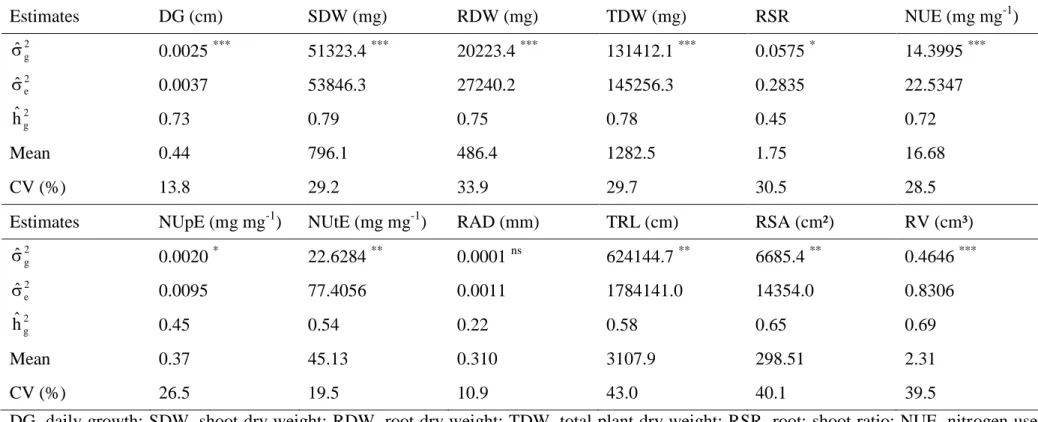
Table 4 Genetic parameters for traits associated with nitrogen use efficiency evaluated in 25 popcorn inbred lines under low N.
DG, daily growth; SDW, shoot dry weight; RDW, root dry weight; TDW, total plant dry weight; RSR, root: shoot ratio; NUE, nitrogen use efficiency; NUpE, nitrogen uptake efficiency; NUtE, nitrogen utilization efficiency; RAD, root average diameter; TRL, total root length; RSA, root surface area; RV, root volume.
ns
non-significant; *,** and *** significant at 0.10, 0.05 and 0.01 probability, respectively.
Estimates DG (cm) SDW (mg) RDW (mg) TDW (mg) RSR NUE (mg mg-1)
2 g ˆ
0.0025 *** 51323.4 *** 20223.4 *** 131412.1 *** 0.0575 * 14.3995 ***
2 e
ˆ
0.0037 53846.3 27240.2 145256.3 0.2835 22.5347
2 g
hˆ 0.73 0.79 0.75 0.78 0.45 0.72
Mean 0.44 796.1 486.4 1282.5 1.75 16.68
CV (%) 13.8 29.2 33.9 29.7 30.5 28.5
Estimates NUpE (mg mg-1) NUtE (mg mg-1) RAD (mm) TRL (cm) RSA (cm²) RV (cm³)
2 g ˆ
0.0020 * 22.6284 ** 0.0001 ns 624144.7 ** 6685.4 ** 0.4646 ***
2 e
ˆ
0.0095 77.4056 0.0011 1784141.0 14354.0 0.8306
2 g
hˆ 0.45 0.54 0.22 0.58 0.65 0.69
Mean 0.37 45.13 0.310 3107.9 298.51 2.31
30
Table 5 Correlation coefficients among traits related to NUE and the first two
principal components (PC) in popcorn inbred lines under high and low N conditions.
High N Low N
Trait PC1 PC2 PC1 PC2
Daily growth (DG) 0.58 0.63 0.43 0.87
Shoot dry weight (SDW) 0.94 -0.20 0.95 -0.18
Root dry weight (RDW) 0.87 -0.32 0.93 -0.26
Nitrogen uptake efficiency (NUpE) 0.93 0.28 0.81 0.22
Nitrogen utilization efficiency (NUtE) -0.10 -0.88 0.89 0.02
Nitrogen use efficiency (NUE) 0.97 0.02 0.97 0.16
Total root length (TRL) 0.86 -0.31 0.88 -0.35
Percentage of total variance 64.6 21.2 73.2 15.0
31
Table 6 Estimates of direct and indirect effects obtained from the path analysis
involving the dependent variable nitrogen use efficiency (NUE, mg mg-1) and the independent variables nitrogen uptake efficiency (NUpE, mg mg-1), nitrogen utilization efficiency (NUtE, mg mg-1), shoot dry weight (SDW, mg) and root dry weight (RDW, mg) evaluated in 25 popcorn inbred lines under each N level.
Trait Association effect Estimates
High N Low N
NUpE
Direct in NUE 0.82 0.60
Indirect through NUtE -0.06 0.26
Indirect through SDW 0.16 0.04
Indirect through RDW 0.03 -0.01
Total 0.95 0.89
NUtE
Direct in NUE 0.18 0.50
Indirect through NUpE -0.26 0.31
Indirect through SDW 0.02 0.05
Indirect through RDW 0.01 -0.01
Total -0.05 0.84
SDW
Direct in NUE 0.19 0.06
Indirect through NUpE 0.69 0.44
Indirect through NUtE 0.02 0.42
Indirect through RDW 0.04 -0.01
Total 0.94 0.90
RDW
Direct in NUE 0.04 -0.02
Indirect through NUpE 0.55 0.39
Indirect through NUtE 0.02 0.41
Indirect through SDW 0.16 0.05
Total 0.77 0.83
Determination coefficient (R²) 0.99 0.99
32
Table 7 Markers associated (p-value < 0.05) with traits related to NUE evaluated in popcorn inbred lines from two origin populations under
contrasting N levels.
SDW, shoot dry weight; RDW, root dry weight; TRL, total root length; NUtE, nitrogen utilization efficiency; NUE, nitrogen use efficiency
a
Chromosome bins of the marker and position taken from MaizeGDB database.
Origin Trait Low N High N
population Marker p-value bin a Position a (cM) R² (%) Marker p-value bin Position (cM) R² (%)
'Viçosa' SDW umc1110 0.0012 5.03 82.5 86.1 umc1110 0.0164 5.03 82.5 74.2
RDW umc1110 0.0069 5.03 82.5 79.1
TRL umc1110 0.0253 5.03 82.5 71.3
NUtE umc1110 0.0036 5.03 82.5 82.1
'Beija-Flor' SDW phi085 0.0113 5.06 205.2 77.6 bnlg161 0.0495 5.05 171.5 70.0
umc1153 0.0059 5.09 211.8 76.9
umc1447 0.0336 5.03 33.8 67.7
RDW phi085 0.0131 5.06 205.2 76.5
umc1153 0.0109 5.09 211.8 72.5
TRL phi085 0.0471 5.06 205.2 63.9
umc1153 0.0495 5.09 211.8 57.6
NUtE umc1792 0.0368 5.08 211.6 80.8
33
Figure 1 Genotypic values for nitrogen uptake efficiency (NUpE) and nitrogen utilization efficiency (NUtE) obtained from 25 popcorn inbred lines
34
Figure 2 Genotypic values for nitrogen uptake efficiency (NUpE) and nitrogen utilization efficiency (NUtE) obtained from 25 popcorn inbred lines
35
36
37
38