QTLs for seedling traits under salinity
stress in hexaploid wheat
Caracterização de QTLs por traços de sementes sob
o estresse de salinidade em trigo Hexaploid
Yongzhe Ren
1*Yanhua Xu
1, 2Wan Teng
3Bin Li
3Tongbao Lin
1ISSNe 1678-4596
INTRODUCTION
Dryland salinity is a major limitation to
crop production. About 20% of irrigated agricultural
land in the world is affected by salinity (BOYER,
1982; FLOWERS et al., 1995). Soil salinity inhibits
plant growth for not only osmotic stress but
ion-excess stress. The presence of salt in the soil solution
reduces the ability of plants to take up water, and
then affects growth. This is the osmotic effect of
salinity. Moreover, uptake excessive amounts of salt
will eventually injure cells in the transpiring leaves
and this may further reduce growth. This is the
ion-excess effect of salinity (MUNNS, 1993; MUNNS,
2006). To survive, plants have evolved complex salt
tolerance mechanisms (ZHU et al., 2002; HANIN et
1College of Agronomy/State Key Laboratory of Wheat and Maize Crop Science/Collaborative Innovation Center of Henan Grain Crops, Henan
Agricultural University, 450002, Zhengzhou, China. E-mail: [email protected]. *Corresponding author. 2Shangqiu Normal University, Shangqiu, China.
3State Key Laboratory for Plant Cell and Chromosome Engineering, Institute of Genetics and Developmental Sciences, Chinese Academy of
Sciences, Beijing, China.
ABSTRACT: Soil salinity limits agricultural production and is a major obstacle for increasing crop yield. Common wheat is one of the most important crops with allohexaploid characteristic and a highly complex genome. QTL mapping is a useful way to identify genes for quantitative traits such as salinity tolerance in hexaploid wheat. In the present study, a hydroponic trial was carried out to identify quantitative trait loci (QTLs) associated with salinity tolerance of wheat under 150mM NaCl concentration using a recombinant inbred line population (Xiaoyan 54×Jing 411). Values of wheat seedling traits including maximum root length (MRL), root dry weight (RDW), shoot dry weight (SDW), total dry weight (TDW) and the ratio of TDW of wheat plants between salt stress and control (TDWR) were evaluated or calculated. A total of 19QTLs
for five traits were detected through composite interval mapping method by using QTL Cartographer version 2.5 under normal and salt stress conditions. These QTLs distributed on 12 chromosomes explained the percentage of phenotypic variation by individual QTL varying from
7.9% to 19.0%. Among them, 11 and six QTLs were detected under normal and salt stress conditions, respectively and two QTLs were detected for TDWR. Some salt tolerance related loci may be pleiotropic. Chromosome 1A, 3A and 7A may harbor crucial candidate genes associated with wheat salt tolerance. Our results would be helpful for the marker assisted selection to breed wheat varieties with improved salt tolerance.
Key words: Triticum aestivum L., salinity stress, quantitative trait locus (QTL), marker assisted selection.
RESUMO: A salinidade do solo limita a produção agrícola. O trigo mole é uma das culturas mais importantes com característica
allohexaploid e genoma altamente complexo. O mapeamento QTL é uma maneira muito útil de identificar genes para traços quantitativos, como a tolerância à salinidade em trigo hexaplóide. No presente estudo realizou-se um ensaio hidropónico para identificar locos de traços
quantitativos (QTLs) associados à tolerância à salinidade do trigo sob concentração de NaCl 150 mM, usando uma população de linhagem consanguíneo recombinante (Xiaoyan 54 × Jing 411). Os valores dos traços de mudas de trigo, incluindo comprimento máximo da raiz (MRL), peso seco da raiz (RDW), ponha o peso seco (SDW), peso seco total (TDW) e a proporção das plantas de trigo TDW entre o estresse salgado e o controle (TDWR), foram avaliados ou calculados. Um total de 19QTLs para cinco traços foram detectados através do método de mapeamento
de intervalo composto usando a versão 2.5 do cartógrafo QTL sob condições normais e de estresse salino. Estes QTLs distribuídos em 12 cromossomos explicaram a porcentagem de variação fenotípica por QTL individual variando de 7,9% a 19,0%. Entre eles, foram detectados 11 e 6 QTLs em condições de estresse normal e sal, respectivamente, e dois QTLs foram detectados para TDWR. Cromossoma 1A, 3A e
7A podem conter genes que são candidatos cruciais associados à tolerância ao sal de trigo.Nossos resultados seriam úteis para a seleção assistida por marcadores para produzir variedades de trigo com tolerância salina melhorada.
Palavras-chave: Triticum aestivum L., Stress de salinidade, QTL,Seleção assistida por marcador.
al., 2016). For example, the salt overly sensitive (SOS)
pathway of salt tolerance is crucial for maintaining
ion homeostasis under salt stress in model plant
Arabidopsis
. SOS pathway was also more active in
salt tolerant cultivar PI365967 than in salt sensitive
cultivar in tomato indicating that SOS pathway
may be conserved across diverse plant species.
Besides, salicylic acid (SA), abscisic acid (ABA),
brassinosteroids (BRs) pathway and detoxification
system may also be involved in salt perception or
salt responses (KRISHNA et al., 2003;
MARTINEZ-ATIENZA et al., 2007; SUN et al., 2010; SUN et al.,
2015; CHEN et al.,
2017).
Wheat is one of the most important food
crops. Improving salt tolerance of wheat is needed
to sustain food production in many regions in the
world. To exploit variation in salt tolerance of wheat,
large international collections have been screened
in hydroponic or sand culture (KINGSBURY et al.,
1984; SAYED, 1985; JAFARI-SHABESTARI et
al., 1995). These researches laid a solid foundation
for breeding wheat varieties with improved salt
tolerance and provided us with research materials for
probing into the mechanisms of wheat salt tolerance.
In recent years, genome-wide transcriptomic
and proteomic analysis for identification of
salt-responsive genes in common wheat provided many
useful clues (KAWAURA et al., 2008; GUO et al.,
2012; CAPRIOTTI et al., 2014; GOYAL et al., 2016;
JIANG et al., 2017). The differential expressed
proteins/genes were involved primarily in carbon
metabolism, detoxification and defense, chaperon
and signal transduction. A number of salt tolerant
related genes (FEKI et al., 2014; MAKHLOUFI et
al., 2014; SUN et al., 2015; TOUNSI et al., 2016;
GOYAL et al., 2016; CHEN et al., 2017) and QTLs
(MEGAN et al., 2004; HUANG et al., 2006; WU
et al., 2007; GENC et al., 2010; REN et al., 2012a;
XU et al., 2013; MASOUDI et al., 2015; TOUNSI et
al., 2016; OYIGA et al.,
2017) have been identified
in wheat in recent years. These provided useful
information for genetic improvement of salt tolerance
in wheat. However, for the intricate character of
wheat salt tolerance, the underlying genetic basis was
still unclear. Therefore, further exploiting QTLs that
contribute to natural variation in salt tolerance would
be helpful in understanding the mechanisms of wheat
salt tolerance.
In wheat, salt tolerance is associated with
low rates of transport of Na
+to shoots and high
selectivity for K
+over Na
+which were controlled
by
Kna1
located on chromosome 4D (GORHAM et
al., 1987; GORHAM et al., 1990; DUBCOVSKY
et al., 1996). Correlations between grain yield and
Na
+exclusion from leaves, along with the associated
enhanced K
+/Na
+discrimination, have also been
shown in wheat (CHHIPA et al., 1995; ASHRAF et
al., 1997; XU et al., 2013; MASOUDI et al., 2015).
Growth performance of seedlings of one specific
wheat cultivar grown under salt stress can reflect its
salt tolerance to a great extent. Root length, root fresh
and dry weights, and shoot fresh and dry weights of
wheat seedlings are associated with salt tolerance
and could be used as selection criteria in wheat
(SHAHZAD et al., 2012). In this paper, we mapped
QTLs for seedling traits under normal and salt stress
conditions using a recombinant inbred line (RIL)
population derived from two Chinese wheat varieties
Xiaoyan 54 and Jing 411. These results may provide
useful information for molecular design of wheat
varieties with improved salt tolerance.
MATERIALS AND METHODS
One recombinant inbred line (RIL)
population was used in this study. The RIL population
contained 142 RILs derived from two Chinese winter
wheat varieties Xiaoyan 54 and Jing 411.
Hydroponic culture was used to
investigate the seedling traits of wheat. Methods
for seed sterilization, germination and the growth
conditions of wheat plants were described previously
(REN et al., 2012b). The growth chamber was set at
22°C in the day time and 18°C in the night time,
60% relative humidity and a 15-hour day length.
The seedling traits of the “Xiaoyan 54 × Jing 411”
RIL population were investigated after these lines
were grown in nutrition solution in the growth
chamber for 25 days under normal (CK) and salt
stress (ST, 150mM NaCl) conditions. The maximum
root length (MRL) of plant roots were measured
using a ruler and then the shoot dry weight (SDW),
root dry weight (RDW) and total dry weight (TDW)
were measured after oven-drying at 80°C for 48h.
The ratio of TDW (TDWR, ST/CK) of each line was
also calculated.
The genetic map of the “Xiaoyan 54 ×
Jing 411” RIL population was described by REN et
al., (2012b). Detection of QTLs for wheat seedling
traits under normal and salt stress conditions in this
RIL population was conducted by composite interval
mapping (ZENG, 1994). Analyses of QTL location,
additive effect and 95% confidence intervals of QTLs
were set according to the method described by SU et
al. (2009) and WANG et al. (2012). In brief, the walk
speed and window size were set as 2cM and 10cm,
respectively, with five control markers. Phenotypic
variation explained by a single QTL was determined
by the square of the partial correlation coefficient
(
R
2). Threshold of LOD value for QTL detection was
set as 3.0.
RESULTS
Evaluation of phenotypes
We measured root dry weight (RDW),
maximum root length (MRL), shoot dry weight
(SDW) and total dry weight (TDW) under normal
(CK) and salt stress (ST) conditions. Under CK
condition, the male parent Jing 411 had significant
higher RDW, SDW and TDW than the female parent
Xiaoyan 54, but it had shorter MRL than Xiaoyan
54 (Table 1). Salt stress significantly reduced the
values of all these four traits in Xiaoyan 54 and
Jing 411 compared to CK treatment. Jing 411 and
Xiaoyan 54 had similar RDW and MRL, but Jing
411 had higher SDW and TDW than Xiaoyan 54
under ST condition (Table 1). These two parents
also had similar relative TDW (TDWR, the ratio of
TDW under ST and CK conditions), indicating that
the plant growth of these two parents had similar
sensitivity to salt stress.
The RIL lines showed large variations in
all the investigated traits (Table 1). There existed
RILs with values that were higher or lower than both
parents among all these traits, indicating potential
transgressive variations and the presence of positive
and negative alleles in both parents.
QTLs Identification
We totally detected three QTLs for RDW, three
for MRL, five for SDW, six for TDW and two for TDWR.
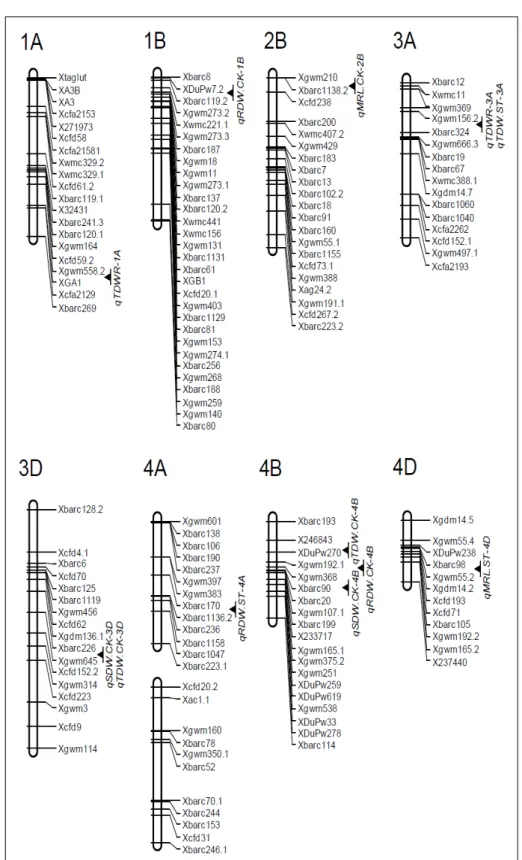
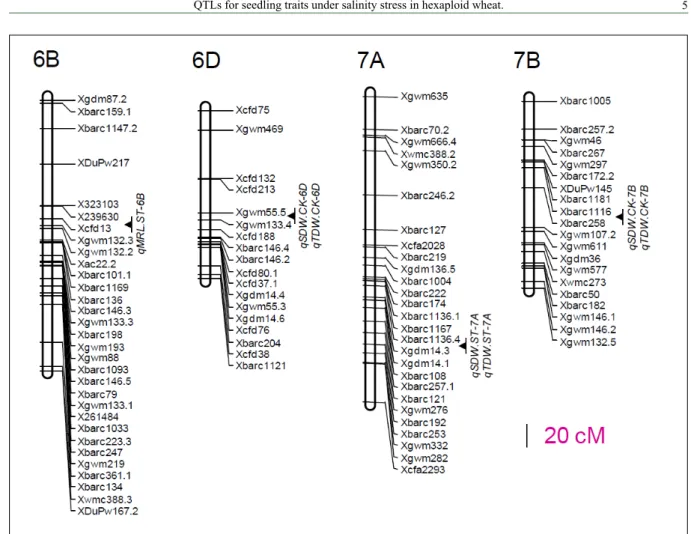
These 19QTLs located on 12 chromosomes, and the
percentage of phenotypic variation explained by individual
QTL varied from 7.9% to 19.0% (Figure 1 and 2, Table 2).
We detected two and one QTLs for RDW
under normal and 150mM NaCl salt stress condition
respectively.
qRDW.ST-4A
, the QTL detected under
ST condition located on chromosome 4A and
explained 19.0% of phenotypic variation in RDW
(Figure 1 and 2, Table 2).
One and two QTLs for MRL were detected
under CK and ST conditions respectively (Figure 1
and 2, Table 2).
qMRL.CK-2B
for MRL were detected
in CK which located on the short arm of chromosome
2B and the other two QTLs were detected under ST
condition.
qMRL.ST-4D
located on chromosome 4D
and explained 8.3% MRL variation.
qMRL.ST-6B
located on chromosome 6B and explained 16% MRL
variation (Table 2).
Four and one QTLs for SDW were detected
under CK and ST conditions respectively. The only
QTL for SDW detected under ST condition,
qSDW.ST-7A,
located
on chromosome 7A and explained 12.4%
SDW phenotypic variation (Figure 1 and 2, Table 2).
We detected four and two QTLs for TDW under CK
and ST conditions respectively.
(Figure 1 and 2, Table
2). The six QTLs for TDW explained phenotypic
variations varying from 9.3% to 15.3%.
qTDW.ST-3A
and
qTDW.ST-7A
were detected under ST condition
and explained 12.3% and 12.0% TDW phenotypic
variations respectively (Figure 1 and 2, Table 2).
We detected two QTLs for TDWR (Figure
1 and 2, Table 2).
qTDWR-1A
located on chromosome
Table - 1 Mean values and ranges for the investigated traits in the RIL population and their parents at seedling stage in this trial.
Trait Treatment ---Parent--- ---RIL---
Xiaoyan54 Jing 411 Mean ± SD Min. Max.
RDW CK 9.5 ± 0.8(a) 11.7 ± 0.8(b) 11.8 ± 3.3 6.0 23.0
ST 8.0 ± 1.6 8.0 ± 0.5 10.1 ± 2.8 3.6 34.0
MRL CK 26.4 ± 0.8(A) 19.8 ± 0.7(B) 23.2 ± 4.8 13.0 37.5
ST 16.5 ± 0.5 16.8 ± 1.5 15.6 ± 2.2 9.4 22.4
SDW CK 61.2 ± 1.5(A) 76.1 ± 4.0(B) 71.9 ± 17.3 39.0 127.7
ST 41.2 ± 1.2(a) 52.4 ± 3.4(b) 42.4 ± 8.2 21.7 66.0
TDW CK 70.7 ± 2.2(a) 87.9 ± 3.1(b) 83.7 ± 19.9 46.7 149.6
ST 49.2 ± 1.6(a) 60.4 ± 2.9(b) 52.5 ± 9.8 25.3 82.7
RDW, root dry weight (mg plant-1); MRL, maximum root length (cm); SDW, shoot dry weight (mg plant-1); TDW, total biomass dry
weight (mg plant-1).Statistical difference between the two parents is indicated by different letters after the means. Lower case letters
1A and explained 13.7% TDWR variation. the other
QTL,
qTDWR-3A,
located on chromosome 3A and
explained 15% TDWR variation. (Table 2).
DISCUSSION
Although some single-gene effects for
salinity tolerance have been identified in higher plants
(for example
AtNHX1
and
RAS1
in
Arabidopsis
(APSE et al., 1999; REN et al., 2010),
OsNHX1
and
SKC1
in rice (FUKUDA et al., 1999; REN et
al., 2005)), the tolerance of salinity is genetically
and physiologically complex. Large international
collections have been screened (KINGSBURY et
al., 1984; SAYED, 1985; JAFARI-SHABESTARI et
al., 1995), however, the application of salt-tolerant
varieties to the improvement of cereal crops such as
wheat remains hampered because of the quantitative
nature of the genes involved. Identification of QTLs
and some defined regions of chromosome are of
crucial importance to enhance wheat salt tolerance.
Markers closely associated with major QTLs for salt
tolerance might be used for breeding programs in
wheat using marker-assisted selection. QTL analyses
for salt tolerance in wheat at seedling stage have been
conducted in previous studies (MEGAN et al., 2004;
HUANG et al.,
2006; WU et al., 2007; GENC et al.,
2010; REN et al.,
2012a; XU et al., 2013; MASOUDI
et al.,
2015; OYIGA et al., 2017). However, these
genes and/or QTLs are not sufficient for understanding
the genetic basis and the genetic improvement of salt
tolerance in wheat. To further exploit QTLs for wheat
salt tolerance, we evaluated the seedling traits of a RIL
population under normal and salinity stress conditions
in this paper. We found that there exist no significant
differences of RDW and MRL between Xiaoyan 54
and Jing411, but Jing 411 had higher SDW and TDW
than Xiaoyan 54 under under 150mM salt stress
condition. The RDW, MRL, SDW and TDW of the
RIL population were significantly decreased under salt
stress condition comparing to those of under normal
condition (Table 1, 2), which is in consistence with
previous study (WU et al., 2007; REN et al., 2012a;
TOUNSI et al., 2016).
In total, we detected 11 and six QTLs under
normal and salt stress conditions respectively and two
QTLs for TDWR (Table 2). These 19 QTLs explained
phenotypic variations varying from 7.9% to 19.0%
(Table 2). The locus for MRL on chromosome 2B,
which tightly linked with SSR marker
Xbarc1138,
explained 15.2% MRL phenotypic variation (Figure
1 and 2, Table 2). In fact, this locus has been reported
controlling multi-root morphologic parameters and
a number of QTLs for yield component (explained
19.1% and 17.3% of phenotypic variations in grain
weight per ear and grain number per ear, respectively)
(REN et al., 2012b; HAI et al., 2008).
However,
we did not detect any QTLs for root traits in this
chromosomal region under ST condition, indicated
that the expression of this locus is inhibited and very
sensitive to salt stress. Actually this QTL has been
proved to be involved in brassinosteroids (BRs)
signaling pathway (HE et al., 2014) and BRs is also
known to confer salt stress tolerance (KRISHNA
et al., 2003; ZHU et al., 2016). The
qTDWR-3A
located on chromosome 3A between SSR marker
Xgwm156.2
and
Xbarc324
, and explained 15.0%
TDWR phenotypic variation. We found that some
chromosomal regions governed more than one trait
under salt stress condition. For example,
qTDW.ST-3A
and
qTDWR-3A
were mapped in the same marker
interval (
Xgwm156.2-Xbarc324
) on chromosome
3A. The marker interval
Xbarc1136.4
-
Xgdm14.3
on
chromosome 7A also located two QTLs (
qSDW.ST-7A
and
qTDW.ST-7A
). These salt-tolerance related
loci may be pleiotropic.
We found that some QTLs detected in
this study were tightly linked or coincided with
previously reported salt tolerant QTLs in wheat.
qTDWR-1A
was located on chromosome 1A and
tightly linked with SSR marker
Xgwm558
. Actually,
this chromosomal region has been reported harboring
two QTLs for salt tolerance, named
QTdw-1A and
QSkn-1A
(controlling Shoot K
+/Na
+concentration
ratio), which also linked with SSR marker
Xgwm558
on chromosome 1A.
qTDWR-3A and qTDW.ST-3A
Table 2 - QTLs detected in this trial using the “Xiaoyan 54×Jing 411” RIL population.
Trait Treat-ment QTL Chra Marker intervalb LODc R2× 100 Additived
RDW
CK qRDW.CK-1B 1B XDuPw7.2-Xbarc119.2 3.4 7.9 1.2 CK qRDW.CK-4B 4B Xgwm192.1-Xgwm368 4.5 11.6 -1.4 ST qRDW.ST-4A 4A Xbarc170-Xbarc1136.2 3.3 19.0 0.5 MRL
CK qMRL.CK-2B 2B Xbarc1138.2-Xcfd238 5.1 15.2 2.1 ST qMRL.ST-4D 4D Xbarc98-Xgwm55.2 3.0 8.3 0.4 ST qMRL.ST-6B 6B X239630-Xcfd13 4.5 16.0 -0.6
SDW
CK qSDW.CK-3D 3D Xbarc226-Xgwm645 3.2 13.7 7.3 CK qSDW.CK-4B 4B Xbarc90-Xbarc20 4.2 9.8 -6.2 CK qSDW.CK-6D 6D Xgwm55.5-Xgwm133.4 3.7 9.4 -6.1 CK qSDW.CK-7B 7B Xbarc1116-Xbarc258 3.4 12.1 -6.9 ST qSDW.ST-7A 7A Xbarc1136.4-Xgdm14.3 3.6 12.4 -1.7
TDW
CK qTDW.CK-3D 3D Xbarc226-Xgwm645 3. 7 15.3 8.8 CK qTDW.CK-4B 4B XDuPw270-Xgwm192.1 3.1 9.3 -7.0 CK qTDW.CK-6D 6D Xgwm55.5-Xgwm133.4 4.1 10.2 -7.2 CK qTDW.CK-7B 7B Xbarc1116-Xbarc258 3.3 9.5 -7.0 ST qTDW.ST-3A 3A Xgwm156.2-Xbarc324 3.51 12.3 -2.1 ST qTDW.ST-7A 7A Xbarc1136.4-Xgdm14.3 3.8 12.0 -2.0
TDWR ST/CK qTDWR-1A 1A Xgwm558.2-XGluA1 3.6 13.7 0.044
ST/CK qTDWR-3A 3A Xgwm 156.2-Xbarc324 4.3 15.0 -0.038
aChr means chromosome name.bMarkers underlined were the nearest marker to the QTL.cLOD means Logarithm of odds.dAdditive effects,
were located between SSR marker
Xgwm156.2
and
Xbarc324
on chromosome 3A and coincided with
previously reported
QTDW-3A and QSkn-3A
(XU
et al., 2012)
.
Genc had proved that QTLs for Na
+exclusion was associated with an increase (10%)
in seedling biomass. Of the five QTLs identified
for Na
+exclusion in the literature, two were
co-located with seedling biomass (GENC et al., 2010).
SHAHZAD also verified that the biomass of wheat
seedlings could be used as selection criteria in salt
tolerance (SHAHZAD et al., 2012). Taken together,
the clustering of
qTDWR-3A and qTDW.ST-3A
, and
coinciding with previously reported QTL for K
+/Na
+concentration ratio indicated that this chromosomal
region may harbor crucial salt-tolerance genes. The
QTLs detected repeatedly in different trials described
above may facilitate MAS of wheat salt tolerance.
CONCLUSION
We identified a total of 19QTLs for wheat
seedling traits, of which 11 were detected under normal
condition and six under salt stress condition. The other
two QTLs controlled TDWR. Some salt-tolerance
related loci may be pleiotropic. Chromosome 1A,
3A and 7A may harbor crucial salt-tolerance related
loci and the linked marker could be utilized in wheat
breeding for improving salt tolerance.
ACKNOWLEDGEMENTS
We are very grateful to Prof. Aimin Zhang and Dr. Dongcheng Liu for providing the genotype data of the genetic linkage map. This research was supported by the National Key Research and Development Program of China (2016YFD0300205), the National Natural Science Foundation of China (31401375) and Natural Science Foundation of Henan province (162300410133).
REFERENCES
APSE, M.P. et al. Salt tolerance conferred by overexpression of a vacuolar Na+/H+ antiport in Arabidopsis. Science, v. 285, n. 5431,
p. 1256-1258, 1999. Available from: <http://science.sciencemag. org/content/285/5431/1256.long>. Accessed: Jun. 16, 2017. doi: 10.1126/science.285.5431.1256.
ASHRAF, M. et al. Relationship between ion accumulation and growth in two spring wheat lines differing in salt tolerance at different growth stages. Journal of Agronomy and Crop Science, v. 178, n. 1, p. 39-51, 1997. Available from: <http://onlinelibrary.wiley.com/ doi/10.1111/j.1439-037X.1997.tb00349.x/full>. Accessed: Jun. 16, 2017. doi: 10.1111/j.1439-037X.1997.tb00349.x.
WANG, S. et al. Windows QTL Cartographer 2.5. Department of Statistics, North Carolina State University, Raleigh, NC. 2012. Available from: <https://brcwebportal.cos.ncsu.edu/qtlcart/WQTLCart.htm>. Accessed: Jun. 18, 2017.
BOYER, J.S. Plant productivity and environment. Science, v. 218, n. 4571, p. 443-448, 1982. Available from: <http://science. sciencemag.org/content/218/4571/443.long>. Accessed: Jun. 16, 2017. doi: 10.1126/science.218.4571.443.
CAPRIOTTI, A.L. et al. Proteomic study of a tolerant genotype of durum wheat under salt-stress conditions. Analytical and Bioanalytical Chemistry, v. 406, n. 5, p. 1423-1435, 2014. Available from: <https://dx.doi.org/10.1007/s00216-013-7549-y>. Accessed: Jun. 16, 2017. doi: 10.1007/s00216-013-7549-y. CHEN, Y.H. et al. Ectopic expression of wheat expansin gene TaEXPA2 improved the salt tolerance of transgenic tobacco by regulating Na+ /K+ and antioxidant competence. Physiologia
Plantarum, v. 159, n. 2, p. 161-177, 159, 161-177, 2017. Available from: <http://onlinelibrary.wiley.com/doi/10.1111/ppl.12492/epdf>. Accessed: Jun. 16, 2017. doi: 10.1111/ppl.12492.
CHHIPA, B.R. et al. Na+/K+ ratios as the basis of salt tolerance in
wheat. Australian Journal of Agricultural Research, v. 46, n. 3, p. 533-539, 1995. Available from: <http://www.publish.csiro.au/ AR/pdf/AR9950533>. Accessed: Jun. 16, 2017.
DUBCOVSKY, J. et al. Mapping of the K+/Na+ discrimination
locus Kna1 in wheat. Theoretical and Applied Genetics,v. 92, n. 3-4, p. 448-454, 1996. Available from: <https://link.springer.com/ article/10.1007%2FBF00223692>. Accessed: Jun. 16, 2017. doi: 10.1007/BF00223692.
FEKI, K. et al. A constitutively active form of a durum wheat Na(+)/H (+) antiporter SOS1 confers high salt tolerance to transgenic Arabidopsis. Plant Cell Reports, v. 33, n. 2, p. 277-288, 2014. Available from: <https://link.springer.com/article/1 0.1007%2Fs00299-013-1528-9>. Accessed: Jun. 16, 2017. doi: 10.1007/s00299-013-1528-9.
FLOWERS, T.J. et al. Breeding for salinity resistance in crop plants: where next? Australian Journal of Plant Physiology, v. 22, n. 6, p. 875-884, 1995. Available from: <http://www. publish.csiro.au/fp/PP9950875>. Accessed: Jun. 16, 2017. doi: org/10.1071/PP9950875.
FUKUDA, A. et al. Molecular cloning and expression of the Na+/H+
exchanger gene in Oryza sativa. Biochimica et Biophysica Acta, v. 1446, n. 1-2, p. 149-155, 1999. Available from: <http://www.sciencedirect. com/science/article/pii/S0167478199000652?via%3Dihub>. Accessed: Jun. 16, 2017. doi: org/10.1016/S0167-4781(99)00065-2.
GENC, Y. et al. Sodium exclusion QTL associated with improved seedling growth in bread wheat under salinity stress. Theoretical and Applied Genetics, v. 121, n. 5, p. 877-894, 2010. Available from: <https://link.springer.com/article/10.1007%2Fs00122-010-1357-y>. Accessed: Jun. 16, 2017. doi: 10.1007/s00122-010-1357-y. GORHAM, J. et al. Chromosomal location of a K/Na discrimination character in the D genome of wheat. Theoretical and Applied Genetics, v. 74, n. 5, p. 584-588, 1987. Available from: <https:// link.springer.com/article/10.1007%2FBF00288856>. Accessed: Jun. 16, 2017.
GORHAM, J. et al. Partial characterization of the trait for enhanced K+-Na+ discrimination in the D genome of wheat. Planta, v. 180,
GOYAL, E. et al. Transcriptome profiling of the salt-stress response
in Triticum aestivum cv. Kharchia Local. Scientific Reports, v. 6,
n. 27752, p. 1-14, 2016. Available from: <https://www.ncbi.nlm. nih.gov/pmc/articles/PMC4904219/>. Accessed: Jun. 16, 2017. doi: 10.1038/srep27752.
GUO, G. et al. Comparative proteomic analysis of salt response proteins in seedling roots of two wheat varieties. Journal of Proteomics, v. 75, n. 6, p. 1867-1885, 2012. Available from: <http:// www.sciencedirect.com/science/article/pii/S1874391911007135>. Accessed: Jun. 16, 2017. doi: 10.1016/j.jprot.2011.12.032. HAI, L. et al. Genomic regions for yield and yield parameters in Chinese winter wheat (Triticum aestivum L.) genotypes tested under varying environments correspond to QTL in widely different wheat materials. Plant Science, v. 175, n. 3, p. 226-232, 2008. Available from: <http://www.sciencedirect.com/science/article/pii/ S016894520800068X>. Accessed: Jun. 16, 2017. doi: 10.1016/j. plantsci.2008.03.006.
HANIN, M. et al. New insights on plant salt tolerance mechanisms and their potential use for breeding. Frontiers in Plant Science, v. 7, n. 1787, p. 1-17, 2016. Available from: <https://www.ncbi.nlm. nih.gov/pmc/articles/PMC5126725/>. Accessed: Jun. 16, 2017. doi: 10.3389/fpls.2016.01787.
HE, X. et al. A genotypic difference in primary root length is associated with the inhibitory role of transforming growth factor-beta receptor-interacting protein- 1 on root meristem size in wheat.
The Plant Journal,v. 77, n. 6, p. 931-943, 2014. Available from: <http://onlinelibrary.wiley.com/doi/10.1111/tpj.12449/epdf>. Accessed: Jun. 16, 2017. doi: 10.1111/tpj.12449.
HUANG, S. et al. A sodium transporter (HKT7) is a candidate for
Nax1, a gene for salt tolerance in durum wheat. Plant Physiology, v. 142, n. 4, p. 1718-1727, 2006. Available from: <http://www. plantphysiol.org/content/142/4/1718.long>. Accessed: Jun. 16, 2017. doi: 10.1104/pp.106.088864.
JAFARI-SHABESTARI, J. et al. Field evaluation of tolerance to salinity stress in Iranian hexaploid wheat landrace accessions.
Genetic Resources and Crop Evaluation, v. 42, n. 2, p. 147-156, 1995. Available from: <https://link.springer.com/article/10.1007/ BF02539518?no-access=true>. Accessed: Jun. 16, 2017. doi: 10.1007/BF02539518.
JIANG, Q.Y. et al. iTRAQ-based quantitative proteomic analysis of wheat roots in response to salt stress. Proteomics, v. 17, n. 8,,
2017. Available from: <http://onlinelibrary.wiley.com/doi/10.1002/ pmic.201600265/epdf>. Accessed: Jun. 16, 2017.doi: 10.1002/ pmic.201600265.
KAWAURA, K. et al. Genome-wide analysis for identification of
salt-responsive genes in common wheat. Functional & Integrative Genomics, v. 8, n. 3, p. 277-286, 2008. Available from: <https:// link.springer.com/article/10.1007%2Fs10142-008-0076-9>. Accessed: Jun. 16, 2017. doi: 10.1007/s10142-008-0076-9. KINGSBURY, R. et al. Selection for salt-resistant spring wheat.
Crop Science, v. 24, n. 2, p. 310-315, 1984. Available from: <https://eurekamag.com/research/001/249/001249769.php>. Accessed: Jun. 16, 2017. doi: 10.2135/cropsci1984.0011183X00 2400020024x.
KRISHNA, P. Brassinosteroid-mediated stress responses. Journal of Plant Growth Regulation, v. 22, n. 4, p. 289-297, 2003. Available
from: <https://link.springer.com/article/10.1007%2Fs00344-003-0058-z>. Accessed: Jun. 16, 2017. doi: 10.1007/s00344-003-0058-z. MAKHLOUFI, E. et al. Isolation and molecular characterization
of ERF1, an ethylene response factor gene from durum wheat
(Triticum turgidum L. subsp. durum), potentially involved in salt-stress responses. Journal of Experimental Botany, v. 65, n. 22, p. 6359-6371, 2014. Available from: <https://academic.oup.com/jxb/ article-lookup/doi/10.1093/jxb/eru352>. Accessed: Jun. 16, 2017. doi: 10.1093/jxb/eru352.
MARTÍNEZ-ATIENZA, J. et al. Conservation of the salt overly sensitive pathway in rice. Plant Physiology, v. 143, n. 2, p. 1001–1012, 2007. Available from: <https://www.ncbi.nlm.nih.gov/pmc/articles/ PMC1803719/>. Accessed: Jun. 16, 2017. doi: 10.1104/pp.106.092635. MASOUDI, B. et al. QTL mapping of salt tolerance traits with different effects at the seedling stage of bread wheat. Plant Molecular Biology Reporter, v. 33, n. 6, p. 1790-1803, 2015. Available from: <https://link.springer.com/article/10.1007/s11105-015-0874-x>. Accessed: Jun. 16, 2017. doi: 10.1007/s11105-015-0874-x.
MEGAN, P. et al. A locus for sodium exclusion (Nax1), a trait for salt tolerance, mapped in durum wheat. Functional Plant Biology, v. 31, n. 11, p. 1105-1114, 2004. Available from: <http://www. publish.csiro.au/fp/pdf/FP04111>. Accessed: Jun. 16, 2017. doi: 10.1071/FP04111.
MUNNS, R. Physiological processes limiting plant growth in saline soil: some dogmas and hypotheses. Plant Cell and Environment, v. 16, n. 1, p. 15–24, 1993. Available from: <http://onlinelibrary.wiley. com/doi/10.1111/j.1365-3040.1993.tb00840.x/pdf>. Accessed: Jun. 16, 2017. doi: 10.1111/ j.1365-3040.1993.tb00840.x.
MUNNS, R. et al. Approaches to increasing the salt tolerance of wheat and other cereals. Journal of Experimental Botany, v. 57, n. 5, p. 1025-1043, 2006. Available from: <https://academic.oup. com/jxb/article-lookup/doi/10.1093/jxb/erj100>. Accessed: Jun. 16, 2017. doi: 10.1093/jxb/erj100.
OYIGA, B.C. et al. Allelic variations and differential expressions detected at quantitative trait loci for salt stress tolerance in wheat. Plant Cell and Environment. Available from: <http:// onlinelibrary.wiley.com/doi/10.1111/pce.12898/epdf>. Accessed: Jun. 16, 2017. doi: 10.1111/pce.12898.
REN, Y.Z. et al. QTLs Analysis of Wheat Seedling Traits under Salt Stress. Scientia Agricultura Sinica, v. 45, n. 14, p. 2793-2800, 2012a. Available from: <http://en.cnki.com.cn/Article_en/ CJFDTOTAL-ZNYK201214003.htm>. Accessed: Jun. 16, 2017. doi: 10.3864/j.issn.0578-1752.2012.14.002.
REN, Y.Z. et al. Major quantitative trait loci for seminal root morphology of wheat seedlings.Molecular Breeding,v. 30, n. 1, p. 139-148, 2012b. Available from: <https://link.springer.com/art icle/10.1007%2Fs11032-011-9605-7>. Accessed: Jun. 16, 2017. doi: 10.1007/s11032-011-9605-7.
REN, Z. et al. RAS1, a quantitative trait locus for salt tolerance and ABA sensitivity in Arabidopsis. Proceedings of the National Academy of Sciences of USA, v. 107, n. 12, p. 5669-5674, 2010. Available from: <https://www.ncbi.nlm.nih.gov/pmc/articles/PMC2851765/>. Accessed: Jun. 16, 2017. doi: 10.1073/pnas.0910798107.
1141-1146, 2005. Available from: <https://www.nature.com/ng/ journal/v37/n10/full/ng1643.html>. Accessed: Jun. 16, 2017. doi:10.1038/ng1643.
XU, Y.F. et al. Mapping QTLs for salt tolerance with additive, epistatic and QTL × treatment interaction effects at seedling stage in wheat. Plant Breeding, v. 132, n. 3, p. 276-283, 2013. Available from: <http://onlinelibrary.wiley.com/doi/10.1111/pbr.12048/epdf>. Accessed: Jun. 16, 2017. doi: 10.1111/pbr.12048.
SHAHZAD, A. et al. Evaluation of wheat landrace genotypes for salinity tolerance at vegetative stage by using morphological and molecular markers. Genetics and Molecular Research, v. 11, n. 1, p. 679-692, 2012. Available from: <http://www.geneticsmr.com/articles/1557>. Accessed: Jun. 16, 2017. doi: 10.4238/2012.March.19.2.
SU, J.Y. et al. (2009) Detection of QTLs for phosphorus use
efficiency in relation to agronomic performance of wheat grown under phosphorus sufficient and limited conditions. Plant Science,
v. 176, n. 2009, p. 824–836, 2009. Available from: <https://www. sciencedirect.com/science/article/pii/S0168945209000922>. Accessed: Nov. 2, 2017. doi: 10.1016/j.plantsci.2009.03.006.
SUN, W. et al. Comparative transcriptomic profiling of a
salt-tolerant wild tomato species and a salt-sensitive tomato cultivar.
Plant and Cell Physiology, v. 51, n. 6, p. 997-1006, 2010. Available from: <https://academic.oup.com/pcp/article-lookup/doi/10.1093/ pcp/pcq056>. Accessed: Jun. 16, 2017. doi: 10.1093/pcp/pcq056. SUN, Y. et al. The wheat TaGBF1 gene is involved in the blue-light response and salt tolerance. The Plant Journal, v. 84, n. 6, p. 1219-1230, 2015. Available from: <http://onlinelibrary.wiley.com/doi/10.1111/ tpj.13082/epdf>. Accessed: Jun. 16, 2017. doi: 10.1111/tpj.13082.
TOUNSI, S. et al. Characterization of two HKT1;4 transporters from Triticum monococcum to elucidate the determinants of the wheat salt tolerance Nax1 QTL. Plant Cell and Physiology, v. 57, n. 10, p. 2047-2057, 2016. Available from: <https://academic.oup. com/pcp/article-abstract/57/10/2047/2755863/Characterization-of-Two-HKT1-4-Transporters-from>. Accessed: Jun. 16, 2017. doi: 10.1093/pcp/pcw123.
WU, Y.Q. et al. Mapping QTL for salt tolerant traits in wheat.
Journal of Nuclear Agricultural Sciences, v. 21, n. 6, p. 545-549, 2007. Available from: <http://en.cnki.com.cn/Article_en/ CJFDTOTAL-HNXB200706002.htm>. Accessed: Jun. 16, 2017. ZENG, Z.B. Precision mapping of quantitative trait loci. Genetics,
v. 136, n. 4, p. 1457–1468, 1994. Available from: <http://www. genetics.org/content/136/4/1457.long>. Accessed: Jun. 16, 2017. ZHU, J.K. Salt and drought stress signal transduction in plants.
Annual Review of Plant Biology, v. 53, n. 1, p. 247–273, 2002. Available from: <https://www.ncbi.nlm.nih.gov/pmc/articles/ PMC3128348/>. Accessed: Jun. 16, 2017. doi: 10.1146/annurev. arplant.53.091401.143329.
SAYED, H.I. Diversity of salt tolerance in a germplasm collection of wheat (Triticum spp.). Theoretical and Applied Genetics, v. 69, n. 5-6, p. 651–657, 1985. Available from: <https://link.springer. com/article/10.1007%2FBF00251118>. Accessed: Jun. 16, 2017. ZHU, T. et al. Ethylene and hydrogen peroxide are involved in brassinosteroid-induc -ed salt tolerance in tomato. Scientific