www.hydrol-earth-syst-sci.net/15/1979/2011/ doi:10.5194/hess-15-1979-2011
© Author(s) 2011. CC Attribution 3.0 License.
Hydrology and
Earth System
Sciences
Changes in land cover, rainfall and stream flow in Upper Gilgel
Abbay catchment, Blue Nile basin – Ethiopia
T. H. M. Rientjes1, A. T. Haile1, E. Kebede2, C. M. M. Mannaerts1, E. Habib3, and T. S. Steenhuis4
1Department of Water Resources Faculty of Geo-information Science and Earth Observation (ITC) University of Twente,
P.O. Box 6, 7500AA, Enschede, The Netherlands
2SNNPR Water Resources Development, Bureau Awassa, P.O. Box 925, Awassa, Ethiopia
3Department of Civil Engineering, University of Louisiana at Lafayette, Lafayette, LA 70504, USA 4Biological and Environmental Engineering, Cornell University, Ithaca, NY 14853, USA
Received: 10 August 2010 – Published in Hydrol. Earth Syst. Sci. Discuss.: 15 December 2010 Revised: 13 May 2011 – Accepted: 10 June 2011 – Published: 27 June 2011
Abstract. In this study we evaluated changes in land cover and rainfall in the Upper Gilgel Abbay catchment in the Up-per Blue Nile basin and how changes affected stream flow in terms of annual flow, high flows and low flows. Land cover change assessment was through classification analysis of remote sensing based land cover data while assessments on rainfall and stream flow data are by statistical analysis. Results of the supervised land cover classification analysis indicated that 50.9 % and 16.7 % of the catchment area was covered by forest in 1973 and 2001, respectively. This sig-nificant decrease in forest cover is mainly due to expansion of agricultural land.
By use of a change detection procedure, three periods were identified for which changes in rainfall and stream flow were analyzed. Rainfall was analyzed at monthly base by use of the Mann-Kendall test statistic and results indicated a statis-tically significant, decreasing trend for most months of the year. However, for the wet season months of June, July and August rainfall has increased. In the period 1973–2005, the annual flow of the catchment decreased by 12.1 %. Low flow and high flow at daily base were analyzed by a low flow and a high flow index that is based on a 95 % and 5 % exceedance probability. Results of the low flow index indicated decreases of 18.1 % and 66.6 % for the periods 1982–2000 and 2001– 2005 respectively. Results of high flows indicated an increase of 7.6 % and 46.6 % for the same periods. In this study it is concluded that over the period 1973–2005 stream flow has changed in the Gilgel Abbay catchment by changes in land cover and changes in rainfall.
Correspondence to: T. H. M. Rientjes ([email protected])
1 Introduction
Evaluating the effects of land cover changes on hydrolog-ical regimes has been a subject of ongoing research (see Bosch and Hewlett, 1982; Andr´eassian, 2004; Cosandey et al., 2005). Understanding these effects is of key importance since in many regions a rapid increase in population density often causes changes in land use and cover where forests and wetlands are converted to agricultural land. Studies by Be-wket and Sterk (2005) and Lørup et al. (1998) showed that land cover changes cause changes in hydrological regimes that affect the stream flow volume but also the pattern of stream flow and peak flows.
decrease in base flow while Wilk et al. (2001) were unable to detect any change in hydrological regimes despite a sig-nificant change in land cover by deforestation. This indicates that results of past studies are not consistent but clear reason-ing why differences occur is not trivial. While the catchment hydrologic behavior by itself is a function of climatic and topographic settings, soil properties and land cover types, it is unclear how changes in (one of) these settings affect the catchment hydrological behavior and related catchment re-sponses.
In this study, we analyzed changes in the land cover and rainfall and the hydrological regimes of the Upper Gilgel Ab-bay catchment with size of approximately 1656 km2. The catchment is located in the Lake Tana basin that is the source basin of the Blue Nile River. Gilgel Abbay is a densely popu-lated catchment and is part of the larger Amhara region with annual population growth of 2.67 % (ANRS, 2009). This growth has led to increased and intensified human activities that resulted in deforestation, overgrazing, land degradation and expansion of agricultural land. During various field vis-its in the period 2005–2010 we observed that water erosion is pronounced with deeply incised gullies (>25 m) in the area where forests were cleared. We also observed that deforesta-tion is a day-to-day activity of the people that use the wood for heating and cooking. The catchment is characterized by a rainfall regime with a pronounced dry and wet season with very high rainfall intensities (>20 mm h−1) and high vari-ability in space and time dimension (see Haile et al., 2009, 2010, 2011). During our field visits we observed that high rainfall intensity and Hortonian overland flow affected the sheet and rill erosion processes while saturation excess over-land flow was observed at overover-land flow source areas at the down side of hill slopes and in erosion gullies.
In literature only few efforts are reported on assessments on changes in land cover and rainfall in the Lake Tana basin and their effect on the hydrological regime. For studies in the Lake Tana basin we refer to Solomon et al. (2010) who focused on hydrologic impacts of deforestation in the Koga catchment that directly neighbors the Gilgel Abbay catch-ment and to Tesemma et al. (2010) who focused on trends in rainfall and runoff for selected areas in the Blue Nile. Part of the latter study focused on the Lake Tana basin area but establishing clear effects of land use changes was not pos-sible since hydrologic assessments focused on the outflow of Lake Tana instead of stream flows from catchments that drain to the lake. Moreover the authors suggest that from the onset of the construction of the Chara Chara weir in 1996, low flows and high flows are affected and thus flows not nec-essarily reflect the natural flow conditions (see Wale et al., 2009; Rientjes et al., 2011 for further discussion). We note that our work differs from Solomon et al. (2010) since we ap-ply supervised satellite based land cover classification for the Upper Gilgel Abbay catchment as compared to unsupervised classification to the Koga catchment that is much smaller. Also, we use daily observations of the hydro-meteorological
time series for our analysis instead of the monthly maximum and minimum in Solomon et al. (2010).
Recent studies with focus on the hydrology of the Gilgel Abbay catchment are reported by Abdo et al. (2009), Setegn et al. (2010) and Uhlenbrook et al. (2010). Abdo et al. (2009) showed that climate change may affect the hydrological regime of the Gilgel Abbay catchment with a lower rainfall amount prospected for the year 2080. In Setegn et al. (2010) attention is on uncertainty analysis of hydrological modeling by the Soil and Water Assessment Tool (SWAT) (Arnold et al., 1998) but issues of land cover change are ignored. In Uhlenbrook et al. (2010) attention is on hydrologic model-ing of Koga catchment and the Gilgel Abbay catchment that was partitioned in the Upper Gilgel Abbay that is gauged and the lower part that is ungauged. Modeling was by the “HBV light” approach (see Seibert, 2002) and focused on issues of model complexity, model transferability and simu-lating high flows and low flows. Further work in the Gilgel Abbay catchment is reported in Wale et al. (2009) and Rient-jes et al. (2011) who assessed the water balance closure term of Lake Tana by lake level simulation and application of a regional model for stream flow simulation from ungauged basins. Uhlenbrook et al. (2010) and Rientjes et al. (2011) paid much attention to the correction of hydro meteorolog-ical time series. For more extensive reviews on research in the Gilgel Abbay reference is made to the latter two works.
Objectives of this study are to evaluate how land cover of the Upper Gilgel Abbay has changed over the past 3 decades (1973–2001) and to evaluate how changes may have affected the hydrological regime. The work focuses on monthly time scales to identify trends and to evaluate possible long-term impacts but also focuses on high flow and low flow indices to evaluate if extremes in discharges are affected. The present study has large societal and economic relevance since the catchment is situated in the source basin of the Upper Blue Nile basin and since the relatively dense population largely depends on agricultural production.
2 Study area and data sources
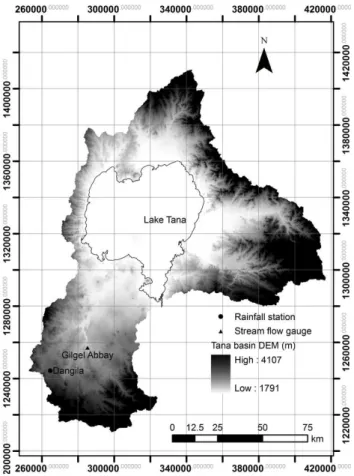
Gilgel Abbay is the largest contributor to the inflow of Lake Tana (see Rientjes et al., 2011) which is considered the source lake of the Upper Blue Nile River. The study area covers the upper part of the Gilgel Abbay catchment that is situated upstream of the gauging station at Wotet Abbay as shown in Fig. 1.
The Upper Gilgel Abbay is located between 10◦56′ to
Fig. 1. Lake Tana catchment.
season covers the period October to May. Haile et al. (2009) showed that the spatial distribution of rainfall amount has a decreasing trend from south to north.
The analysis on the changes of land cover is based on three remote sensing images that were acquired in 1973, 1986 and 2001. Details of the image characteristics and the remote sensing sensors are presented in Sect. 3.1. Stream flow data for the Upper Gilgel Abbay is made available by the Min-istry of Water Resources (MoWR) in Ethiopia. Data is on daily base and covers the period 1973–2005. Rainfall time series data from some 9 weather stations is made available by the National Meteorological Agency (NMA) in Ethiopia and series are analyzed for completeness for the same pe-riod. This resulted in the selection of time series of Dangila station which is located in the Upper Gilgel Abbay as indi-cated in Fig. 1. Further, stream flow and rainfall time series are screened and are corrected for unrealistic values. We note that, for instance, discharges as high as to 750 m3day−1were recorded. Consistency of the daily time series was analyzed by use of double mass curve analysis and by plotting the ratio of incremental differences of rainfall and stream flow (Fig. 2a). Outliers serve to identify and to correct for erro-neous runoff or rainfall data. After correction, the stream flow discharges are related to rainfall inputs (Fig. 2b) and
presumably constrains the uncertainty of results of the hy-drological impacts assessment. This particularly applies to the extreme values (high and low) that may affect results of trend analysis in this work. The corrected runoff time series are used in hydrological modeling in the Gilgel Abbay in Ri-entjes et al. (2011) and resulted in a Nash Sutcliffe efficiency of 0.85 when calibrating a modified version of the HBV-96 model (see Lindstr¨om et al., 1997) at daily base. We note that the stream flow gauge in the Gilgel Abbay catchment was relocated in 2005 but, to the knowledge of the authors, the rating curve has not been updated. Therefore in this study records after 2005 are not considered.
3 Methods
3.1 Image processing
Three orthorectified images of the Upper Gilgel Abbay were available by the National Aeronautics and Space Adminis-tration (NASA) and the Global Land cover Facility center (GLCF) (see http://glcf.umiacs.umd.edu/index.shtml). Ta-ble 1 shows the acquisition dates, sensor, path/row, resolu-tion and the providers of the images. The acquisiresolu-tion dates of the 1973, 1986 and 2001 images correspond to the dry season of the study area while the images have resolutions of 57 m for the year 1973 and 30 for the years 1986 and 2001. We note that more recent images with full coverage over the Gilgel Abbay are not available for the dry period (i.e. Jan-uary/February).
The Landsat multispectral scanner (MSS) bands 1, 2, 3, and 4 cover the spectral range between 0.45–1.10 µm. Both the Landsat thematic mapper (TM) and enhanced thematic mapper (ETM+) bands 1, 2, 3, 4, 5, and 7 cover the spec-tral ranges between 0.45–2.5 µm. Observations by bands 1–3 represent visible electromagnetic (EM) radiances at wave-lengths 0.45–0.52, 0.52–0.60, and 0.63–0.69 µm, respec-tively. Band 4 corresponds to the near infrared wavelengths at 0.76–0.90 µm while bands 5 and 7 correspond to the mid-infrared wavelengths at 1.55–1.75 and 2.08–2.35 µm, respec-tively. The land cover images were created using the band combination of 7, 4, 2 (Landsat TM and ETM+ images of 1986 and 2001) and 4, 2, 1 (Landsat MSS image of 1973) to allow visual interpretation of the image in their true color.
Δ Δ
(a)
Δ Δ
0 50 100 150 200 250 300 350 400 450
1-Jan-03 1-Feb-03 1-Mar-03 1-Apr-03 1-May-03 1-Jun-03 1-Jul-03 1-Aug-03 1-Sep-03 1-Oct-03 1-Nov-03
Time (days)
Q (
m
3
/s
)
0 5 10 15 20 25 30 35 40 45 50
P (
m
m)
Rainfall Q-Observed Q-Corrected (b)
Fig. 2. (a) Ratio of|1P|/1Qfor Upper Gilgel Abbay catchment (1994–2003). (b) Corrected outliers in Upper Gilgel Abbay catchment in the year 2003.
Table 1. The data sources for the analysis of land cover change.
Path/ Sensor Acquisition Resolution Provider Row date (m)
183/52 MSS1 1 Feb 1973 57 GLCF5 170/52 TM2 3 Jan 1986 30 GLCF5 170/53 ETM+3 5 Feb 2001 30 GLCF5 170/54 ETM+3 12 Sept 1999 30 GLCF5
SRTM4 2000 90 USGS6/GLCF5
1MSS = multi-spectral scanner;2TM = Thematic mapper;3ETM = Enhanced thematic
mapper;4= SRTM Shuttle radar topographic mission;5= GLCF Global Land cover
Facility;6= USGS United States geological Survey.
particular map projection. This allows the use of images that are acquired at different instants in time to represent different periods. For this study, the 1973 and 1986 images are regis-tered to the 2001 image through image to image registration with an RMSE of 0.34 pixel (19.38 m on the ground) for the 1973 image and 0.22 pixel (6.6 m on the ground) for the 1986 image. The RMSE of the registered images is acceptable since they are much less than the resolution of the images. Since images are observed at different moments in time, dif-ferent conditions can prevail in the atmosphere which affects the measured radiances. As such, the satellite images have
been corrected for atmospheric effects by applying the AT-COR package (see http://www.erdas.com/tabid/84/currentid/ 1072/default.aspx) which is embedded in the ERDAS Imag-ine software (see http://www.erdas.com/).
During our field campaign in 2008, 498 ground control points (GCP) were collected for image based land cover clas-sification where 80 % of the data points were used for train-ing, i.e. for classification, and 20 % were used for validation purposes. We selected locations of the GCP data by inter-viewing local elderly people and using a topographic map to identify locations for which land cover has not changed be-tween 2001 and 2008.
Based on the collected field data, 5 land cover classes have been identified for the Upper Gilgel Abbay catchment. The description of these land cover classes is as follows:
– Forest Land (F): area with high density of trees which include eucalyptus and coniferous trees.
– Agricultural land (AG): areas used for crop cultivation, and the scattered rural settlements.
– Shrubs land (SL): areas covered with shrubs, bushes and small trees with little wood mixed with some grasses. – Grass land (GL): area covered with grass that is used
– Water and marshy land (WM): area which remains water logged and swampy throughout the year, and rivers. 3.2 Image classification
For supervised classification, the ground control points col-lected in the field are used as a training sample set. The sam-ple set for the classification is created using the combination of bands 7, 4, 2 (for images of 1986 and 2001) and bands 4, 2, 1 (for the image of 1973) since these band combinations al-low visualization of the images in their true color. The maxi-mum likelihood classifier is selected since unlike other clas-sifiers it considers the spectral variation within each category and the overlap covering the different classes.
3.3 Land cover change detection
In this study, post classification comparison is used to quan-tify the extent of land cover changes over the 30 years period. The advantage of post classification comparison is that it by-passes the difficulties associated with the analysis of the im-ages that are acquired at different times of the year, or by dif-ferent sensors and results in high change detection accuracy (Alphan, 2003). The output of the post classification compar-ison is best described by a matrix diagram in which the land cover classes in the respective periods are shown across the rows and columns of the matrix. The output classes are as-signed according to the coincidence of any two input classes in the respective periods. If there is no change in the land cover in the respective time period, then values appear only in the diagonal of the matrix. Under such circumstances, the sum of the columns and rows are similar indicating no change in land cover.
3.4 Trends in rainfall and stream flow
Trend analysis of stream flow records is important to evalu-ate whether climatic factors and human interference signif-icantly affected the hydrological regimes of the catchment. Several approaches are proposed in literature to test the pres-ence of a trend in stream flow records. Following Kahya and Kalayci (2004), in this study we used the Mann-Kendall (MK) test that also is known as the Kendall’s tau statistic (see Burn and Hag Elnur, 2002; Zheng et al., 2007). MK is a non-parametric rank-based method that is widely used to test for randomness against trend in climatological time series (after Kahya and Kalayci, 2004). The test does not require assumptions about the statistical distribution of the data (i.e., data may be skewed) while measurements may be irregularly spaced in time. Since the method is rank based, extreme data points in the hydro-meteorological time series will not largely affect the results of the trend analysis.
The MK test after Mann (1945) and Kendall (1975) is ap-plied and serves to test the presence of a trend in the stream flow records of the Upper Gilgel Abbay. The test statistic (S) for the MK test reads:
S =
n−1 P
i=1 n P
j=i+1
sgn Yj −Yi
σs
(1)
With standard deviation:
σs = v u u u t
n(n−1) (2n+5) − n P
i=1
ti(i −1) (2i +5)
18 (2)
wherenis the number of data;Yj andYi are the data values
in two consecutive periods;ti is the number of ties, i.e. equal
values, of extentiandnis the number of tied groups. The function sgn(Yj−Yi) = 1 ifYj−Yi>0; sgn(Yj−Yi) = 0 if Yj−Yi= 0 and sgn(Yj−Yi)=−1 if Yj−Yi<0. The test
statisticSis asymptotically normal with zero mean and stan-dard deviationσs; as computed by Eq. (2) (after Hirsch and
Slack, 1984). For cases the sample sizenis larger than 10, the standard normal variatepis computed by using the fol-lowing equation (see Douglas et al., 2000)
p =
S−1
σs ifS > 0
0 ifS =0
S−1
σs ifS < 0
(3)
In a two-sided test for trend the null hypothesis of no trend should be accepted if|p| ≤pα/2at theα-level of significance
(hereα= 0.05). The test statistic (S) follows the standard normal distribution and therefore if the probability, under the null hypothesis, of observing a value as extreme (or more extreme) as the test statisticS > α= 0.05, then there is a sta-tistically significant trend. We note that a positive value ofS
indicates an “upward trend” and a negative value indicates a “downward trend” (see Partal and Kahya, 2006). Before ap-plying the MK test, time series data should be tested for auto-correlation. Simple tests in this work on the daily time series of rainfall as well as stream flow indicated that data only is weakly correlated. We note that the weak auto-correlation is supported by research findings in Haile et al. (2009, 2011) on rainfall diurnal cycle assessments and rainfall variability issues.
3.5 Stream flow change detection
Following Zheng et al. (2007), the moving average t-test is applied to identify the year at which changes in stream flow occurred. In this procedure, a time window of length 2N
(a)
(b)
(c)
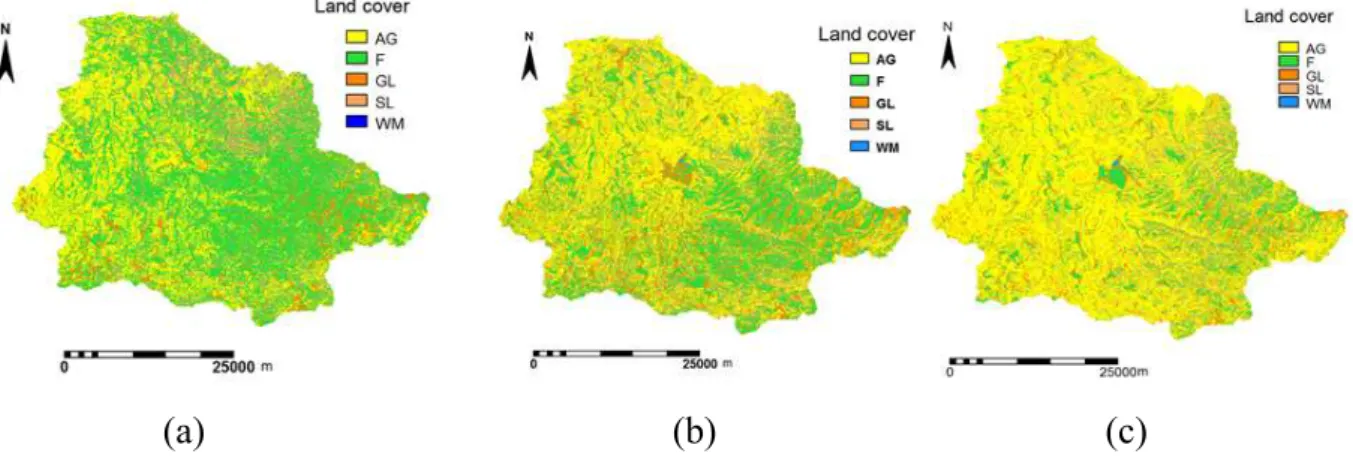
Fig. 3. Land cover of the Upper Gilgel Abbay catchment in 1973 (a), 1986 (b), 2001 (c) by Landsat satellites. AG stands for Agriculture, F
for Forest; GL for Grassland, SL for Shrub land, WM for Water and marshy land.
window at the potential change year. The test statistic of the t-test reads:
t = x1 −x2 sqN1
1 −
1 N2
(4)
and
s =
s
N1s12 +Nss22 N1 +N2 −2
(5) wherex1 andx2are the mean annual stream flow of theN
years before the potential change point and theN years af-ter the potential change point, respectively; N1andN2 are
the number of years in the first and second period;s1ands2
are the standard deviations; s is the pooled standard devia-tion. In this studyN1 andN2are equal. After identifying
the time periods that have a statistically significant differ-ence in mean annual flows, some indexes of the flow in each period are estimated. These statistics include a high flow index (Q5/Q50) and a low flow index (Q95/Q50), where Qk is the flow with probability of exceedance of k% of
the time. The exceedance probabilities are estimated apply-ing the widely used Weibull plottapply-ing position formula. This approach was selected since the Weibull formula relates to minima (i.e. smallest extreme values) as compared to Gum-bel and Fr´echet formula, for instance, that relate to maxima (i.e. largest extreme values).
4 Results
4.1 Land cover classification
Accuracy assessment
Results of the image classification are validated by creating an error (confusion) matrix from which different accuracy
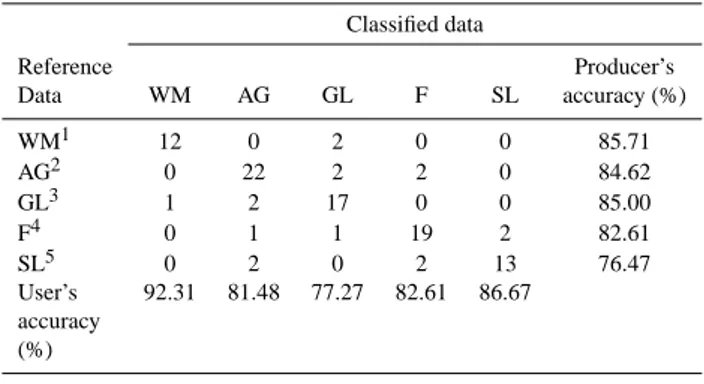
measures are derived. The confusion matrix is used to com-pare spatially coincident ground control points and pixels of the classified image. Table 2 shows a confusion matrix that is established using 100 ground control points (GCP) which are not used in the classification of the 2001 image.
From the confusion matrix four measures of accuracy are estimated that are the overall accuracy, user’s accuracy, pro-ducer’s accuracy, and the kappa statistic. The overall accu-racy is the number of correctly classified pixels (i.e., the sum of the diagonal cells in Table 2) divided by the total num-ber of GCP (i.e., reference data) used for validation. The overall accuracy in the present study is 83 %. The user ac-curacy in Table 2 is the probability that a certain class in the GCP is labeled also that class in the classification and refers to the columns of the table. The producer accuracy is the probability that a sampled pixel in an image falls in that par-ticular class in the GCP and refers to the rows. Producer’s accuracy values for all classes except WM ranged from 83 to 86 %. The kappa coefficient (k) of 0.78 of the maximum like-lihood classification represents a probable 78 percent better accuracy than if the classification would be based on random unsupervised classification. Monserud (1990) suggested a kappa value of<40 % as poor, 40–55 % fair, 55–70 % good, 70–85 % very good and>85 % as excellent. According to these ranges, the classification in this study has very good agreement with the validation data set.
Land cover classification maps of the study area are pro-duced for three reference years 1973, 1986 and 2001, see Fig. 3. The land cover types in the respective years are sum-marized in Table 3 which shows that most parts of the Upper Gilgel Abbay were covered by forest in 1973 and by agricul-tural land in 1986 and 2001.
4.2 Change detection of the land cover
Table 2. Confusion matrix for validation of land cover map 2001.
Classified data
Reference Producer’s
Data WM AG GL F SL accuracy (%)
WM1 12 0 2 0 0 85.71
AG2 0 22 2 2 0 84.62
GL3 1 2 17 0 0 85.00
F4 0 1 1 19 2 82.61
SL5 0 2 0 2 13 76.47
User’s 92.31 81.48 77.27 82.61 86.67 accuracy
(%)
Overall classification accuracy = 83 %; kappa statistic = 0.78
1WM = Water and marshy land; 2AG = Agricultural land; 3GL = Grass land;
4F = Forest;5SL = Shrubs
Table 3. Summary of land cover types in Upper Gilgel Abbay
catchment for 1973, 1986 and 2001.
Land cover 1973 1986 2001 types km2 % km2 % km2 % GL 65.7 4.0 215.9 13.0 146.5 8.8 SL 279.4 16.9 209.9 12.7 147.5 8.9 WM 0.1 0.0 20.5 1.2 45.8 2.8 F 843.8 50.9 544.2 32.9 277.4 16.7 AG 467.2 28.2 665.6 40.2 1038.9 62.7
respectively. In both tables, the areas of the land cover classes that did not change appear along the diagonal of the matrix. The change detection analysis indicates that a signif-icant change in land cover occurred in both periods.
The first row of Table 4 shows that the total area covered by grass land (GL) is 67 km2in 1973. It is shown that 6 km2, 5 km2, 5 km2and 10 km2of the GL has changed to shrubs, water and marshy, forest and agricultural lands respectively during the period 1973–1986. Also, 267 km2, 68 km2 and 95 km2of forest land were converted into agricultural land, shrub land and grass land respectively. On the other hand, 5 km2of grass land, 60 km2shrubs land and 66 km2of culture land were reforested. Between 1973 and 1986, agri-cultural land in Upper Gilgel Abbay was expanded by almost 197 km2while forest land was decreased by 299 km2.
Results in Table 5 on the period 1986–2001 indicate that 30 km2, 23 km2, 2 km2and 299 km2of forest land were con-verted to grass land, shrubs land, water and marshy land, and agricultural land, respectively. In contrast, 27 km2grass land, 16 km2shrubs land, and 43 km2agricultural land were con-verted to forest land.
Results in Table 3 suggest larger conversion of grass land and forest to agricultural land in 1986–2001 as compared to
Table 4. Land cover (LC) conversion matrix (km2) for the period 1973 and 1986.
Land cover GL SL WM F AG 1973
types
GL 41 6 5 5 10 67
SL 13 83 5 60 118 279
WM 0 0.1 0 0 0 0.1
F 95 68 0 414 267 844
AG 67 54 10 66 271 468
1986 216 210 20 545 665 1656
Table 5. Land cover (LC) conversion matrix (km2) for the period 1986 and 2001.
Land cover GL SL WM F AG 1986
types
GL 61 6 23 27 99 216
SL 18 76 0 16 100 210
WM 10 0 9 0 1 20
F 30 23 2 192 299 546
AG 29 43 11 43 538 664
2001 148 148 45 278 1037 1656
1973–1986 suggesting acceleration of land cover changes. For the periods that cover time spans of 6 years and 13 years respectively, agricultural land increased by some 373 and 198 km2 while forest land decreased by some 267 and 299 km2.
4.3 Trend detection in rainfall and stream flow
Table 6. The Mann-Kendall test statistic (S) for trend analysis for annual and monthly stream flow and rainfall in the Upper Gilgel Abbay catchment. Note the p-values are shown between brackets while statistically significant trends (p-value>0.05) are highlighted in gray.
Period Upper Gilgel Abbay Dangila (Stream flow) (Rainfall)
Annual −0.99 (0.321) −0.87 (0.382) January −5.18 (0.000) −1.58 (0.115) February −5.52 (0.000) +0.07 (0.944) March −5.14 (0.000) −0.63 (0.528) April −2.67 (0.008) −0.18 (0.861) May −0.28 (0.780) −0.25 (0.801) June +1.64 (0.101) +1.05 (0.101) July −0.50 (0.620) −0.42 (0.670) August −2.42 (0.016) −1.44 (0.151) September −2.73 (0.006) −0.28 (0.779) October 0.000 (−0.988) −0.39 (0.699) November −1.53 (0.125) +0.67 (0.505) December −3.38 (0.011) −1.08 (0.277)
a negative trend is observed for the wettest months (July and August) and towards the end of the rainy season (September and October).
Results of the MK test for stream flow are also shown in Table 6. Analysis on annual stream flow of the Upper Gilgel Abbay shows a negative trend that is statistically significant. An analysis on monthly stream flow indicates a negative, downward trend for most months of the year but test statis-tics are not always significant. This particularly applies to the low flows in the dry season (December–April). A neg-ative but statistically insignificant trend is also observed in August and September that cover the second half of the wet season. At the beginning of the dry season in October no trend is indicated while for November a negative trend is in-dicated. For both months the indicated trend is statistically significant.
Negative or downward trends that statistically are signifi-cant are observed in the wet season in May (start of wet sea-son) and July (wet seasea-son). Only in June a positive or “up-ward” trend is shown that is statistically significant. When comparing the statistically significant trends for rainfall and stream flow, we note that similar upward or downward trend directions of rainfall and stream flow are shown in May–July. 4.4 Change detection for stream flow
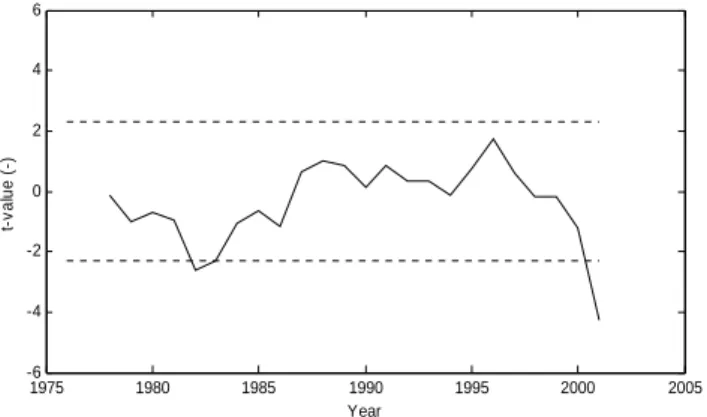
Figure 4 shows the estimated t-values and the critical t-values for the stream flow of the Gilgel Abbay catchment which is represented by the solid line and the broken lines, respec-tively. For selection of the window size a simple sensitiv-ity analysis has been performed but results indicated that the
1975 1980 1985 1990 1995 2000 2005 -6
-4 -2 0 2 4 6
Year
t-v
a
lu
e
(-)
Fig. 4. Results of change-point detection for the annual flow of
Up-per Gilgel Abbay catchment using the moving t-test method (1973– 2001). Note: the solid line represents the estimated t-values while the broken lines indicate the critical t-value forα= 0.05.
change point (year) of the stream flow is quite insensitive to the window size. As such we applied a window size of 2N= 10. Further, a significance level of α= 0.05 was se-lected for which the absolute value of the critical t-value is
tα= 2.3. As such, a change is considered to occur in a
partic-ular year when the absolute value of the estimated t-value in Eq. (4) exceeds the value 2.3.
The figure shows that for the years 1982 and 2001 the esti-mated t-values are lower than the critical t-values which indi-cate the moment (or period) in time at which the mean of the annual stream flow has changed. Analysis on changes of an-nual stream flow records suggested that three periods, 1973– 1981, 1982–2000, 2001–2005, could be identified for which changes are observed. For each of these periods a satellite image on the land cover was available. We note that the rain-fall time series of Dangila station covered a much smaller period and therefore only 2 periods (1988–2000 and 2001– 2005) could be identified. These periods (party) cover the period of the stream flow analysis.
Table 7 shows some features of the annual stream flow of Upper Gilgel Abbay catchment. The three time periods in the table are identified based on the results of the mov-ing average t-test. In the analysis, results from the second period are compared to results from the first period while sults from the third period are subsequently compared to re-sults from the second period. Overall, the mean annual flow of Gilgel Abbay has substantially decreased over the period 1973–2005 with a decrease of 5.3 % during the second period and a further decrease by 12.7 % in the third period. We note that results of the MK test indicate that the decrease of the annual flow is followed a downward trend that is statistically significant. Contrary to the decrease of the annual flows, the high flow index (Q5/Q50) of the Gilgel Abbay catchment
Table 7. Stream flow characteristics of Upper Gilgel Abbay
catch-ment.
Time period 1973–1981 1982–2000 2001–2005
Annual flow (mm yr−1) 1085 1027 896 High flow index,Q5/Q50, (−) 18.58 20.00 29.27 Low flow index,Q95/Q50, (−) 0.22 0.18 0.12
third period. Obviously high flows apply to the wet season. Contrary to this increase, results of the MK tests on rainfall data in the wet season (Table 6) indicate that rainfall has sig-nificantly decreased over the past decades and thus high flow discharges are expected to reduce. Results of the low flow in-dex (Q95/Q50) show a decrease by 18.1 % for the first period
and an additional 66.6 % for the third period. This suggests that the probability that aQ95low flow will be exceeded has
decreased and thus indicates that low flow discharges in gen-eral have decreased.
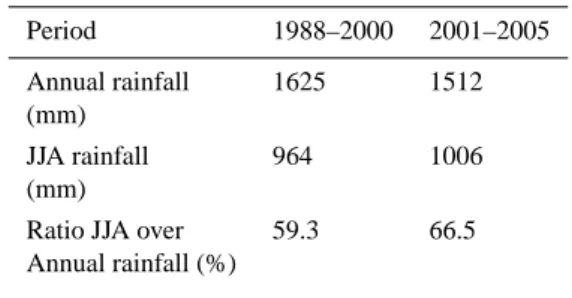
Table 8 shows the rainfall amounts at Dangila during the last two time periods for which changes in stream flows are detected. The annual rainfall of Dangila, which is situated in Gilgel Abbay catchment, decreased over the two time peri-ods suggesting that the decrease in the flow of Upper Gilgel Abbay catchment can be partly explained by a decrease in rainfall amount. However, the JJA rainfall and the ratio of JJA to annual rainfall of Dangila slightly increased over the time periods. This is in agreement with the increase in the high flow index which shows that high flows of Upper Gilgel Abbay increased.
5 Discussion and conclusion
For the Upper Gilgel Abbay catchment for the period 1973– 2001 changes of land cover and rainfall and their effect on the hydrological regime were analyzed. For assessing the changes in land cover we used three remote sensing images that were acquired in the dry season month of February for the years 1973, 1986, 2001. An accuracy assessment by use of a confusion matrix for the supervised land cover classifica-tion indicates that the classificaclassifica-tion results are reliable. Land cover changes in the study area are assessed by post clas-sification comparison were results showed that forest land decreased from 50.9 % in 1973 to 32.9 % in 1986. Agri-cultural land increased from 28.2 % in 1973 to 40.2 % in 1986. In the time period 1986–2001 forest land decreased from 32.9 % to 16.7 % while agricultural land increased from 40.2 % to 62.7 %. This indicates that the rate of deforestation is slightly smaller in the second time period as compared to the first period and probably is due to reforestation activities in the catchment. The extent of deforestation, however, is still much larger than the extent of reforestation. The expan-sion of agricultural land in the period 1986–2001 is larger
Table 8. Rainfall depths of Dangila stations for the period the
changes in stream flow are observed.
Period 1988–2000 2001–2005
Annual rainfall 1625 1512 (mm)
JJA rainfall 964 1006
(mm)
Ratio JJA over 59.3 66.5
Annual rainfall (%)
than in the previous time period suggesting that the demand for agricultural lands has increased.
To evaluate if changes of rainfall during the period 1973– 2005 possibly could have affected stream flow we performed Mann-Kendall trend analysis on daily rainfall for Dangila station that is located in the catchment. We showed that rain-fall in general has decreased following a negative trend that is statistically significant. Only for the wet month of June and the months of February and November, that both are in the dry season, a positive trend is indicated suggesting that rainfall has increased. Comparing mean annual rainfall for the periods 1988–2000 and 2001–2005 revealed that annual rainfall has decreased by 6.9 % but the wet season rainfall has increased by 4.3 % indicating that the seasonal rainfall distribution has changed.
Results of a change detection analysis on annual stream showed that three periods (1973–1981, 1982–2000, 2001– 2005) can be identified for which changes occurred. Mann-Kendall test results for stream flow at monthly base indicate that flows in general have a negative trend but trends are not statistically significant for all months. Only for the month of June an upward trend is indicated that is statistically signif-icant. We showed that the annual stream flow of the Upper Gilgel Abbay experienced a decreasing trend over the 32 year time period where the rate of decrease is higher in the third period (12.7 %) than in the second period (5.3 %). For ana-lyzing if changes in low flows and high flows occurred for the same three time periods we used a low flow and a high flow index as indicator that is based on daily stream flow records. Results of the low flow index show a decrease by 18.1 % for the first period and an additional 66.6 % for the third period. Results of the high flow index show a 7.6 % increase during the second period and an additional 46.6 % increase during the third period.
from agricultural areas and in general more rainwater is stored in the subsurface of forested areas. As a consequence of deforestation and land degradation processes soil perme-ability often decreases and causes that infiltration rates and recharge fluxes decrease. Therefore by deforestation less amounts of rainwater are stored in the unsaturated zone dur-ing periods of rain. This consequently results in quicker runoff responses were flow rates increase and we presume that this partly causes the increase of the high flow index in the Upper Gilgel Abbay. As stated in the Introduction sec-tion, water erosion processes have frequently been observed in agricultural areas during field visits over the past 6 years. We note that lower water storage causes that less soil water is available for evapotranspiration processes during inter-event periods and dry periods and therefore causes that the unsat-urated zone may deplete quicker. Reduced water storage, however, also causes recharge fluxes to decrease and conse-quently result in lower base flows. This is particularly ob-servable during the dry season as indicated by the low flow index in the Upper Gilgel Abbay. We note that effects of evapotranspiration processes are somewhat uncertain in this study. In the Gilgel Abbay reforestation mostly has been by eucalypt trees that commonly cause higher actual evapotran-spiration than agricultural land as partly caused by larger un-saturated zone storage and larger plant transpiration. There-fore reThere-forested areas cause larger actual evapotranspiration losses as compared to agricultural land with often less wa-ter storage volumes available to generate catchment runoff. This particularly is observable during the dry season when stream flow is by base flow processes. For accurate assess-ments on evapotranspiration fluxes a remote sensing based approach could be applied where the energy balance is solved (see Muthuwatta et al., 2010).
The increase of the wet season rainfall may result in a higher high flow index value. During periods of excessive rainfall, high flow discharges increase when rainwater is not stored by infiltration and percolation processes in the un-saturated zone. Increases of high flow discharges are ex-pected in areas where agricultural land has largely increased by deforestation and in case of land degradation (e.g. Mati et al., 2008; Costa et al., 2003). The decrease of low flows in this work is also described in Kashaigili (2008) and Be-wket and Sterk (2005) but is not described in Zhang and Schilling (2006) and Siriwardena et al. (2006). We note that research findings may differ because of the selected method-ology and the specific catchment settings that may differ. For instance, conclusions in Siriwardena er al. (2006) are largely based on a number of modeling results but quite dif-ferent results were obtained when applying difdif-ferent mod-els. Also we note that rainfall did not change to the extent as in our study. The work of Bewket and Sterk (2005) in the Chemoga catchment in Ethiopia resembles our approach were land cover changes are assessed by a remote sensing approach and times series data that is analyzed. Conclusions on changes in stream flows are similar to conclusions in this
study were changes in stream in both studies are affected by changes in rainfall as well.
We note that different climatic and catchment characteris-tics do not allow direct comparison of our results to results from other regions and therefore our results do not allow generalization. We recommend that future work must ap-ply distributed hydrologic models with a physical basis to allow better evaluation of effects of land cover changes and rainfall distributions on the hydrologic regime. Also changes in actual evapotranspiration must be assesses as caused by changes in land cover. Therefore we recommend the use of a remote sensing based approach that solves the energy balance in a spatially distributed fashion to account for the different land covers. We note that both the rainfall-runoff modeling and the energy balance modeling are are scheduled for future work.
Acknowledgements. The two anonymous reviewers are gratefully
acknowledged for their valuable comments on our manuscript. We also acknowledge the Ethiopian Meteorological Agency and the Ethiopian Ministry of Water Resources for their support by supplying the time series data for rainfall and stream flow. This study was financially supported by the Netherlands Fellowship Programme (NFP).
Edited by: S. Uhlenbrook
References
Abdo, K. S., Fiseha, B. M., Rientjes, T. H. M., Gieske, A. S. M., and Haile, A. T.: Assessment of climate change impacts on the hy-drology of Gilgel Abbay catchment in Lake Tana basin, Ethiopia, Hydrol. Process., 23(26), 3661–3669, 2009.
Alphan, H.: Land-use change and urbanization of Adana, Turkey, Land Degrad. Dev., 14, 575, 2003.
Andr´eassian, V.: Waters and forests: from historical controversy to scientific debate, J. Hydrol., 291, 1–27, 2004.
ANRS – Amhara National Regional State: Bureau of Finance and Economic Development, Annual Statistical Bulletin, January, 2009.
Arnold, J. G., Srinivasan, R., Muttiah, R. S., and Williams, J. R.: Large area hydrologic modeling and assessment, Part 1: Model development, J. Am. Water Res. Assoc., 34(1), 73–89, 1998. Bewket, W. and Sterk, G.: Dynamics in land cover and its
ef-fect on stream flow in the Chemoga watershed, Blue Nile basin, Ethiopia, Hydrol. Process., 19, 445–458, 2005.
Bosch, J. M. and Hewlett, D.: A review of catchment experiments to determine the effects of vegetation changes on water yield and evapotraspiration, J. Hydrol., 170, 123–135, 1982.
Burn, D. H. and Hag Elnur, M. A.: Detection of hydrological trends and variability, J. Hydrol., 255, 107–122, 2002.
Cosandey, C., Andr´eassian, V., Martin, C., Didon-Lescot, J. F., Lavabre, J., Folton, N., Mathys, N., and Richard, D.: The hydro-logical impact of the Mediterranean forest: a review of French research, J. Hydrol., 301, 235–249, 2005.
Douglas, E. M., Vogel, R. M., and Kroll, C. N.: Trends in floods and low flows in the United States: impact of spatial correlation, J. Hydrol., 240, 90–105, 2000.
Guillemette, F., Plamondon, A. P., Pr´evost, M., and L´evesque, D.: Rainfall generated stormflow response to clearcutting a boreal forest: peak flow comparison with 50 world-wide basin studies, J. Hydrol., 302, 137–153, 2005.
Haile, A. T., Rientjes, T., Gieske, M., and Gebremichael, M.: Rain-fall Variability over mountainous and adjacent lake areas: the case of Lake Tana basin at the source of the Blue Nile River, J. Appl. Meteor. Climatol., 48, 1696–1717, 2009.
Haile, A. T., Rientjes, T. H. M., Gieske, A., Gebremichael, M.: Rainfall estimation at the source of the Blue Nile: A multispec-tral remote sensing approach. Int. J. Appl. Earth. Obs. Geoinf. JAG, 12(Supplement 1), S76–S82, 2010.
Haile, A. T., Rientjes, T. H. M., Habib, E., Jetten, V., and Ge-bremichael, M.: Rain event properties at the source of the Blue Nile River, Hydrol. Earth Syst. Sci., 15, 1023–1034, doi:10.5194/hess-15-1023-2011, 2011.
Hirsch, R. M. and Slack, J. R.: A non-parametric trend test for sea-sonal data with serial dependence, Water Resour. Res., 20(6), 727–732, 1984.
Iroum´e, A., Huber, A., and Schulz, K.: Summer flows in experi-mental catchments with different forest covers, Chile, J. Hydrol., 300, 300–313, 2005.
Kahya, E. and Kalayci, S.: Trend analysis of streamflow in Turkey, J. Hydrol., 289, 128–144, 2004.
Kashaigili, J. J.: Impacts of land-use and land-cover changes on flow regimes of the Usangu wetland and the Great Ruaha River, Tanzania, Phys. Chem. Earth, 33(8–13), 640–647, 2008. Kendall, M. G.: Rank Correlation Methods, Charles Griffin,
Lon-don, 1975.
Lavabre, J., Sempere Torress, D., and Cernesson, F.: Changes in the hydrological response of a small Meditrranean basin in a year after a wildfire, J. Hydrol., 142, 273–299, 1993.
Lindstr¨om, G., Johansson, B., Persson, M., Gardelin, M., and Bergstr¨om, S.: Development and test of the distributed HBV-96 hydrological model, J. Hydrol., 201, 272–288, 1997.
Lørup, J. K., Refsgaard, J. C., and Mazvimavi, D.: Assessing the effects of land use change on catchment runoff by combined use of statistical tests and hydrological modelling: Case studies from Zimbabwe, J. Hydrol., 205, 147–163, 1998.
Mann, H. B.: Nonparametric tests against trend, Econometrica, 13, 245–259, 1945.
Mati, B. M., Mutie, S., Gadain, H., Hame, P., and Mtalo, F.: Impacts of land-use/cover changes on the hydrology of the transbound-ary Mara River, Kenya/Tanzania, Lakes Reserv. Res. Manage., 13(2), 169–177, 2008.
Monserud, R. A.: Methods for comparing global vegetation maps, Report WP-90-40, IIASA, Laxenburg, 1990.
Muthuwatta, L. P., Ahmad, M. D., Bos, M. G., and Rientjes, T. H. M.: Assessment of water availability and consump-tion in the Karkheh River Basin (Iran) using remote sens-ing and geo-statistics, Water Resour. Manage., 24, 459–484, doi:10.1007/s11269-009-9455-9, 2010.
Partal, T. and Kalya, E.: Trend analysis in Turkish precipitation data, Hydrol. Process., 20, 2011–2026, doi:10.1002/hyp.5993, 2006.
Rientjes, T. H. M., Perera, B. U. J., Haile, A. T., Reggiani, P., and Muthuwatta, L. P.: Regionalisation for lake level simulation -the case of Lake Tana in -the Upper Blue Nile, Ethiopia, Hy-drol. Earth Syst. Sci., 15, 1167–1183, doi:10.5194/hess-15-1167-2011, 2011.
Seibert, J.: HBV light users manual, Uppsala University, 2002. Siriwardena, L., Finlayson, B. L., and McMahon, T. A.: The impact
of landuse change on catchment hydrology in large catchments: The Comet River, Central Queensland, Australia, J. Hydrol., 326, 199–214, 2006.
Setegn, S. G., Srinivasan, R., Melesse, A. M., and Dargahi, B.: SWAT model application and prediction uncertainty analysis in the Lake Tana Basin, Ethiopia, Hydrol. Process., 24, 357–367, 2010.
Solomon, G. G., Taye, A., and Bishop, K.: Forest Cover and Stream Flow in a Headwater of the Blue Nile: Complementing Observa-tional Data Analysis with Community Perception, Ambio, 39, 284–294, doi:10.1007/s13280-010-0047-y, 2010.
Tesemma, Z. K., Yasir, A. M., and Steenhuis, T. S.: Trends in rain-fall and runoff in the Blue Nile Basin: 1964–2003, Hydrol. Pro-cess., 24, 3747–3758, doi:10.1002/hyp.7893, 2010.
Troendle, C. A. and King, R. M.: The effect of partial and clearcut-ting on stream flow at Deadhorse Creek, Colorado, J. Hydrol., 90, 145–157, 1987.
Uhlenbrook, S., Mohamed, Y., and Gragne, A. S.: Analyzing catch-ment behavior through catchcatch-ment modeling in the Gilgel Abay, Upper Blue Nile River Basin, Ethiopia, Hydrol. Earth Syst. Sci., 14, 2153–2165, doi:10.5194/hess-14-2153-2010, 2010. Wale, A., Rientjes, T. H. M., Gieske, A. S. M., and Getachew, H. A.:
Ungauged catchment contributions to Lake Tana’s water balance, Hydrol. Process., 23(26), 3682–3693, 2009.
Wilk, K., Andersson, L., and Plermkamon, V.: Hydrological im-pacts of forest conversion to agriculture in a large river basin in northeast Thailand, Hydrol. Process., 15, 2729–2748, 2001. Zhang, Y. K. and Schilling, K. E.: Increasing streamflow and
base-flow in Mississippi River since the 1940’s: Effect of land use change, J. Hydrol., 324, 412–422, 2006.