ASSESSING THE IMPACTS OF LAND USE AND LAND
COVER CHANGE ON HYDROLOGY OF WATERSHED:
A Case study on Gilgel
–
Abbay Watershed, Lake Tana
Basin, Ethiopia
ii Dissertation supervised by
Professor Pedro Cabral, Ph.D
Dissertation co - supervised by
Professor Jorge Mateu, Ph.D
Professor Edzer Pebesma, Ph.D
February 2013
ASSESSING THE IMPACTS OF LAND USE AND LAND
COVER CHANGE ON HYDROLOGY OF WATERSHED:
A Case study on Gilgel
–
Abbay Watershed, Lake Tana
iii
ACKNOWLEDGMENTS
Above all I thank the almighty of GOD for his guidance and grace upon me during all my works and in all my life.
I would like to express my sincere gratitude to EU-Erasmus Mundus Scholarship program for the financial support that covers all my expenses during my studies in the consortium universities. Thank you to Prof. Dr. Marco Painho, Prof. Dr. Werner Kuhn, Dr. Christoph Brox, Prof. Dr. Joaquín Huerta and all the staff members in the three universities I have attended.
Very special thanks to my supervisor Prof. Dr. Pedro Cabral for his valuable guidance, encouragement, suggestions and constructive comments from the inception to the completion of this research work. I am deeply grateful to my co-supervisors Prof. Dr. Jorge Mateu, and Prof. Dr. Edzer Pebesma for their comments and correction throughout this work. I would like to express my appreciation to Prof. Dr. Marco Painho, for his follow up, encouragement and fruitful comments to the end of this work. My sincere gratitude goes to Mr. Ayanaw Malede from the Water Works Design and Supervision Enterprise (WWDSE) who provided me most of the data needed and his unreserved effort during the SWAT model setup is highly appreciable.
I would also thank the Ethiopian National Meteorology Agency and Ministry of Energy and Water Resources for their help by providing me Meteorological and hydrological data to conduct this study without which this research was not possible.
I would like to thank my families especially my mother W/o Etaleme Ayalew, my father Ato Adamu Geremew, my grandmother W/o Selenate Gembera and my grandfather Mergata Yerom mitiku for their support and pray during my stay abroad and also my brother Yirga Yerom for taking care of me, support and encouraged me throughout the course of my study.
Last, but not indeed least, I would like to forward the largest thanks to my helpful friend Frehiwot Zewdu for her never ending concern, support and encouragement.
iv
ABSTRACT
The population growth for the last 16 years caused changes in land cover of the Gilgel Abbay watershed, Lake Tana basin, Ethiopia. The effects of the land cover changes have impacted on the stream flow of the watershed by changing the magnitude of surface runoff and ground water flow. This study is mainly focusing on the assessment of the impacts of the land cover changes on the stream flow by changing SURQ and GWQ for the wet months (June, July, August) and dry months (January, February, March) through satellite Remote Sensing (RS) and Geographic Information System (GIS) integrated with the SWAT model. ArcGIS used to generate land use and cover maps from Landsat TM and ETM+ acquired, respectively, in 1986 and 2001. The land cover maps were generated using the Maximum Likelihood Algorithm of Supervised Classification. The accuracy of the classified maps was assessed using Confusion Metrics. The result of this analysis showed that the cultivated land has expanded during the study period of 1986-2001. Using the two generated land cover maps, two SWAT models set up were run to evaluate the impacts the land use and cover changes on the stream flow of the study watershed. The performance of the SWAT model was evaluated through sensitivity analysis, calibration, and validation. Ten flow parameters were identified to be sensitive for the stream flow of the study area and used for model calibration. The model calibration was carried out using observed stream flow data from 01 January 1987 to 31 December 1994 and a validation period from 01 January 1995 to 31 December 2001. Both the calibration and validation results showed good match between measured and simulated stream flow data with the coefficient of determination (R2) of 0.93 and Nash-Sutcliffe efficiency (ENS) of 0.95 for the
calibration, and R2 of 0.91 and ENS of 0.90 of the validation period. The result of this analysis indicated that the mean monthly stream flow increased by 16.26m3/s for the wet months while for the dry months decreased by 5.41 m3/s. Generally, the analysis indicated that flow during the wet months has increased, while the flow during the dry months decreased. The SURQ increased, while GWQ decreased from 1986 to 2001 due to the increment of cultivated lands. The model results showed that the stream flow characteristics changed due to the land cover changes during the study period.
ASSESSING THE IMPACTS OF LAND USE AND LAND
COVER CHANGE ON HYDROLOGY OF WATERSHED:
A Case study on Gilgel
–
Abbay Watershed, Lake Tana
v
KEYWORDS
Geographic Information system (GIS)
Gilgel Abbay Watershed
Land use and cover change
Remote sensing
Soil and Water Assessment Tool (SWAT)
vi
ACRONYMS
ANRS – Amhara National Regional State CSA – Central statistical Agency
DEM – Digital Elevation Model ENS – Nash-Sutcliffe Efficiency
ETM+ – Enhanced Thematic Mapper Plus GIS – Geographical Information System GWQ – Ground Water Flow
HBV – Hydrologisika Bayraans Vattenbalans-avediling
HEC-HMS – Hydraulic Engineering Centre-Hydrologic Modeling System HRU – Hydrological Response Unit
IGBP-IHDP – International Geosphere-Biosphere Program and the International Human Dimension Program
LULCC – Land Use and Land Cover Change MoA – Ministry of Agriculture
MoEWR – Ministry of Energy and Water Resources MRS – Mean Relative Sensitivity
R2 – Coefficient of Determination RS – Remote Sensing
SURQ – Surface runoff
SWAT – Soil and Water Assessment Tool TM – Thematic Mapper
USDA-ARS – United States Department of Agriculture-Agricultural Research Service
WXGEN – Weather Generator
vii
TABLE OF CONTENTS
ACKNOWLEDGMENTS………..………...iii
ABSTRACT………iv
KEYWORDS………...……v
ACRONYMS………...…………...vi
TABLE OF CONTENTS………..………...vii
INDEX OF TABLES………...………..ix INDEX OF FIGURES………..………..x
1. INTRODUCTION………..1
1.1. Study background……….……….…1
1.2. Statement of the problem………...……….….2
1.3. Objective of the study………..………….……….……….…...2
1.4. Research questions……….………..………..……3
1.5. Significance of the study………..……….…..…...3
1.6. Softwares and materials used………..………..….………3
1.7. Organization of the thesis………..…..…………..4
2. LITERATURE REVIEW………..5
2.1. Land use and land cover change: Definitions and Concept….………..5
2.2. Land use and land cover change in Ethiopia………...………..6
2.3. Application of Remote Sensing on LULCC………...…….…8
2.4. Hydrological Models………...….……….8
2.4.1. Introduction to SWAT Model………....10
2.4.1.1. SWAT Application Worldwide………...11
2.4.1.2. SWAT Model Application in Ethiopia………..12
3. MATERIALS AND METHODS……….13
3.1. Description of the Study Area……….….………....13
3.1.1. Location……….………..………..…...13
3.1.2. Climate………..………...………...……....15
3.1.3. Soil type, Geology and land cover ……...………....…..18
3.1.4. Population………...……….18
3.1.5. Agriculture………...……….…..19
viii
3.2.1. Description of SWAT Model……….….21
3.2.1.1. Surface runoff………...…………...22
3.2.1.2. Potential evapotranspiration………...………23
3.2.1.3. Ground water flow………...24
3.2.1.4. Flow routing phase………...24
3.3. Methodology……….……….……...26
3.3.1. Data acquisition………...………...……27
3.3.2. Image processing………...……...………27
3.3.3. Land cover mapping …...28
3.3.3.1. Land cover class………..……….….28
3.3.3.2. Image classification……….……….………...29
3.3.3.3. Accuracy assessment……….….………..….30
3.4. Model Input Data Collection and Analysis………….……….30
3.4.1. Digital Elevation Model (DEM)………...…...………...30
3.4.2. Weather Data………...…...31
3.4.3. Soil Data………...………...……..…….33
3.4.4. Land Cover Map……….………...………...………….34
3.4.5. Hydrological Data………...…………..…..35
3.5. Model Setup………....………..35
3.5.1. Watershed Delineation………..…..35
3.5.2. Hydrological Response Unit Analysis……...……..37
3.5.3. Weather Generator………...…………..…...…..38
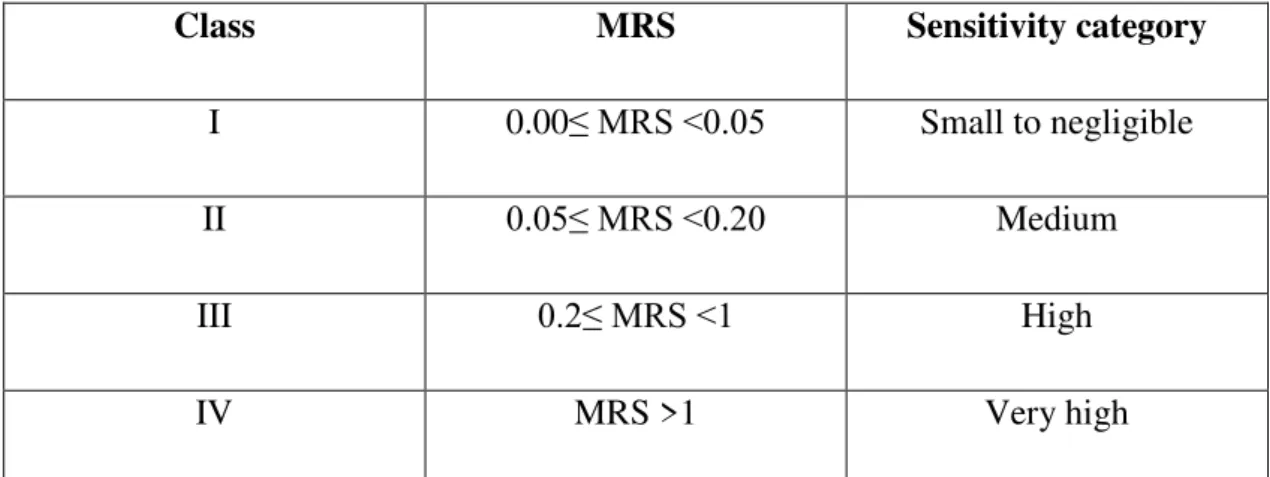
3.5.4. Sensitivity Analysis………...………….……...….39 3.5.5. Model Calibration and Validation…………...………...…...….40
3.6. Model Performance Evaluation……….………..….41
3.7. Evaluation of Stream Flow due to LULCC……….….….………...42
4. RESULTS AND DISCUSSION………...43
4.1. Land Use and Land Cover Analysis………...……….43
4.1.1. Accuracy Assessment………...……...…….43
4.1.2. Land use and land cover maps………...…...45
4.2. Stream Flow Modeling……….……….…..47
4.2.1. Sensitivity Analysis………....……...…47
4.2.2. Calibration and Validation of Stream Flow Simulation………...………...…49 4.3. Evaluation of Stream Flow due to Land Use and Land Cover Change…...………...…………....….54
4.3.1. Change in the seasonal stream flows………..…...….54
5. CONCLUSIONS AND RECOMMENDATIONS………...………...57
5.1. Conclusions………..57
ix
BIBLOGRAPHIC REFERENCES………..………..60
APPENDICES………...66
Appendix 1………..66
Appendix 2………..67
Appendix 3………..68
x
INDEX OF TABLES
Table 1. Description of three selected semi-distributed hydrological models………10
Table 2. Population Size of Ethiopia (in millions) 1984-2007…………..………….19
Table 3. The acquisition dates, sensor, path/row, resolution and the producer’s of the images………...…...27
Table 4. Meteorological station names, locations and variables…………..……...32
Table 5. Table 4. Soil types of Gilgel Abbay watershed with their symbols and areal coverage………...34
Table 6. Land use/cover classification of Gilgel Abbay watershed as per SWAT model………..……35
Table 7. The slope classes of the Gilgel Abbay watershed………..…………...37
Table 8. SWAT parameters Sensitivity class………..………39
Table 9. Confusion matrix for the classification of 1986………..………….44
Table 10. Confusion matrix for the classification of 2001………….……….……...45
Table 11. Area of land covers types and change statistics of Gilgel Abbay watershed for the period of 1986 and 2001………..………...47
Table 12. List of Parameters and their ranking with MRS values for monthly flow………...48
Table 13. List of parameters with calibrated values for average monthly stream flow………..50
Table 14. Comparison of Measured and simulated monthly flow for calibration and validation simulations……….….52
Table 15. Mean monthly wet and dry season stream flow and their variability (1986-2001)……….….54
xi
INDEX OF FIGURES
Figure 1. Major River Basins in Ethiopia and Location Map
of the Gilgel Abbay Watershed………..………...14
Figure 2. Mean monthly rainfall distribution of selected meteorological stations for the period of 1986-2001………..……...17
Figure 3. Mean annual rainfall from 1986-2001………..17
Figure 4. Frame work of the study………..…….26
Figure 5. The Standard “False Color” composite satellite image of the study area of the year 1986 and 2001………..…...28
Figure 6. Digital Elevation Model of Gilgel Abbay watershed………..….31
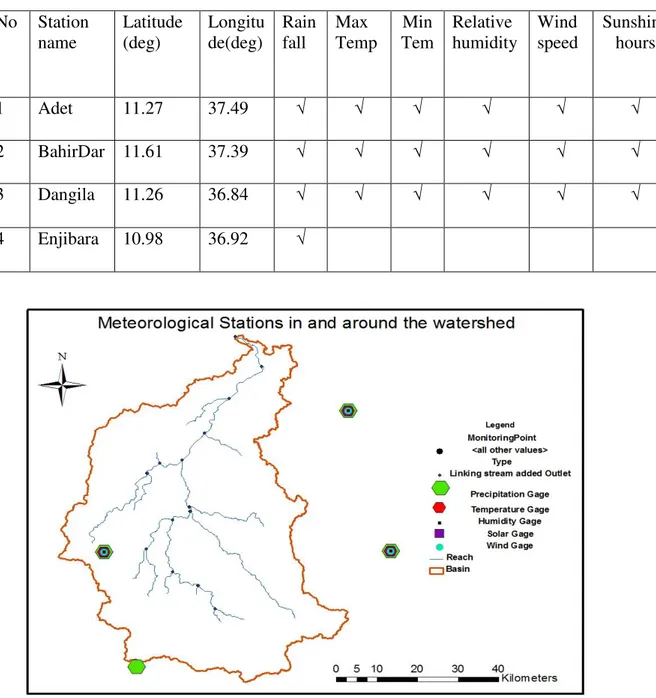
Figure 7. Location of meteorological stations in and around the watershed……...32
Figure 8. Map of the soil types of Gilgel Abbay watershed………..…..33
Figure 9. Sub watersheds map of the Gilgel Abbay watershed………..….36
Figure 10. Land cover map of Gilgel Abbay watershed in 1986………...46
Figure 11. Land cover map of Gilgel Abbay watershed in 2000………...46
Figure 12. The result of calibration for average monthly stream flows……….51
Figure 13. The result of Validation for average monthly stream flows……….51 Figure 14. Scatter plots of the calibration and validation periods show
1
CHAPTER ONE
INTRODUCTION
1.1. Study Background
Water is the most essential natural resources for living species. Since the available amount of water is limited, scarce, and not spatially distributed in relation to the population needs, proper management of water resources is essential to satisfy the current demands as well as to maintain sustainability. Land use planning and management are closely related to the sustainability of water resources as changes of land use are linked with amount of water through relevant hydrological processes (Guo et al, 2008). To maintain water sustainability, effective methods and mechanisms should be used. In nowadays, the hydrological models are good to represent the hydrological characteristics (Surur, 2010).
2 Providing a scientific understanding of the process of land use and land cover change, the impacts of different land use decisions, and the ways that decisions are affected the hydrological cycle and increasing variability are priority areas of research (Abraha, 2007). The main intention of this study is to analyze the effect of land use and land cover changes on the wet month and dry month stream flow and the components (surface and ground water flow) of stream flow of the watershed. Stream flow usually has high seasonal variability, and seasonal local water scarcity is a problem faced by many farmers in watersheds (Jamtsho and Gyamtsho, 2003). Generally, this study can be achieved through the integration of Remote Sensing, Geographic Information System (GIS) and Soil and Water Assessment Tool (SWAT model).
1.2. Statement of the Problem
The Lake Tana basin is densely populated with a total population of about two million (Surur, 2010). Gilgel Abbay watershed which is one of the sub watersheds of Lake Tana basin is densely populated with an annual growth rate of 2.3 % according to CSA (central statistics authority). This causes various effects on resource bases like deforestation, expansion of residential area, and agricultural land. Gilgel Abbay watershed which is one of the sub watersheds of Lake Tana basin is facing these types of effects. Deforestation is a day to day activity of the people living in the watershed. The watershed is also facing high erosion by the effects of intense rainfall of the watershed which aggravates the land cover change of the watershed. This continuous change in land cover has impacted the water balance of the watershed by changing the magnitude and pattern of the components of stream flow which are surface runoff and ground water flow, which results increasing the extent of the water management problem. Therefore, a strong need is identified for the hydrological techniques and tools that can assess the effects of land cover changes on the hydrologic response of a watershed. Such techniques and tools can provide information that can be used for water resources management at a watershed.
1.3. Objective of the Study
The main objective of this study was to assess the impacts of land use and land cover change impact on the stream flow of Gilgel Abbay watershed using Remote Sensing and GIS Techniques, and Soil and Water Assessment (SWAT model) Tool for the past 16 years (1986-2001).
The specific objectives:
3
To assess the accuracy of the classified maps using the Error Matrix (Confusion Matrix)
To identify the flow sensitive parameters of the watershed
To calibrate and validate of the stream flow simulation
To evaluate the performance of the hydrological (SWAT) model
1.4. Research Questions
To address the above objectives, the following research questions were designed. 1. How is the trend of land use and land cover changes from 1986 to 2002 in the
study watershed?
2. How well can SWAT model simulate stream flow in the watershed?
3. How does land use and land cover change affects the stream flow of the watershed?
1.5. Significance of the Study
The land use and land cover change has significantly impacts on natural resources, socioeconomic and environmental systems. However, to assess the effects of land use and land cover change on stream flow, it is important to have an understanding of the land use and land cover patterns and the hydrological processes of the watershed. Understanding the types and impacts of land use and land cover change is essential indicator for resource base analysis and development of effective and appropriate response strategies for sustainable management of natural resources in the country in general and at the study area in particular.
Moreover, the study presents a method to quantify land use and land cover change and their impact on hydrological regime. This has been achieved through a method that combines the hydrological model (SWAT) to simulate the hydrological processes, GIS and remote sensing techniques to analysis the land use and land cover change.
1.6. Softwares and Materials used
4
1.7. Organization of the Thesis
5
CHAPTER TWO
LITERATURE REVIEW
Under this section, literatures were cited on relevant topics, such as: definition and concepts of land use and land cover change, land use and land cover change studies in Ethiopia, application of remote sensing on land use and land cover change, Introduction to hydrological models, worldwide perspective of the hydrological (SWAT) model, and SWAT model in Ethiopia. Generally, the reviews were focused on assessing the scientific works that are related to the subject of this study.
2.1. Land Use and Land Cover Change: Definitions and
Concepts
According to the International Geosphere-Biospehre Program and The International Human Dimension Program (IGBP-IHDP, 1999), land cover refers to the physical
and biophysical cover over the surface of earth, including distribution of vegetation, water, bare soil and artificial structures. Land use refers to the intended use or
management of the land cover type by human beings such as agriculture, forestry and building construction.
Land use and land cover change (LUCC) is commonly grouped in to two broad categories: conversion and modification (Meyer and Turner, 1994). Conversion refers to a change from one cover or use category to another (e.g. from forest to grassland). Modification, on the other hand, represents a change within one land use or land cover category (e.g. from rainfed cultivated area to irrigated cultivated area) due to changes in its physical or functional attributes. These changes in land use and land cover systems have important environmental consequences through their impacts on soil and water, biodiversity, and microclimate (Lambin et al., 2003).
6 Land use and land cover characteristics have many connections with hydrological cycle. The land use and land cover type can affect both the infiltration and runoff amount by following the falling of precipitation (Hougton, 1995). Both surface runoff and ground water flow are significantly affected by types of land cover (Abebe, 2005). Surface runoff and Ground water flow are the two components of the stream flow. Surface runoff is mostly contributed directly from rainfall, whereas ground water flow is contributed from infiltrated water. However, the source of stream flow is mostly from surface runoff during the wet months, whereas during the dry months the stream flows from the ground water.
Increase of crop lands and decrease of forest, results increase of stream flow because of the crop soil moisture demand. Crops need less soil moisture than forests; therefore, the rainfall satisfies the shortage of soil moisture in agricultural lands more quickly than in forests there by generating more runoff when the area under agricultural land is extensive. Hence, this leads to an increases stream flow. In addition, deforestation also has its own impact on hydrological processes, leading to declines in rainfall, and more rapid runoff after precipitation (Legesse et al, 2003). Therefore, such changes of land use and land cover may have impacts on the stream flow during the wet and dry months, and on the components of stream flow (surface runoff and ground water flow) and assessing such impacts is the core of this study.
Generally, knowing of the impacts of land use and land cover change on the natural resources like water resources depends on an understanding of the past land use practices, current land use and land cover patterns, and projection of future land use and land cover, as affected by population size and distribution, economic development, technology, and other factors. The land use and land cover change assessment is an important step in planning sustainable land management that can help to minimize agro-biodiversity losses and land degradation, especially in developing countries like Ethiopia (Hadgu, 2008).
2.2. Land Use and Land Cover Change Studies in Ethiopia
In Ethiopia, the land is used to grow crops, trees, animals for food, as building sites for houses and roads, or for recreational purposes. Most of the land in the country is being used by smallholders who farm for subsistence. With the rapid population growth and in the absence of agricultural intensification, smallholders require more land to grow crops and earn a living; it results in deforestation and land use conversions from other types of land cover to cropland.
7 vegetation including forests and shrublands; for example Belay, (2002); Bewket, (2003); Kidanu, (2004); Abebe, (2005) in northern part of Ethiopia, Zeleke and Hurni, (2001) in north western part of Ethiopia, Kassa, (2003) in north eastern part of Ethiopia; and Denboba, (2005) in south western part of Ethiopia.
Kassa (2003) in his study, in southern Wello, reported the decline of natural forests and grazing lands due to conversions to croplands. Bewket (2003) have reported an increase in wood lots (eucalyptus tree plantations) and cultivated land at the expense of grazing land in both Chemoga watershed in north-western Ethiopia, and Sebat-bet Gurage land in south-central Ethiopian. The changes of land use and land cover that occurred from 1971/72 to 2000 in Yerer Mountain and its surrounding results an expansion of cultivated land at the expense of the grasslands (Gebrehiwet, 2004).
Hadgu (2008) identified that decrease of natural vegetation and expansion of agricultural land over a period of 41 years in Tigray, northern part of Ethiopia. He concluded that population pressure was an important deriver for expansion and intensification of agricultural land in recent periods. Garedew, (2010) in the semi-arid areas of the central Rift Valley of Ethiopia, during the period 1973-2000 cropland coverage has increased and woodland cover lost. Similarly, Feoli, et al., (2002) also reported the expansion of evergreen vegetation with increase of population.
According to many literatures, population growth has a paramount impact on the environment. For instance, population pressure has been found to have negative effect on Riverine vegetation, scrublands and forests in Kalu district (Tekle and Hedlund, 2000), Riverine trees in Chemoga watershed (Bewket, 2003), and natural forest cover in Dembecha Woreda north-western Ethiopia (Zeleke and Hurni, 2001). Similarly, Pender et al., (2001) report that the population growth has significant effect on land degradation, poverty and food insecurity in the northern Ethiopian highlands.
8
2.3. Application of Remote Sensing on LULCC
Remote Sensing (RS) is defined as the science of obtaining information about an object, area, or phenomenon throught the analysis of data acquiring by a device that is not contact with the object, area, or phenomenon under investigation (Bawahidi, 2005). It provides a large amount of data about the earth surface for detailed analysis and change detection with the help of sensors. Most of data inputs to the hydrological (SWAT) model is directly or indirectly extracted from remotely sensed data. Some of the important data used in the hydrological modelling that are obtained from remote sensing include digital elevation model (DEM), land cover maps.
Some of the application of remote sensing technology in mapping and studying of the land use and land cover changes are; map and classify the land use and land cover, assess the spatial arrangement of land use and land cover, allow analysis of time-series images used to analyze landscape history, report and analyze results of inventories including inputs to Geographic Information System (GIS), provide a basis for model building.
Land use and land cover is changing rapidly in most parts of the world. In this situation, accurate, meaningful and availability of data is highly essential for planning and decision making. Remote sensing is particularly attractive for the land cover data among the different sources. Stefanov et al (2001) reported that in 1970’s satellite remote sensing techniques have started to be used as a modern tool to detect and monitor land cover change at various scales with useful results.
William et al (1991) showed that the information of land use and land cover change which is extracted from remotely sensed data is vital for updating land cover maps and the management of natural resources and monitoring phenomena on the surface. The importance of land cover mapping is to show the land cover changes in the watershed area and to divide the land use and land cover in different classes of land use and land cover. For this purpose, remotely sensed imagery play a great role to obtaining information on both temporal trends and spatial distribution of watershed areas and changes over the time dimension for projecting land cover changes but also to support changes impact assessment (Atasoy et al., 2006). To monitor the rapid changes of land cover, to classify the types of land cover, and to obtain timely land cover information, multitemporal remotely sensed images are considered effective data sources.
2.4. Hydrological Models
9 many different forms. However, hydrological models are in general designed to meet one of the two primary objectives. The one objective of the watershed hydrologic modelling is to get a better understanding of the hydrologic processes in a watershed and of how changes in the watershed may these phenomena. The other objective is for hydrologic prediction (Tadele, 2007). They are also providing valuable information for studying potential impacts of changes in land use and land cover or climate.
On the basis of process description, the hydrological models can be classified in to three main categories (Cunderlik, 2003).
1. Lumped models. Parameters of lumped hydrologic models do not vary
spatially within the basin and thus, basin response is evaluated only at the outlet, without explicitly accounting for the response of individual sub-basins. The parameters often do not represent physical features of hydrologic processes and usually involve certain degree of empiricism. These models are not usually applicable to event-scale processes. If the interest is primarily in the discharge prediction only, then these models can provide just as good simulations as complex physically based models.
2. Distributed models. Parameters of distributed models are fully allowed to vary in space at a resolution usually chosen by the user. Distributed modeling approach attempts to incorporate data concerning the spatial distribution of parameter variations together with computational algorithms to evaluate the influence of this distribution on simulated precipitation-runoff behaviour. Distributed models generally require large amount of (often unavailable) data. However, the governing physical processes are modelled in detail, and if properly applied, they can provide the highest degree of accuracy.
3. Semi-distributed models. Parameters of semi-distributed (simplified
distributed) models are partially allowed to vary in space by dividing the basin in to a number of smaller sub-basins. The main advantage of these models is that their structure is more physically-based than the structure of lumped models, and they are less demanding on input data than fully distributed models. SWAT (Arnold, et al., 1993), HEC-HMS (US-ACE, 2001), HBV (Bergström, 1995), are considered as semi-distributed models.
10 are not suited for the simulation of dry-weather flows. On the other hand, continuous-process models simulate instead a longer period, predicting watershed response both during and between precipitation events. They are suited for simulation of daily, monthly or seasonal stream flow, usually for long-term runoff-volume forecasting and for estimates of water yield (Cunderlik, 2003).
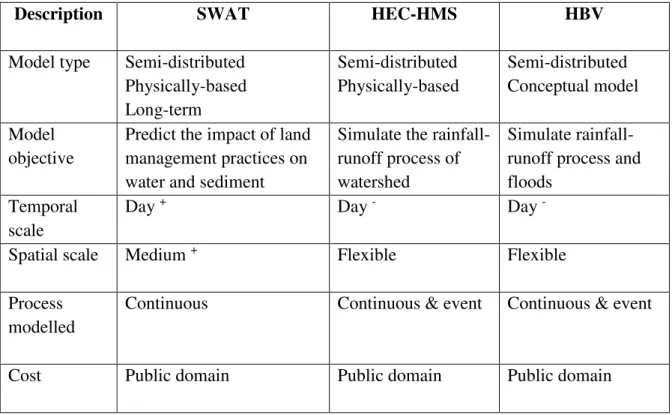
Generally for this study, semi-distributed models are selected because of their structure is more physically-based than the structure of lumped model, and they are less demanding on input data than fully distributed models. Therefore, three selected semi-distributed models were reviewed (Table 1).
Table 1. Description of three selected semi-distributed hydrological models
Description SWAT HEC-HMS HBV
Model type Semi-distributed Physically-based Long-term Semi-distributed Physically-based Semi-distributed Conceptual model Model objective
Predict the impact of land management practices on water and sediment
Simulate the rainfall-runoff process of watershed
Simulate rainfall-runoff process and floods
Temporal scale
Day + Day - Day
-Spatial scale Medium + Flexible Flexible
Process modelled
Continuous Continuous & event Continuous & event
Cost Public domain Public domain Public domain
2.4.1. Introduction to SWAT Model
The SWAT (Soil and Water Assessment Tool) watershed model is one of the most recent models developed at the USDA-ARS (Arnold et al., 1998) during the early
1970’s. SWAT model is semi-distributed physically based simulation model and can predict the impacts of land use change and management practices on hydrological regimes in watersheds with varying soils, land use and management conditions over long periods and primarily as a strategic planning tool (Neitsch, et al, 2005).
11 watershed. In SWAT model, the impacts of spatial heterogeneity in topography, land use, soil and other watershed characteristics on hydrology are described in subdivisions. There are two scale levels of subdivisions; the first is that the watershed is divided into a number of sub-watersheds based upon drainage areas of the attributes, and the other one is that each sub-watershed is further divided in to a number of Hydrologic Response Units (HRUs) based on land use and land cover, soil and slope characteristics.
The SWAT model simulates eight major components: hydrology, weather, sedimentation, soil temperature, crop growth, nutrients, pesticides, and agricultural management (Neitsch, et al, 2005). Major hydrologic processes that can be simulated by the this model include evapotranspiration, surface runoff, infiltration, percolation, shallow aquifer and deep aquifer flow, and channel routing (Arnold et al., 1998). Stream flow is determined by its components (surface runoff and ground water flow from shallow aquifer).
2.4.1.1. SWAT Model Application Worldwide
The SWAT model has good reputation for best use in agricultural watersheds and its uses have been successfully calibrated and validated in many areas of the USA and other continents (Ndomba, 2002; Tripathi et al., 2003).The studies indicated that the SWAT Model is capable in simulating hydrological process and erosion/sediment yield from complex and data poor watersheds with reasonable model performance statistical values. Ndomba (2002) was applied the SWAT model in modeling of Pangari River (Tanzania) to evaluate the applicability of the model in complex and data poor watersheds. Tripathi et al., (2003) applied the SWAT model for Nagwan watershed in India with the objective of identifying and prioritizing of critical sub-watersheds to develop an effective management plan and the model was verified for both surface runoff and sediment yield. Accordingly, the study concluded that the SWAT model can be used in ungauaged watersheds to simulate the hydrological and sediment processes.
SWAT has gained international acceptance as a robust interdisciplinary watershed modeling tool as evidenced by international SWAT conferences, hundreds of SWAT-related papers presented at numerous other scientific meetings, and large number of articles published in peer-reviewed journals (Gassman, 2007).
12 is also found to be uneven, which suggests the significance of a multi-criteria approach for the calibration of the model.
2.4.1.2. SWAT Model Application in Ethiopia
The SWAT model application was calibrated and validated in some parts of Ethiopia, frequently in Blue Nile basin. Through modeling of Gumara watershed (in Lake Tana basin), Awulachew et al. (2008) indicated that stream flow and sediment yield simulated with SWAT were reasonable accurate. The same study reported that similar long term data can be generated from ungauged watersheds using the SWAT model. A study conducted on modeling of the Lake Tana basin with SWAT model also showed that the SWAT model was successfully calibrated and validated (Setegn et al., 2008). This study reported that the model can produce reliable estimates of stream flow and sediment yield from complex watersheds. Gessese (2008) used the SWAT model performed to predict the Legedadi reservoir sedimentation. According to this study, the SWAT model performed well in predicting sediment yield to the Legedadi reservoir. The study further put that the model proved to be worthwhile in capturing the process of stream flow and sediment transport of the watersheds of the Legedadi reservoir.
In addition to the above, the SWAT model was tested for prediction of sediment yield in Anjeni gauged watershed by Setegn et al., (2008). The study found that the observed values showed a good agreement at Nash-Sutcliff efficiency (ENS) of 80 %. In light of this, the study suggested that the SWAT model can be used for further analysis of different management scenarios that could help different stakeholders to plan and implement appropriate soil and water conservation strategies. The SWAT model showed a good match between measured and simulated flow and sediment yield in Gumara watershed both in calibration and validation periods (Asres and Awulachew, 2010). Tekle (2010) through modeling of Bilate watershed also indicated that SWAT Model was able to simulate stream flow at reasonable accuracy.
13
CHAPTER THREE
MATERIALS AND METHODS
3.1. Description of the Study Area
3.1.1. Location
Gilgel Abbay is the largest tributary of the Lake Tana basin, Ethiopia. This watershed is located in West Gojjam and Awi Administrative Zones of the Amhara National Regional State (ANRS) of Ethiopia. The watershed area comprises of 10
Woredas’ namely: Mecha, South-Achefer, Dangla, Sekela, Fagtalakuma, North-Achefer, Bahir-Dar zuria, Banja, Quarit and Yilmanedensa.
In terms of geographic coordinate system, the watershed lies between 10.95o and 11.80o North latitudes and 36.70o and 37.40o East longitudes. Gilgel Abbay
14
15
3.1.2. Climate
The climate of Ethiopia can be classified in different ways including the Traditional,
Koppen’s, Throthwaite’s, Rainfall regimes, and Agro-climatic zone classification systems. The most common used classification systems are the traditional and the agro-ecological zones. According to the traditional classification system, this mainly relies on altitude and temperature; there are five climatic zones namely: Wurch (cold climate at more than 3000 Mts. altitude), Dega (temperate like climate-highlands with 2500-3000 Mts.altitude), Woina Dega (warm at 1500-2500 Mts. altitude), Kola (hot and arid type, less than 1500m in altitude), and Berha (hot and hyper-arid type) climate (NMSA, 2001).
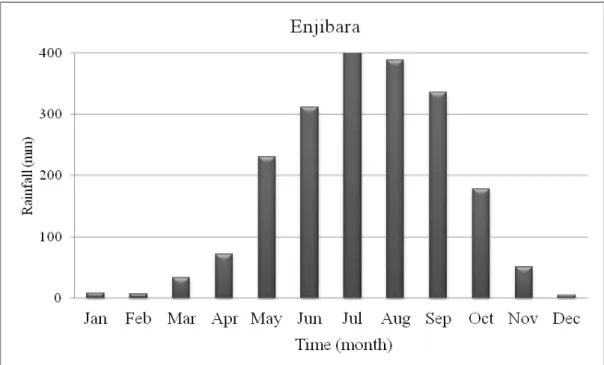
There is high spatial and temporal variation of rainfall in the study area. The main rainfall season which accounts around 70-90% of the annual rainfall occurs from June to September, while small rains also occur occurs during December to March.
The monthly rainfall distributions of the study area indicate that July and August are the wettest months of the year in all the selected stations. The mean monthly rainfall of the Adet, Bahir Dar, Dangila and Enjibara stations for the period of 1986-2001 is shown in Figure 2.
17 Figure 2. Mean monthly rainfall distribution of selected meteorological stations for
the period of 1986-2001
18
3.1.3. Soil types, Geology and Land Cover
The regional geology of the Gilgel Abbay watershed is dominated by the Tertiary volcanic rock and Quaternary Basalts. In this watershed seven main soil types are found which include, Luvisols, Fluvsisols, Alisols, Nitisols, Vertisols, Leptosols and Regosols. Generally, the soils types of this watershed area are characterized with shallow, moderate to deep and very deep in depth and sandy clay to clay texture types. The erodibility of these soils also varies from medium to very erodible characteristics.
Vertisols are deep to very deep, moderately well to poorly drained, very dark grey to dark yellowish brown in the topsoil, and clay textured throughout. The soils have large surface cracks in the dry season. Run-off formation from Vertisols is high and hence it is susceptible to erosion. The recent soils which are not developed are classified as Fluvisols and found in small extent in the watershed area. The shallow and very shallow soils are classified as Leptosols. Leptosols are found in relatively small areas in the watershed area. These are stony and rocky. The texture of Leptosols varies from sandy clay loam to clay and has excessive drainage characteristics.
Nitisols occupied about 2% of the watershed area. They are reddish brown to red clay soils. These soils are deep and have very good potential agriculture. The Nitisols of the area are intensely cultivated for annual crops.
Luvisols exist in bigger extent in the watershed area. These soils show textural differentiation with moderate to high clay content. These soils are almost intensively cultivated. The major red clay soils (Alisols) occur mainly on flat to rolling upland plain and flat to undulating land features. These are deep, well drained, permeable and medium textured soils. Regosols are found in very small extent in the watershed area. They are very deep and are imperfectly drained soils. The soils have very organic matter content and good inherent fertility status.
The land covers of the watershed are mainly cultivated land, grass land, water and marshy land, forest and shrub land.
3.1.4. Population
19 Table 2. Population Size of Ethiopia (in millions) 1984-2007
Census Year Population (In Millions)
1984 39.9
1994 53.1
2007 73.9
Source: CSA (2008).
The total population living around the Lake Tana basin and the surrounding of the watershed is estimated about two million (Surur, 2010). According to CSA (central statistics authority), Gilgel Abbay is densely populated with an annual growth rate of 2.31 %. The economic activity of the population is depends on agriculture and cattle breeding activities.
3.1.5. Agriculture
The agriculture production system in the area is a subsistence type of crop and livestock production system. In this production system, the crop production is entirely dependent on livestock where the contribution of livestock include, drat power, transportation, manure, and income generating purposes. Due to high population pressure, the land is moderately to intensively cultivate.
Generally, the watershed is well known by rain fed cereal crops production. Major types of crops grown in the area includes barely, wheat, maize, teff, sorghum, finger millet and small extent pulses and oil crops. In this watershed, some farmers also practices traditional irrigation development activities from perennial rivers and springs. Moreover, recently Koga large irrigation development project with a command area of 7000 ha is under operation in the watershed. In this command area, farmers produce vegetables such as onion, potatoes, cabbage, switchyard, green pepper, etc. In addition, farmers grow field crops like maize and wheat by irrigation.
20
3.2. Hydrological Model Selection Criteria
There are various criteria which can be used for choosing the right hydrological model for a specific problem. These criteria are always project dependant, since every project has its own specific requirements and needs. Further, some criteria are also user-depended (and therefore subjective). Among the various project-dependant selection criteria, there are four common, fundamental ones that must be always answered (Cunderlik, 2003):
Required model outputs important to the project and therefore to be estimated by the model (Does the model predict the variables required by the project such as long-term sequence of flow?),
Hydrologic processes that need to be modelled to estimate the desired outputs adequately (Is the model capable of simulating single-event or continuous processes?),
Availability of input data (Can all the inputs required by the model be provided within the time and cost constraints of the project?),
Price (Does the investment appear to be worthwhile for the objectives of the project?).
Reasons for selecting SWAT model
The reasons behind for selecting SWAT model for this study are;
The model was applied for land use and land cover change impact assessment in different parts of the world.
The model simulates the major hydrological process in the watersheds
It is less demanding on input data, and
It is readily and freely available.
21
3.2.1. Description of SWAT Model
Soil and Water Assessment Tool (SWAT) was applied in the Gilgel Abbay watershed to assess the impacts of land use and land cover changes on hydrological components. The criterion used to select this model is based on benefits it provides to meet the objectives of the study area. The SWAT model is embodied in ArcGIS that can integrate various readily available geospatial data to accurately represent the characteristics of the watershed.
The SWAT watershed model is one of the most recent models developed by the USDA-ARS to predict the impacts of land management practices on water, sediment and agricultural chemicals yields in watersheds with varying soils, land use and management practices over long periods of time (Neitsch, et al, 2005).
The model is a physical based, semi-distributed, continuous time, and operating on daily time step (Neitsch, et al, 2005). As a physical based model, SWAT uses Hydrological Response Units (HRUs) to describe spatial heterogeneity in terms of land use, soil types and slope with in a watershed.
In order to simulate hydrological processes in a watershed, SWAT divides the watershed in to sub watersheds based upon drainage areas of the tributaries. The sub watersheds are further divided in to smaller spatial modelling units known as HRUs, depending on land use and land cover, soil and slope characteristics.
One of the main advantages of SWAT is that it can be used to model watersheds with less monitoring data. For simulation, SWAT needs digital elevation model, land use and land cover map, soil data and climate data of the study area. These data are used as an input for the analysis of hydrological simulation of surface runoff and groundwater recharge.
SWAT splits hydrological simulations of a watershed in to two major phases: the land phase and the routing phase. The land phase of the hydrological cycle controls the amount of water, sediment, nutrient, and pesticide loadings to the main channel in each sub watershed. While the routing phase considers the movement of water, sediment and agricultural chemicals through the channel network to the watershed outlet.
The land phase of the hydrologic cycle is modelled in SWAT based on the water balance equation (Neitsch, et al, 2005):
22 Where, SWt is the final soil water content (mm)
SWo is the initial water content (mm) t is the time (days)
Rday is the amount of precipitation on day i (mm) Qsurf is the amount of surface runoff on day i (mm) Eais the amount of evapotranspiration on day i (mm)
Wseep is the amount of water entering the vadose zone from the soil profile on day i (mm), and
Qgw is the amount of return flow on day i (mm).
The model has eight major components: hydrology, weather, sedimentation, soil temperature, crop growth, nutrients, pesticides, and agricultural management (Neitsch, et al, 2005). However, brief description of some of the SWAT computation procedures which are considered in this study are presented under the following subsections. For complete model description, one may refer to SWAT Theoretical Documentation (Neitsch, et al, 2005).
3.2.1.1. Surface Runoff
Surface runoff refers to the portion of rainwater that is not lost to interception, infiltration, and evapotranspiration (Solomon, 2005). Surface runoff occurs whenever the rate of precipitation exceeds the rate of infiltration. SWAT offers two methods for estimating the surface runoff: the Soil Conservation Service (SCS) curve number method (USDA-SCS, 1972) or the Green & Ampt infiltration method (Green and Ampt, 1911). The Green and Ampt method needs sub-daily time step rainfall which made it difficult to be used for this study due to unavailability of sub-daily rainfall data. Therefore, the SCS curve number method was adopted for this study.
The general equation for the SCS curve number method is expressed by equation 2:
(Rday – Ia) 2
Qsurf = (2) (Rday – Ia + S)
Where, Qsurf is the accumulated runoff or rainfall excess (mm), Rday is the rainfall depth for the day (mm water),
Ia is initial abstraction which includes surface storage, interception and infiltration prior to runoff (mm water),
S is retention parameter (mm water).
23 affected temporally due to changes in soil water content. It is mathematically expressed as:
1000
S = 25.4 * - 10 (3) CN
Where, CN is the curve number for the day and its value is the function of land use practice, soil permeability and soil hydrologic group.
The initial abstraction, Ia, is commonly approximated as 0.2S and equation 2 becomes:
(Rday - 0.2S) 2
Qsurf = (4) (Rday + 0.8S)
For the definition of hydrological groups, the model uses the U.S. Natural Resource Conservation Service (NRCS) classification. The classification defines a hydrological group as a group of soils having similar runoff potential under similar storm and land cover conditions. Thus, soils are classified in to four hydrologic groups (A, B, C, and D) based on infiltration which represent high, moderate, slow, and very slow infiltration rates, respectively.
3.2.1.2. Potential Evapotranspiration
Potential Evapotranspiration is a collective term that includes evaporation from the plant (transpiration) and evaporation from the water bodies and soil. Evaporation is the primary mechanism by which water is removed from a watershed. An accurate estimation of evapotranspiration is critical in the assessment of water resources and the impact of land use change on these resources.
24 For this study, the Penman-Monteith method was selected as the method is widely used and all climatic variables required by the model are available for the three stations in and around the study watershed area.
3.2.1.3. Ground Water Flow
To simulate the ground water, SWAT partitions groundwater into two aquifer systems: a shallow, unconfined aquifer which contributes return flow to streams within the watershed and a deep, confined aquifer which contributes return flow to streams outside the watershed (Arnold et al., 1993). In SWAT the water balance for a shallow aquifer is calculated with equation 5.
aq sh, i = aq sh, i-1 + W rchrg – Q gw – W revap – Wdeep – Wpump, sh (5)
Where, aq sh, i is the amount of water stored in the shallow aquifer on day i (mm), aq sh, i-1 is the amount of water stored in the shallow aquifer on day i-1 (mm), Wrchrg is the amount of recharge entering the aquifer on day i (mm),
Qgw is the ground water flow, or base flow, or return flow, into the main channel on day i (mm),
W revap is the amount of water moving in to the soil zone in response to water deficiencies on day i (mm),
W deep is the amount of water percolating from the shallow aquifer in to the deep aquifer on day i (mm), and
Wpump, sh is the amount of water removed from the shallow aquifer by pumping on day i (mm).
3.2.1.4. Flow Routing Phase
The second component of the simulation of the hydrology of a watershed is the routing phase of the hydrologic cycle. It consists of the movement of water, sediment and other constituents (e.g. nutrients, pesticides) in the stream network.
25 The variable storage method was used for this study. The method was developed by (Williams, 1969). The equation of the variable storage routing is given by:
ΔVstored = Vin - Vout (6)
Where, ΔVstored is the change in volume of storage during the time step (m3 water) Vin is the volume of inflow during the time step (m3 water), and
26
3.3. Methodology
The following framework illustrates the general workflow of the study can be described by Figure 4.
Figure 4. Frame work of the study Data Collection
Landsat digital images of TM & ETM+
Climate data Soil map DEM Hydrological
data
Image preparocessing of TM (1986) Image preparocessing of ETM+ (2001) Band composite of TM (1986) Band composite of ETM+ (2001)
Image classification of TM (1986) Image classification of ETM+ (2001)
Land use/cover map of 1986 Land use/cover map of 2001
Accuracy Assessment of 1986 & 2001 land use/cover maps
SWAT Database preparation Watershed Delineation Hydrological Response Unit Analysis
Weather generator setup Run the Model
Sensitivity Analysis
Model Calibration & Validation
Run the calibrated model using 1986 land use/cover
Run the calibrated model using 2001 land use/cover map
27
3.3.1. Data Acquisition
For this study, various data are required that includes topographic data (DEM), Land use and land cover data, soil data, daily data of climatic variables (daily data of precipitation, maximum and minimum temperature, relative humidity, wind speed and solar radation). The DEM and land cover satellite data were obtained from the NASA website. Soil and hydrological data were collected from the Ministry of Energy and Water Resources of Ethiopia. The climatic data were obtained from the National Meteorological Agency of Ethiopia.
3.3.2. Image Processing
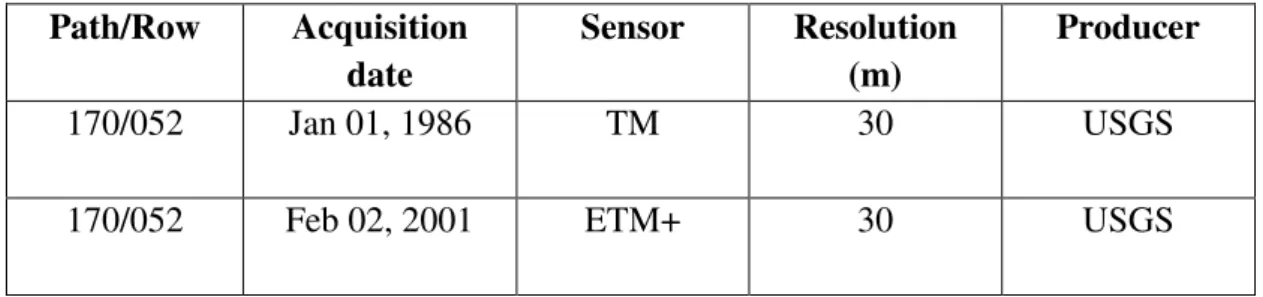
This study was done using Landsat imageries of six bands to identify changes in land use and land cover distribution in the Gilgel Abbay watershed over 16 years period from 1986 to 2001. Landsat TM and ETM+ were selected for the period of 1986 and 2001 respectively. To avoid a seasonal variation in vegetation pattern and distribution throughout a year, the selection of dates of the acquired data were made as much as possible in the same annual season of the acquired years. The images used in this study area were orthorectified to a Universal Transverse Mercator projection using datum WGS (World Geodetic System) 84 zone 37N. In order to view and discriminate the surface features clearly, all the input satellite images were composed using the RGB color composition (Figure 5). The images provide complete coverage of Gilgel Abbay watershed.
The image data files were downloaded in zipped files from the United State Geological Survey (USGS) website and extracted to Tiff format files. The
acquisition dates, sensor, path/row, resolution and the producer’s of the satellite
images used in this study are summarized in the Table below.
Table 3. The acquisition dates, sensor, path/row, resolution and the producer’s of the images
Path/Row Acquisition
date
Sensor Resolution
(m)
Producer
170/052 Jan 01, 1986 TM 30 USGS
28 Figure 5. The Standard “False Color” composite satellite image of the study area of
the year 1986 and 2001
3.3.3. Land Use and Land Cover Mapping
3.3.3.1. Land Use and Land Cover Classes
The Land use and land cover change studies usually need the development and the definition of homogeneous land use and land cover units before the analysis is started. These have to be differentiated using the available data source such as remote sensing, any other relevant information and the previous local knowledge. Hence, based on the priori knowledge of the study area and additional information from previous research in the study area (Taddele et al, 2009; Abebe et al, 2005), five different types of land use and land cover have been identified for the Gilgel Abbay catchment. The descriptions of these land use and land covers are given as follows:
29 Forest land: Land covered with dense trees which includes ever green forest land, mixed forest and plantation forests.
Shrub land: Areas with shrubs, bushes and small trees, with little wood, mixed with some grasses.
Grass land: Areas covered with grass used for grazing, as well as bare lands that have little grass or no grass cover. It also includes other small seized plant species.
Water and marshy land: Areas which are water logged and swampy throughout the year, the rivers and its main tributaries.
3.3.3.2. Image Classification
Image classification is the process of assigning of pixels of continuous raster image to the predefined land cover classes. It is always a difficult and time consuming task. Different issues to keep in mind to avoid overlapping features and finish with effective classification leis parallel with the ground truth. The result of the classification is mostly affected by various factors such as classification methods, algorithms, collecting of training sites etc.
In remote sensing, there are various image classification methods. Their appropriateness depends on the purpose of land cover maps produced for and the
analyst’s knowledge of the algorithms is using. However, in most cases the researchers categorized them in to three major categories: Supervised, unsupervised and hybrid. For this study, the supervised classification type was applied. It is the most common type of classification technique in which all pixels with similar spectral value are automatically categorized in to land cover classes or themes. Supervised classification which relies on the prior knowledge of pattern recognition of the study area was used. It requires the manual identification of point of interest areas as reference or Ground Truth within the images, to determine the spectral signature of identified features.
For this study, the land cover map was produced based on the pixel based supervised classification throught the steps such as: First, selecting of the training sites which are typically representative for the land cover classes. The training sites were
30
3.3.3.3. Accuracy Assessment
Accuracy assessment is an important step in the image classification process. The objective of this process is to quantitatively determine how effectively pixels were grouped in to the correct features classes in the area under investigation. It is a process used to estimate the accuracy of image classification by comparing the classified map with a reference map (Caetano et al, 2005). The most widely used classification accuracy is in the form of error matrix which can be used to derive a series of descriptive and analytical statistics (Manandhar et al, 2009). The columns of the matrix depict the number of pixels per class for the reference data, and the rows show the number of pixels per class for the classified image. From this error matrix, a number of accuracy measures such as overall accuracy, user’s and
producer’s accuracy determined. The overall accuracy is used to indicate the accuracy of the whole classification (i.e. number of correctly classified pixels divided by the total number of pixels in the error matrix), whereas the other two measures indicate the accuracy of individual classes. User’s accuracy is regarded as the probability that a pixel classified on the map actually represents that class on the
ground or reference data, whereas product’s accuracy represents the probability that
a pixel on reference data has been correctly classified.
The accuracy assessment of the classified map is the comparison of the classified image and the sampling points from the orthophotos, Google Earth Imageries and existing land cover maps (Yesserie, 2009). In this study, the assessment was carried out using the original image for 1986 maps and the Google Earth Image for 2001 together with previous knowledge of the area was used as reference data to generate testing data set. A total of 81 and 83 testing sample points were selected randomly for the year 1986 and 2001 respectively.
3.4. Model Input Data Collection and Analysis
SWAT is highly data intensive model that requires specific information about the watershed such as topography, land use and land cover, soil properties, weather data, and other land management practices. These data were collected from different sources and databases. The data are analyzed as presented in the next sub-sections.
3.4.1. Digital Elevation Model
31 Figure 6. Digital Elevation Model of Gilgel Abbay watershed
3.4.2. Weather Data
Weather data are among the main demanding input data for the SWAT simulation. The weather input data required for SWAT simulation includes daily data of precipitation, maximum and minimum temperature, relative humidity, wind speed and solar radation. These were obtained from the Ethiopian National Meteorological Agency. The weather data used were represented from four stations in and around Gilgel – Abbay watershed, such as Adet, Bahirdar, Dangla and Enjibara stations as shown in figure 7. The first three stations are the first classes that have records on all climatic variables, whereas the last one is the third class stations (Table 4). The climatic data used for this study covers 16 years from January 1986 to December 2001.
Based on the class of the stations, the number of weather variables collected varies from stations to stations that are grouped into two. The first group contains only rainfall data. The second group contains variables like maximum – minimum temperature, humidity, sunshine hours, and wind speed in addition to rainfall.
32 However, missing values were identified in some of the climatic variables. These values were assigned with no data code (-99) which then filled by the weather generator embodied in the SWAT model from monthly weather generator parameters values. The monthly generator parameters values were estimated from the three weather stations (Adet, Bahir Dar and Dangla).
Finally, the weather data were prepared in DBF format with lookup tables as required by the model.
Table 4. Meteorological station names, locations and variables
No Station name
Latitude (deg)
Longitu de(deg)
Rain fall
Max Temp
Min Tem
Relative humidity
Wind speed
Sunshine hours
1 Adet 11.27 37.49 √ √ √ √ √ √
2 BahirDar 11.61 37.39 √ √ √ √ √ √
3 Dangila 11.26 36.84 √ √ √ √ √ √
4 Enjibara 10.98 36.92 √
33
3.4.3. Soil Data
Soil data is one of the major input data for the SWAT model with inclusive and chemical properties. The soil map of the study area was also obtained from Ministry of Energy and Water Resources of Ethiopia. According to FAO/UNESCO – ISRIC classification, nine major soil groups were identified in the watershed of Gilgel – Abbay (Figure 8).
SWAT model requires soil physical and chemical properties such as soil texture, available water content, hydraulic conductivity, bulk density and organic carbon content for different layers of each soil type. These data were obtained from Minister of Ethiopian Energy and Water Resources as presented.
To integrate the soil map with SWAT model, a user soil database which contains textural and chemical properties of soils was prepared for each soil layers and added to the SWAT user soil databases using the data management append tool in ArcGIS. The symbol and areal coverage of the soil types are presented in Table 5.
34 Table 5. Soil types of Gilgel Abbay watershed with their symbols and areal coverage
Soil type Symbol
Area
ha %
Chromic Luvisols LVx 43611.56 11.54
Eutric Fluvisols FLe 3628.00 0.96
Lithic Leptosols LPq 29968.78 7.93
Eutric Regosols RGe 3136.71 0.83
Haplic Nitisols NTh 6349.00 1.68
Eutric Leptosols LPe 188.96 0.05
Eutric Vertisols VRe 45916.85 12.15
Haplic Luvisols LVh 183176.12 48.47
Haplic Alisols ALh 61940.51 16.39
3.4.4. Land Use and Land Cover
Land use is one of the highly influencing the hydrological properties of the watersheds. It is one of the main input data of the SWAT model to describe the Hydrological Response Units (HRUs) of the watersheds.
35 Table 6. Land use/cover classification of Gilgel Abbay watershed as per SWAT
model
Land use / Land cover Land use according to SWAT
database
SWAT code
Cultivated land Agricultural land close to grown AGRC
Forest Forest mixed FRST
Shrub land Forest deciduous FRSD
Grass land Pasture land PAST
Water & marshy land Water WATR
3.4.5. Hydrological Data
The stream flow data of the Gilgel Abbay watershed is needed for the calibration and validation of the model. The daily stream flow data (1986-2001) is quite sufficient and were collected from the Minister of Energy and Water Resources of Ethiopia for the Gilgel Abbay watershed.
3.5. Model Setup
3.5.1. Watershed Delineation
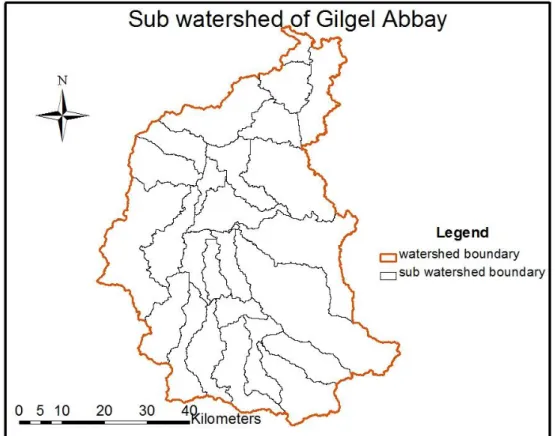
The watershed and sub watershed delineation was performed using 30 m resolution DEM data using Arc SWAT model watershed delineation function. First, the SWAT project set up was created. The watershed delineation process consists of five major steps, DEM setup, stream definition, outlet and inlet definition, watershed outlets selection and definition and calculation of sub basin parameters. Once, the DEM setup was completed and the location of outlet was specified on the DEM, the model automatically calculates the flow direction and flow accumulation. Subsequently, stream networks, sub watersheds and topographic parameters were calculated using the respective tools.
36 watershed as obtained from the Minister of Energy and Waters Resources (MoEWR) was estimated to be 3865.5 km2. There is a slight deviation between the delineated
and that obtained from the MoEWR database. The difference in the total area between the delineated and the database may be due to the difference in the DEM resolution or the watershed delineator model used.
Figure 9. Sub watersheds map of the Gilgel Abbay watershed