European countri es after thei r EU
accessi on. Chal l enges duri ng the cri si s
Authors*:
Magdalena RĂDULESCU Elena Nolica DRUICĂ
bstract: The aim of this paper is to find out to what extent the accession countries will be able to benefit from an increase in the quality of foreign direct investments (FDIs) that they receive due to EU membership. Although there will be some investment in new affiliates resulting in greenfield subsidiaries, transnational companies (TNCs) may divest their operations in response to better location advantages elsewhere in the EU (as Spain and Portugal are experiencing because their low-cost advantages are eroded). In many Central and Eastern European (CEE) countries, the share of foreign ownership in total capital stock is already typically much higher than in older EU member states, but we can already observe a trend of relocating TNCs’ subsidiaries to other emerging countries in order to diminish the costs, in the context of the present crisis and we believe that this trend will continue in the future, especially in the crisis context when the inceptive burden is heavy for governments. The conclusion of this paper is that the CEE countries haven’t faced quite similar conditions as the Southern European countries that acceded to the EU in the ‘80s. So, their benefits have considerably diminished and the present crisis didn’t help them at all to reduce their economic gaps comparing to the developed European countries.
Keywords: FDIs, Central and Eastern European countries, EU accession, investment policy, crisis
JEL Classification: F21, F23, G01, G24, G38
* Ph.D. Associate Professor Magdalena R dulescu, University of Piteşti, ROMANIA, magdalenaradulescu@yahoo.com; Ph.D. Professor Elena Nolica Druic , University of Bucharest, ROMANIA, elenadruica@yahoo.com.
1. INTRODUCTION
European countries consider foreign direct investments (FDIs) as an indispensable part of their development strategy. Many of the less economically developed, older member states of the EU, such as Greece, Ireland, Portugal and Spain (referred to here as the ‘cohesion’ countries) followed this approach, and, partly as a result of their success, these investment policies have been pursued much more explicitly by the new member states (NMS) and those wishing to join, a large number of both groups being located in Central and Eastern Europe (CEE) (referred to in this paper either as the accession countries or CEE countries, irrespective of their membership status) (Narula and Bellak, 2009). However, our aim is to discuss broader aspects that are similar and relevant to all countries, rather than particular aspects and policy implications for individual countries. This paper will discuss the costs, benefits, opportunities and limitations of an FDI-based industrial development strategy in these countries, based on the findings in the economic literature and analyzing statistic data available to the European countries discussed in the paper. Those findings and the statistic data analysis are important for an empiric research elaborated for Romania that will be made in a further article. The present paper represents the base for a further research on Romania within a research project that tests the impact of the financial macroeconomic policies on FDIs in Romania for designing the Romanian investment policy in the future and for achieving sustainable economic growth.
EU membership has two important implications regarding FDIs. First, it allows countries that have small domestic markets to expand their market and to attract European funds for investments (in agriculture, infrastructure). However, as the number of countries in the EU increases, this advantage is currently shared by 27 member countries. Thus, this advantage has considerably less value to the accession countries than it had for the cohesion countries, and this is exacerbated by the fact that domestic firms in many of the CEE countries have little experience in dealing with competition in a market economy which further attenuates the benefits derived from the competition effect.
membership doesn’t mean that all member states are economically similar, only Eurozone members seem to be present more similar economic conditions. Section 2 presents the FDIs evolutions after the accession of some European countries from the South of Europe or from the Central and Eastern Europe to the EU. We consider some benefits and costs of EU accession and the limits of applying cohesion countries’ experience in the CEE area. Section 3 presents some economic developments in the analyzed countries during the crisis period and some measures adopted here against crisis effects. Section 4 concludes the paper.
2. FDIs IN SOME EUROPEAN COUNTRIES AFTER THEIR ACCESION TO THE EU
In 1995 the transition period of the Central and East European countries practically came to an end. One main factor of the transition was the massive privatization process, where foreign capital played a vital role. The inflow of FDI was bound to privatization deals. Later, as the number of these deals decreased, foreign investments took other forms. FDI was a mean of integration of these countries into the EU and Western markets (Elteto, 2010).
For the year 2000 FDI stock as a share in the GDP reached between 20-30 percent in Bulgaria and Slovakia, which figure can be compared to that of Spain. Romania and Poland were close to 20 percent and the highest levels were achieved by the Czech Republic and Hungary.
The share of FDI was outstandingly high in Hungary during the whole period, reaching 47% in 2000. Slovenia, Romania and Poland remained below 20 percent, but the latter two showed also a rapid increase in FDI inflow (Table 1).
Regarding FDI attraction, in the CEE region, the situation presented different features. The so-called “Visegrád” countries (Poland, Czech Republic, Slovakia, Hungary) were more “popular” than the others. Resmini (2005) underlined certain features of foreign investment firms’ activity in the nineties:
• The most important recipient countries are Hungary and the Czech Republic. Bulgaria, Romania and Poland lag behind, but this situation reversed in the last decade.
• Romania however is attractive for firms involved in labour-intensive production, while the most advanced countries emerge as favourite location for high-tech foreign firms.
• Foreign firms are concentrated mainly in the capital districts and Western parts of the countries, while the Eastern and Southern areas are less popular.
Thus FDI contributed to a certain extent to regional imbalances, favoring the most developed areas in the given countries. Certainly, the quality of infrastructure and labour force were here better than elsewhere, being important location factors for foreign investors.
Lankes and Venables, 1996, and Éltető and Sass, 1998, showed that for the market-oriented investors the local market size and potential was the most important driving factor and for export-oriented investors the availability and cost of qualified work force was important. Bellak et al. (2008) analyse the role of labour costs as a determinant of FDI in the CEE countries. Their results show that FDI in the CEE countries are driven by total labour costs as well as labour productivity. Labour productivity grew rapidly in the CEE countries. The productivity was particularly high in the technology-intensive sectors (machinery, electrical, optical and transport equipment). The main reason for this is that in these sectors the initial gap in productivity was larger. This growth and the availability of skilled, educated labour force attracted FDI, mainly towards higher tech sectors(Elteto, 2010).
branches were the manufacturing sectors most favoured by FDI (Éltető, A., 2010).
Beside the inflow of FDI, Spanish investments abroad also began to rise already during this period. The characteristics of Spanish outward investment at thas time were the following: a few number of large company deals, dominance of the services sector, geographic direction concentrates on the old EU members or Latin America. Approximately 45% of Spanish investments were directed towards Latin-American countries, utilizing the privatization possibilities, gaining new markets (Gordo, 2008). Spanish companies used the location advantages in these countries, mainly the common language, cultural and historical ties. Cultural link including language played an important role in the location choices of Spanish multinational companies.
From the mid-1990s to 2008, the Spanish economy enjoyed a sustained economic growth when real convergence with the core EMU member countries advanced notably. This expansionary phase was mostly driven by two factors. First, by a significant expansion of credit, which was induced by the fall in interest rates that followed Spain’s adhesion to the EMU and by a pervasive relaxation in conditions of access to credit that helped economic growth. And second, by the large immigration inflows into Spain over the period that substantially modified the demographic structure of the Spanish population. But the consequences were not good. The Spanish economy became increasingly dependent on external financing over the period and the Spanish current account deficit increased in the last decade. The price-competitiveness of the Spanish economy also deteriorated, due to very low productivity growth and to the existence of important distortions in the domestic labor and product markets (Gavilan et al., 2011).
There seems to be a relatively clear division between investment policies of the CEE countries and of the Western European Countries of the EU. While the former may gain most by focusing on infrastructure and R&D policies, the latter group’s policies to reduce the share of low-skilled workers, for example, by encouraging firms to restructure production and increase capital intensity and through a reduction in labour costs via a decrease in non-wage-labour costs, would attract most FDI (Ionita, L. and Pauwels, S., 2008).
European Union in 2004. The membership was an attractive factor for FDI in the following years. Foreign direct investment continued to play a prominent role in the CEE region and in cohesion countries also. Certain new trends can be detected however in - and outflows. Apart from that, registration of FDI also changed.
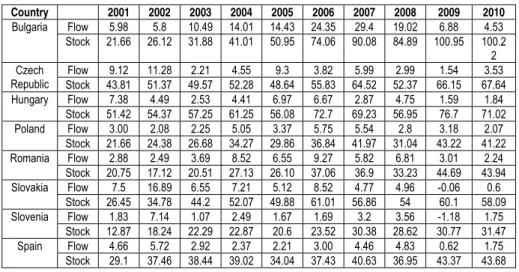
Regarding the CEE countries there are considerable fluctuations of FDI inflow which are caused by some large privatization deals. This is to a certain extent true for Spain also. In the Czech Republic, in 2001-2002, big banks and the gas company were privatized and in 2005 the local telecommunication company was sold to the Spanish Telefónica. In Slovakia the privatisation of the electricity and gas sector raised the FDI inflow to an outstanding level in 2002 (Elteto, 2010) (Table 2).
Table 2. FDI in percentage of GDP during 2001-2010
Country 2001 2002 2003 2004 2005 2006 2007 2008 2009 2010 Flow 5.98 5.8 10.49 14.01 14.43 24.35 29.4 19.02 6.88 4.53 Bulgaria
Stock 21.66 26.12 31.88 41.01 50.95 74.06 90.08 84.89 100.95 100.2 2 Flow 9.12 11.28 2.21 4.55 9.3 3.82 5.99 2.99 1.54 3.53 Czech
Republic Stock 43.81 51.37 49.57 52.28 48.64 55.83 64.52 52.37 66.15 67.64 Flow 7.38 4.49 2.53 4.41 6.97 6.67 2.87 4.75 1.59 1.84 Hungary
Stock 51.42 54.37 57.25 61.25 56.08 72.7 69.23 56.95 76.7 71.02 Flow 3.00 2.08 2.25 5.05 3.37 5.75 5.54 2.8 3.18 2.07 Poland
Stock 21.66 24.38 26.68 34.27 29.86 36.84 41.97 31.04 43.22 41.22 Flow 2.88 2.49 3.69 8.52 6.55 9.27 5.82 6.81 3.01 2.24 Romania
Stock 20.75 17.12 20.51 27.13 26.10 37.06 36.9 33.23 44.69 43.94 Flow 7.5 16.89 6.55 7.21 5.12 8.52 4.77 4.96 -0.06 0.6 Slovakia
Stock 26.45 34.78 44.2 52.07 49.88 61.01 56.86 54 60.1 58.09 Flow 1.83 7.14 1.07 2.49 1.67 1.69 3.2 3.56 -1.18 1.75 Slovenia
Stock 12.87 18.24 22.29 22.87 20.6 23.52 30.38 28.62 30.77 31.47 Flow 4.66 5.72 2.92 2.37 2.21 3.00 4.46 4.83 0.62 1.75 Spain
Stock 29.1 37.46 38.44 39.02 34.04 37.43 40.63 36.95 43.37 43.68
Source: UNCTAD, FDI database.
region. In Romania this process accelerated after 2004. Most of the total FDI stock comes from the EU and about 50% of the total stock stems from just three countries: Austria, the Netherlands and Germany. Privatisation-related FDI, which used to be significant in sectors like public utilities (gas, electricity, telecommunications), banking and the construction sector, represented half of total FDI stocks. Slovenia has the lowest penetration of FDI among the observed countries. Here the privatisation policy was more cautious towards foreign owners (Elteto, 2010). But only in Slovenia and the Czech Republic we can see that in 2010 the FDI decreasing trend reversed just like in Spain.
The Czech Republic, Slovenia and Slovakia joined the EU in 2004. They have tried to adjust the EU economic policies and they work to adapt to the open market economy. Their FDI levels are lower than in the other developed member states, but the situation changed after their EU accession. By adopting the euro, most of the countries began to use the same currency and it makes the trade easier and more efficient. When we look at Slovenia and Slovakia, Slovakia has higher levels in economic indicators than Slovenia. On the other hand, Slovenia has the worst inflow and outflow levels among all member states. It is less developed than the others. Also, the GDP is not good as in the others. These countries need some developments. If there is no more investment in one country, the other economic factors cannot be improved. To join the union is not enough. There should be new policy areas, innovations. These countries are under the European Union FDI average and the resources must be used efficiently, because the natural resources and FDI have a strong correlation. The new markets like Far East Asia and Latin America cause a decrease in FDI inflows but an increase in outflows (Osafoğlu et al., 2008).
Spain became member of the European Union in 1986 and its economic growth began to increase by 1990’s. According to statistics, FDI inflows in Spain were few before 2003, below Hungary, Bulgaria and the Czech Republic. In contrast to inflows, FDI outflows have always been more in Spain. Portugal joined the EU in 1986 with Spain. FDI inflows and outflows were not the same in Portugal. The outflows were always much more larger than inflows and this situation has continued after 2006.
Hungary, which became a member of EU in 2004, has unstable FDI rates. The FDI inflows increased after 2004, but in 2006-2007 decreased again. Still, the FDI outflows were few.
In Latvia, the number has increased year by year. In 2004 it doubled. In 2005 there was not a big increase but in 2006-2007 the FDI inflows reached their peak. The FDI outflows was minimum between 1990 and 2000 but it started to develop after 2003.
Poland, which became a member in 2004, tripled its FDI stock in 2004. However in 2005 it showed a decline, but it again got better in 2006-2008. The outflow stocks of Poland have experienced an important development during the last two decades.
In Estonia the FDI percentages have increased suddenly between 1990 and 2006. The outflow has increased ten times between 1990 and 2008.
Greece joined the EU in 1981 with the second enlargement. The FDI inflows increased after 2004 and the inflows were twice as much as outflows, although the latter increased in the last two decades.
Cyprus and Malta joined the European Union in 2004. The FDI levels are not as competitive as its brothers. Malta’s FDI inflow percentages increased five times during 1990 to 2006. Just like inflow also the outflow percentages raised during 2004 and 2006 from negative levels to small positive numbers until 2007-2008. Cyprus’s FDI inflow percentages doubled until 2007. The FDI outflows increased seven times until 2007, but they represents half of the FDI inflows.
Bulgaria and Romania joined the EU in 2007. Both states FDI inflow levels increased two or three times after 2007. In 2005 when Bulgaria reached its highest FDI outflow percentage 5.0%, Romania reached its lowest percentage as - 0.1% in 2005 and -0,05% in 2009 (Osafoğlu et al., 2008).
3. CHALLENGES DURING THE CRISIS PERIOD
inward FDI decreased significantly in 2009. The trend could be also seen in Cyprus. In the Czech Republic the inflow of EU funds helped to maintain the external balance and the banking sector behave relatively well. The fiscal deficit increased but the adequate policy measures helped to stimulate the economy (Elteto, 2010).
Slovakia was in the recent years eminent in the CEE region, with growth rates of 10 per cent in 2007 and 7 per cent even in 2008, and introduced the euro in 2009. However, Slovakia’s reliance on the car industry (which accounts for 20 per cent of GDP) means that exports suffered a lot in 2009 and FDI decreased drastically.
Polish inward FDI did not decrease significantly in 2009. Poland’s strength is the size of its domestic market, which makes it less dependent on exports than the smaller countries. Also, its industrial base is more diversified and less dependent on a single (like car) industry. Perhaps more than other new member states, Poland could benefit from the return of highly skilled workers and from infrastructure investments co-financed by structural funds.
Bulgaria was severely hit by the crisis, GDP decreased by 5% in 2009. Inward foreign direct investment also decreased to around half of the sum in the previous year. Exports, imports and manufacturing production also declined.
In Romania, besides the crisis, the general economic background worsened. Foreign investors were attracted so far by relatively low unit labour cost, proximity to the euro area, sound macroeconomic fundamentals (successful disinflation, high growth) and by domestic market potential. However, the boom of privatisation-led FDI, which represented about half of the FDI inflows in the past years, is now largely over. Furthermore, Romania's low-cost advantage is gradually eroding in certain sectors. Only at the beginning of 2011, we achieved again the economic growth and the Romanian economy has again became attractive for the foreign investors.
A tightening labour market and skill shortages, partly due to large migration, have contributed to significant increases in private sector wages, which are growing by about 20% annually (Ionita and Pauwels, 2008). Wage developments have outstripped productivity growth in the last two years, which has led to a sharp appreciation of the real effective exchange rate, adversely affecting Romania's international competitiveness.
investor (45,8%) followed by Germany (26%). France and Spanish affiliates abroad are also important investors in Spain but mainly via the Netherlands and Luxembourg. Outward Spanish investments decreased in 2008 compared to 2007, which was an outstanding year. In 2009 both the inward and outward FDI decreased significantly compared to the previous year. However, Spanish multinationals gained more weight in the last few years. Spanish companies own the largest mobile telephone company in the UK, operate three lines of the London underground and own several of the country’s largest airports, two Spanish banks dominate the Latin American banking sector, bought important banks in the UK and Inditex is the world’s second largest fashion retailer by number of shops (Chislett, 2010). Thirteen Spanish companies are included in the 2009 Financial Times Global 500 ranking of the world’s biggest companies (from the CEE countries there is only one Czech firm in the list). The expansion abroad has enabled corporate Spain, in general, to treat the global recession much better than had companies relying solely on their home market. This is particularly true of the infrastructure sector and the big commercial banks. Spain’s large construction companies won business abroad in 2009. Banco Santander generated considerable profit in 2009 in Latin America and in the UK, while Mexico provided close to one-quarter of BBVA’s profit (Chislett, 2010).
When the global financial crisis struck and the very favorable international credit conditions suddenly disappeared, the Spanish economy began an inevitable adjustment process, with a substantial reduction in consumption and investment by 2008, when housing investment plummeted. This adjustment helped to correct the excessive indebtedness of the private sector led however to a large decrease in economic activity, with GDP growth in 2009 at around -3.6%. At the same time, the work of automatic stabilizers, the loss of the revenue windfalls obtained during the expansion and the expansionary fiscal programs put in place by the government to mitigate the effects of the crisis have led to a very rapid deterioration of public accounts, which moved from a surplus of around 2% of GDP in 2007 to deficits of around 4% and 11% in 2008 and 2009, respectively. Altogether, the Spanish economy very quickly reduced its need for external financing as its current account deficit decreased from around 10% of GDP in 2008 to around 6% in 2009, being now mostly driven by fiscal deficits rather than by private indebtedness as in the expansionary phase.
Spanish economy during the expansionary phase. In this context, they find a very limited role for fiscal policy in reducing the external imbalance accumulated in Spain over the period 1998-2008.
The framework set out in this paper has also been used to analyze the different policy options faced by the Spanish economy after the crisis. Several results are worth mentioning. First, even without the arrival of the crisis, in the medium and long run the Spanish economy would have entered into a phase of lower GDP growth when the external imbalance of the economy would have been reduced but when public accounts would have deteriorated. This process, mostly driven by the aging of the Spanish population, a factor that is common to most industrialized countries, became more pronounced with global financial crisis. Second, the model highlights the relevance of the fiscal policy and of structural reforms in the post-crisis scenario. Frontloading in fiscal consolidation would contribute to public accounts’ sustainability and to mitigate the output losses induced by the crisis on medium term. In addition, policies aimed at improving competition help in reducing short and medium term output losses, while inducing a positive long-run effect on the level of output. In light of the complementarities between these policies, the recovery of economic activity in Spain after the crisis could be more successful and less costly if they were implemented together.
Bucking the general downward trend of FDI inflows in 2008, some EMU countries (Spain, Greece, Portugal and Slovenia) recorded an increase in FDI inflows. Also the Czech Republic in the CEE region attracted more FDI in 2010 by using budgetary spending to support them. Inward FDI to Spain more than doubled, to $66 billion, driven by several high-value cross-border M&As, such as the $18 billion acquisition of the Spanish Cigarette producer Altadis by British Imperial Tobacco. FDI inflows also increased in Greece (by 166% to $5.1 billion), Slovenia (by 26% to $1.8 billion) and Portugal (by 16% to $3.5 billion). Spain ranked fourth among the first 10 recipient developed countries (UNCTAD, 2009).
The outward FDI fell to $837 billion in 2008, representing a sharp decline of 30%. As a result, the EU countries’ share in total outward FDI from developed countries dropped to 56% from 66% in 2007. A large fall in equity investments and net divestments in the form of intra-company loans contributed the most to the decline.
attractive for the foreign investors. One, if not the biggest location advantage of the CEE Region compared to Western Europe is the unchanged excellent ratio of productivity to costs of hired labour. Top seven of the most attractive CEE countries shows that Russia is the first, followed by Ukraine, Romania, Turkey, Poland, Belarus, Croatia. Many CEE countries cut down their tax levels to stimulate investments. Bulgaria has the lowest tax on profit and VAT in the region and Romania and Poland are among the countries with the lowest tax levels. Unfortunately, both Bulgaria and Romania couldn’t sustain this fiscal policy with budgetary spending to support investments and FDI decreased. Moreover, in Romania the social and political framework has worsened and the foreign investors became reticent toward investing here.
The majority of German, Austrian and Swiss entrepreneurs appreciate the Central and Eastern European countries (CEE) as being extremely attractive as sales markets and production locations – in spite of the economic crisis and the increasing role of China and India.Romania in particular was nominated by the business people as being the third most surprisingly attractive country, after Russia and Ukraine. Today more than half of the production businesses of Austrian, German and Swiss companies are set on the mature CEE-5 markets and in the Baltic States. Over 20% of the business locations are to be found in the new EU member states Romania and Bulgaria, while the rest spread in the remaining Southern Europe and the GUS-States. Looking into the future we see companies primarily planning to develop their business activities in the GUS states Russia and Ukraine, which are closely followed by Romania, in the third place. The continuously high attractiveness of Romania consists in its interesting mixture of cheap production factors and markets that have partially not been saturated yet, as well as of sufficient political and legal stability – advantages over several other CEE countries. The margin pressure and the competition on the mature CEE-markets like the Czech Republic, Poland and Slovakia become tougher and disparities between these areas and Western Europe as far as products, distribution, advertising and pricing are concerned seem to be in decline (Horvath and Parteners, 2010).
4. CONCLUSIONS
single deals can determine the amount of yearly inflow in all countries. In the CEE countries, outward FDI became more and more significant. In cohesion countries outflows started much before, but also became more intensive (Elteto, 2010). One major concern of developing countries is how to retain existing investment and attract new FDI during the present global recession. Economic stimulation programmes can be an incentive for foreign investment, but many developing countries do not have the financial resources to successfully compete with the investment promotion packages of developed countries. Moreover, incentive-based competition for foreign investment may risk lowering social and environmental standards, which would be detrimental to sustainable development (Arabi, 2010). Once the privatization is over in this region, once the advantage of the low labor unit cost has eroded, the investment programmes for infrastructure may have a positive effect on inward foreign investment provided that they are designed in a non-discriminatory manner and open to foreign investors, just like the Spanish experience shows. From a policy perspective, it would appear that the right approach by governments concerned with attracting foreign direct investment is to use the European funds granted by the EU, to lower corruption and to keep taxes low but to maintain investment in infrastructure rather than using revenue for consumption expenditures and to mix the fiscal policy with the budgetary spending to support investments (Goodspeed et al., 2006).
This increased competition for FDI challenges both in the cohesion countries and in the CEE countries. Many (but not all) of these countries have tried to compete globally on the basis of two primary location advantages: low labour costs and EU membership. As we have discussed above, EU membership is not as much of an advantage in a liberalized, stable and shrinking world where distance does not form as much of a barrier to trade and investment as it once did. For similar reasons, the cost advantage of these countries has also been dissipated in many cases, particularly where productivity gains in China and other Asian economies have grown partly as a result of their superior technological infrastructure. Spain and Portugal have experienced some displacement of FDI or lost sequential FDI because they have not been able to develop location advantages in knowledge- and capital-intensive activities to compensate for the rising labour costs that have eroded their industrial base in low-value-adding activities, a development that also has been observed in CEE countries, where already some production activities have been shifted “further east”.
ICT sectors, although Portugal and Spain have so far failed to make significant moves towards more science-based sectors. Beyond the fact that science-based sectors and knowledge-intensive activities fit the current comparative advantage of these countries, they are also less footloose. This is partly because these sectors tend to rely on location-specific and location-bound assets that are less easily substitutable.
The economies with the most successful technological upgrading – the developing Asian countries – allocated subsidies in what Amsden and Hikino (2000) call a “reciprocal control mechanism”. That is, incentives and subsidies, whether to upgrade technologically, promote local content, expand exports or reduce import-dependence were subject to performance standards that were actively monitored, and in Amsden’s words, were “redistributive in nature and results-oriented” and acted to prevent government failure.
The biggest challenge is that of institutional restructuring, and the move – especially for the CEE countries – away from state ownership of key sectors, and state-defined priorities, which have been achieved in the CEE economies to different degrees, partly as a result of specific funds made available to these countries by the European Commission. On the other hand, these countries are also limited in their competition for FDI by EU policies, particularly those associated with regulation, competition and state aid.
ACKNOWLEDGMENTS
This paper is worked out within POSDRU/89/1.5/S/62988 of 2010 Research Project financed by the European Union. This project is called “Empiric methods for FDIs analysis by stimulating macroeconomic policies and rethinking their role for achieving economic growth in Romania”.
REFERENCES
1. Amsden, A., and Takashi, H., (2000), “The Bark is Worse than the Bite: New WTO Law and Late Industrialization”, Annals of the American Academy of Political and Social Sciences, 570, 104-114.
2. Arabi, U., (2010), “Implications of Global Financial and Economic Crisis on FDI Flows: The Indian Perspective”, Asian Economic Review, vol. 50, no. 3, December 2010, 533-553. 3. Bellak, C., Leibrecht, M., Riedl, A., (2008), “Labour costs and FDI flows into Central and
4. Chislett, W., (2010), “The Way Forward for the Spanish Economy: More Internationalisation”, [Real Instituto Elcano], Working Paper 1, p. 25.
5. Éltető, A., (2010), “Foreign direct investment in Central and East European Countries and Spain – A short overview”, [ICEI WP09/10], pp. 4-17.
6. Éltető, A. and Sass, M., (1998), “Motivations and Behaviour by Hungary's Foreign Investors in Relation to Exports”, [IWE Working Paper], no. 88, p. 23.
7. Gavilan, A., Hernández de Cos, P., Jimeno, J. and Rojas, J., (2011), “Fiscal policy, structural reforms and external imbalances: A quantitative evaluation for Spain”, Banco de Espana, [Documentos de Trabajo], no.1107, pp. 7.
8. Goodspeed, T., Martinez-Vazquez, J., Zhang, L., (2006), “Are Other Government Policies More Important than Taxation in Attracting FDI?”, Andrew Young School of Policy Studies, Research Paper Series, Working Paper 28/2006, New York.
9. Gordo, E., (2008), “La internacionalización de las empresas españolas a través de la inversion extranjera directa”, [Banco de España Boletín Económico], pp. 93-103.
10. Horvath and Parteners,, 2010, “How attractive is Romania for investors”, November 2010, http://rbd.doingbusiness.ro/en/3/latest-articles/1/416/how-attractive-is-romania-for-investors 11. Ionita, L. and Pauwels, S., (2008), “FDI in Romania: From low-wage competition to higher
valueadded sectors European Commission”, [ECOFIN Country Focus], vol. 5 Issue 3, pp. 235-241.
12. Lankes, H.P. and Venables, A.J., (1996), “Foreign Direct Investment in Eastern Europe and the Former Soviet Union: Results from a survey of investors”, [EBRD, Working Paper], p. 146.
13. Narula, R. and Bellak, C., (2009), “EU enlargement and consequences for FDI assisted industrial development”, [Transnational Corporations],vol. 18, no. 2, pp. 201-214.
14. Osafoğlu, B.; Gökçe, D.; Özkan, N.; Gülderen, N.; Yaman, B. (2008) “Turkey – EU relations. Foreign direct investment in the European Union and Turkey”, Izmir University, Turkey. 15. Resmini, L., (2005), “The Role of FDI in Industrial Relocation and Regional Development”,
[EURECO Workpackage], no. 4, pp. 32-47.
16. UNCTAD, (2010), “Statistics - FDI Database 2000-2010”, United Nations: New York and Geneva.