Brain Amyloid Deposition and Longitudinal
Cognitive Decline in Nondemented Older
Subjects: Results from a Multi-Ethnic
Population
Yian Gu1*, Qolamreza R. Razlighi2, Laura B. Zahodne1, Sarah C. Janicki3, Masanori Ichise4, Jennifer J. Manly1,2,3, D. P. Devanand5, Adam M. Brickman1,2,3, Nicole Schupf1,2,6, Richard Mayeux1,2,3,6, Yaakov Stern1,2,3
1The Taub Institute for Research in Alzheimer’s Disease and the Aging Brain, Columbia University, New York, New York, United States of America,2The Department of Neurology, Columbia University, New York, New York, United States of America,3The Gertrude H. Sergievsky Center, Columbia University, New York, New York, United States of America,4Department of Radiology, Columbia University Medical College, New York, New York, United States of America,5Department of Psychiatry, Columbia University College of Physicians and Surgeons, New York, New York, United States of America,6The Division of Epidemiology, Joseph P. Mailman School of Public Health, Columbia University, New York, New York, United States of America
Abstract
Objective
We aimed to whether the abnormally high amyloid-β(Aβ) level in the brain among apparent-ly healthy elders is related with subtle cognitive deficits and/or accelerated cognitive decline.
Methods
A total of 116 dementia-free participants (mean age 84.5 years) of the Washington Heights Inwood Columbia Aging Project completed 18F-Florbetaben PET imaging. Positive or neg-ative cerebral Aβdeposition was assessed visually. Quantitative cerebral Aβburden was calculated as the standardized uptake value ratio in pre-established regions of interest using cerebellar cortex as the reference region. Cognition was determined using a neuro-psychological battery and selected tests scores were combined into four composite scores (memory, language, executive/speed, and visuospatial) using exploratory factor analysis. We examined the relationship between cerebral Aβlevel and longitudinal cognition change up to 20 years before the PET scan using latent growth curve models, controlling for age, education, ethnicity, and Apolipoprotein E (APOE) genotype.
Results
Positive reading of Aβwas found in 41 of 116 (35%) individuals. Cognitive scores at scan time was not related with Aβ. All cognitive scores declined over time. Aβpositive reading OPEN ACCESS
Citation:Gu Y, Razlighi QR, Zahodne LB, Janicki SC, Ichise M, Manly JJ, et al. (2015) Brain Amyloid Deposition and Longitudinal Cognitive Decline in Nondemented Older Subjects: Results from a Multi-Ethnic Population. PLoS ONE 10(7): e0123743. doi:10.1371/journal.pone.0123743
Academic Editor:Paul B. Rosenberg, Johns Hopkins School of Medicine, UNITED STATES
Received:July 1, 2014
Accepted:March 5, 2015
Published:July 29, 2015
Copyright:© 2015 Gu et al. This is an open access article distributed under the terms of theCreative Commons Attribution License, which permits unrestricted use, distribution, and reproduction in any medium, provided the original author and source are credited.
(B = -0.034, p = 0.02) and higher Aβburden in temporal region (B = -0.080, p = 0.02) were associated with faster decline in executive/speed. Stratified analyses showed that higher Aβdeposition was associated with faster longitudinal declines in mean cognition, language, and executive/speed in African-Americans or in APOEε4 carriers, and with faster memory decline in APOEε4 carriers. The associations remained significant after excluding mild cog-nitive impairment participants.
Conclusions
High Aβdeposition in healthy elders was associated with decline in executive/speed in the decade before neuroimaging, and the association was observed primarily in African-Ameri-cans and APOEε4 carriers. Our results suggest that measuring cerebral Aβmay give us im-portant insights into the cognitive profile in the years prior to the scan in cognitively normal elders.
Introduction
A hallmark of Alzheimer’s disease (AD), the leading cause of dementia in the elderly, is the de-posit of amyloid-β(Aβ) in the brain. However, postmortem studies have found approximately 30% of cognitively normal elderly also show Aβdeposition in the brain [1–3]. Similar to patho-logical data, a 20%~30% prevalence of Aβdeposition in brain has been seen among cognitively normal, asymptomatic elderly using in vivo positron emission tomography (PET) imaging of radioligands that bind to fibrillar Aβin amyloid plaques[4–7].
It has been hypothesized that Aβdeposition in the brain is an early event in the pathogene-sis of AD [8], and that clinically normal individuals with Aβdeposits might be in a preclinical, prodromal stage of AD [9]. Supporting this hypothesis, several prospective studies [10–13] found that healthy older adults with higher cerebral Aβhad a faster cognitive decline following PET imaging than those with lower cerebral Aβduring 18-month follow up. However, other studies have reported that cognitively healthy older adults with high cerebral Aβwere not dif-ferent from those with low cerebral Aβon the rate of cognitive change over 24 months[14,15]. In addition, cross-sectional studies [16] have also yielded inconsistent results, with some stud-ies finding that Aβpositive healthy individuals have worse cognitive performance[7,17–19] and others reporting no association [4,6,20–24]. Thus, it remains unclear whether the abnor-mally high Aβlevel in the brain among apparently healthy elderly people indicates an underly-ing subtle cognitive deficit and/or accelerated cognitive decline.
As currently prospective amyloid PET data do not have long duration of follow-up, examin-ing cognitive trajectory before PET imagexamin-ing is a useful way to help understand the implications of cerebral Aβdeposition on cognition among non-demented subjects. Several retrospective longitudinal studies [25–29] have consistently found among apparently normal elders that, compared to individuals with Aβnegative or lower levels of Aβ, individuals with positive or higher levels of Aβhad faster cognitive decline over a period of time prior to scanning. While the findings from these retrospective longitudinal studies seem to be quite consistent, most of the studies included predominantly a single ethnic group of European origin[25–29]. Little is known about whether cerebral Aβis associated different patterns of cognitive change over time among other ethnic groups such as African-Americans. In addition, except for one study[29], previous studies have primarily included non-demented younger-old participants who were based are not freely available in the manuscript,
supplemental files, or in a public repository, a Limited Data Set is available under a standard HIPAA Data Use Agreement, subject to review and approval by the Columbia University Privacy Officer. Requests for data should be submitted to the corresponding author,[email protected].
Funding:The study was supported by NIH grants AG037212, AG007370, AG034189, and AG042483. Radioligand was provided through a grant from Piramal. The funders had no role in study design, data collection and analysis, decision to publish, or preparation of the manuscript.
Competing Interests:Dr. Ichise has been a consultant for Piramal, Navidea Biopharmaceuticals, and Molecular Neuroimaging Institute and has received research support and/or consultancy fees. Dr. Manly serves on the Medical and Scientific Advisory Board of the Alzheimer's Association. She serves on the US Department of Health and Human Services Advisory Council on Alzheimer's Research, Care and Services. Her scientific work is funded by grants from NIH and the Alzheimer's Association. Dr. Devanand has served as a consultant to AbbVie and Lundbeck. Dr. Brickman is on the Scientific Advisory Boards and serves as a paid consultant for ProPhase, LLC and Keystone Heart, LLC. He serves on the Board of Directors of the International Neuropsychological Society, which has paid for his travel to annual meetings. He is supported by grants from NIH, the Groff Foundation, Mars Inc, and Columbia University. Dr. Stern was on the advisory committee for Janssen Alzheimer Immunotherapy Research & Development, LLC. He serves on the Advisory Board for AbbVie, Inc, and is a consultant for Eli Lilly, Takeda, and Piramal. His scientific work is funded by NIH grants R01AG007370,
65–80 years old[25–28]. Since AD is highly age-related[30], it is also important to know wheth-er thwheth-ere is similar, or highwheth-er, prevalence of cwheth-erebral Aβdeposition in non-demented older-old individuals and whether such deposition has similar implications regarding the cognitive change in the preceding years.
In this study, we evaluated the prevalence and level of Aβdeposition using18F-Florbetaben in a multi-ethnic elderly population with an average age of nearly 85 years, and examined whether individuals with higher brain level of Aβdeposition had faster rate of cognitive decline than those with lower levels of brain Aβdeposition in the decade prior to scanning.
Methods
Study Participants
Subjects were selected from those participating in the Washington Heights Inwood Columbia aging project (WHICAP). The WHICAP participants were identified from a probability sam-ple of Medicare beneficiaries aged 65 or older, residing in northern Manhattan[31]. The initial sample for this study included 2,776 participants of the ongoing WHICAP II cohort. Briefly, at entry, trained examiners obtained each participant’s demographic information, medical and neurological history, and conducted a standardized physical and neurological examination. Participants were followed at intervals of approximately 1.5 years, repeating all the evaluations. Consensus diagnoses were made by a team of neuropsychologists and neurologists based on standard research criteria[32]. The diagnosis of mild cognitive impairment (MCI) in this co-hort has been described elsewhere[33] and was based on Petersen [34] criteria.
Since 2004, we systematically collected high-resolution magnetic resonance imaging (MRI) data on 769 dementia-free WHICAP II participants. Detailed description of the neuroimaging subsample can be found in our previous report[35]. In 2009, we began to measure brain Aβ
burden using a PET tracer with the goal of imaging 728 participants who were free of dementia at their previous visit. The subjects who participated so far in the ongoing PET study (n = 125) were younger at the time of their first magnetic resonance imaging (MRI) scan (mean age 79.2 vs. 80.3 years, p = 0.01), had more years of education (12.4 vs. 10.4 years, p = 0.0001), and were less likely to be Hispanics (21% vs 39%; p<0.0001) than those without PET scans (n = 603). Those with and without PET scan were not different in terms of their gender, apolipoprotein
ε4 (APOE) status, or comorbidities (hypertension, diabetes, or heart disease). A total of 9 par-ticipants who were diagnosed with dementia around the time of the PET imaging were further excluded from the analysis. Thus, the current analysis included 116 dementia-free participants. The subjects had been followed up for an average of 11.8 years (range 3.2 to 20.4 years) with 5.68 visits (2 to 11 visits) prior to the PET scan.
The Columbia University Institutional Review Board has reviewed and approved this proj-ect. All individuals provided written informed consent.
Cognitive evaluation
complete the tasks were used as the dependent measures. Visuospatial ability was assessed with the Rosen Drawing Test[43], the BVRT–Matching[38], and the Identities and Oddities subtest of the Mattis Dementia Rating Scale[44].
Means and standard deviations (SD) were calculated from baseline scores for non-demented WHICAP subjects controlling for age, race/ethnicity, and years of education. Z-scores for each of the cognitive measures were calculated and then averaged to create a composite Z-score for each of the four domains. These factor domain scores were subsequently averaged to produce a composite“mean cognition”z-score. A higher z-score indicates better cognitive performance.
Image Acquisition, Processing, and Analysis
18
F-Florbetaben. All image processing and analyses were conducted by persons blinded to the clinical status and cognitive test results of participants. Participant preparation consisted of intravenous catheterization followed by the bolus injection (over 10–20 sec) of 10 mCi of
18F-Florbetaben. The PET scans were acquired over a period of 20 minutes in 4×5 minute
frames on an MCT PET/CT scanner (Siemens) in dynamic, 3D imaging mode beginning 50 min after injection of18F- Florbetaben. Transmission scans were done prior to the scan. An ac-companying structural CT scan (in-plane resolution = 0.58×0.58 mm, slice thickness = 3mm, field of view = 29.6×29.6 cm2, number of slices = 75) was also acquired in the same machine at the same time as the PET scan.
Visual rating. We used a method similar to that of Barthel and colleagues [45] for the vi-sual classification of brain Aβdeposition. This approach has also been used in the blinded reads of phase 3 trials [46]. The visual assessment was based on the PET scans alone without co-registration of MRI brain scans. Florbetaben binding in the specific regions [frontal cortex (FRC); temporal cortex (TMP); parietal cortex (PAR); cingulate gyrus (CG); and occipital cor-tex] were rated as visual Aβ(vAβ) positive if the activity was greater than that in the adjacent white matter, otherwise vAβnegative. The subject received a positive Aβreading if any of the regions was considered as positive. Two readers (SJ and MI) worked independently, blind to all clinical data, cognitive test results, and the quantitative Aβmeasures (see below) of the partici-pants. After the independent reads, discordant cases (17%) were reviewed by the two readers together to reach a consensus. The overall Kappa was 0.61, suggesting a fair to good agreement between the readers[47].
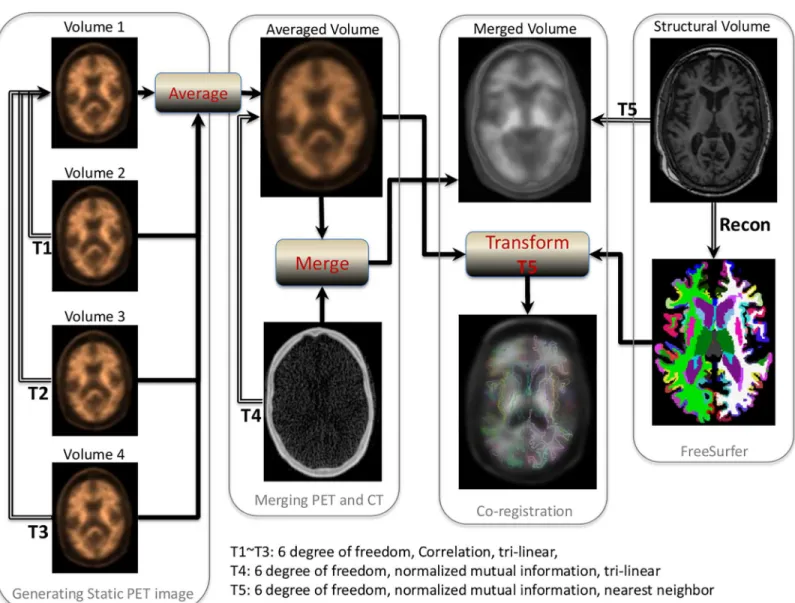
Quantitative image analysis. Each participant received a brain MRI using a 1.5T Philips Intera scanner (TR/TE 20/2.1 ms/ Flip angle 20 deg/ 256 x 256 matrix / acquisition time 8’09”/ 1.3 mm slice thickness/ 105 slices). FreeSurfer (http://surfer.nmr.mgh.harvard.edu/), the MRI software package comprising a suite of automated tools for segmentation, reconstruction, and derivation of regional volumes and surface-based rendering, was used for derivation of re-gions-of-interest (ROI). In total, 95 ROIs masks (35x2 cortical, 23 subcortical, and cerebellar gray matter and white matter) were extracted from the structural T1 image. Four set of non-overlapping ROIs were selected: FRC; TMP; PAR; and CG for the statistical analyses.
PET image space using nearest neighbor interpolation. These 4 regional masks in static PET space were used to extract the regional PET data. The procedures are summarized inFig 1.
The standardized uptake value, defined as the decay-corrected brain radioactivity concen-tration normalized for injected dose and body weight, was calculated at selected regions. The standardized uptake value was then normalized to cerebellum to derive the standardized up-take value ratio (SUVR), which was the measurement used in the analyses. Analyses incorpo-rated both the individual ROIs (including TMP, PAR, CG, and FRC) and an overall mean value of amyloid burden across the ROIs. The T1 scan was not available for 11 subjects so SUVR could not be calculated and we included the remaining 105 subjects in the analysis in-volving SUVR.
Covariates
Information about birthdate, sex, education, and ethnicity was obtained from baseline inter-views. Age (years) at time of scan was calculated and used as a continuous variable. Education (years) was used as a continuous variable. Ethnic group was based on self-report using the for-mat of the 2000 U.S. census. Participants were then assigned to one of four groups: African American (non-Hispanic), Hispanic, White (non-Hispanic) or Other. Two dummy variables were created to indicate the three major ethnic groups (White, African-American, and Hispan-ic, with White as the reference group). Sex was used as a dichotomous variable with male as the reference. APOEε4 genotype was treated as a dichotomous variable: absence (as reference) versus presence of either 1 or 2ε4 alleles.
Statistical Analysis
The cross-sectional associations between AβSUVR values and cognitive scores at the time of scan acquisition were examined using multivariable linear regression models, adjusted for age, gender, education, ethnicity, and APOEε4 genotype.
We used latent growth curve models [48] to test whether the rate of cognitive decline in neuropsychological test scores varied according to Aβstatus (positive or negative by visual reading, quantitative SUVR level). We modeled cognitive trajectories over these 5 visits leading up to the PET scan. Time was parameterized as years since the initial visit. Models were initially unadjusted, and then adjusted for age, sex, education, ethnicity, and APOE genotype. As we were particularly interested in whether the PET Aβlevel-associated difference of cognitive tra-jectories varied by gender, ethnic groups, and APOE genotype, we decided a priori to perform stratified analysis by subgroups of gender, ethnicity, and APOE genotype.
MCI is often a prodromal stage of AD. Thus subjects having MCI might be different than the cognitively normal subjects in terms of their clinical, cognitive, and brain pathological sta-tus, as well as the relationship among these factors. To examine the relationship between PET Aβand cognitive change among cognitively healthy aging subjects only, we performed sensitiv-ity analysis by excluding participants who were diagnosed with MCI at the time of PET scan.
Statistical analyses were performed in SPSS (version 18) and M-plus version 7. All p-values were based on two-sided tests with significance level set at 0.05.
Results
Demographic/clinical characteristics and PET A
β
SUVR values globally and in each of the ROIs (Table 1). Global AβSUVR and AβSUVR in the ROIs were all highly correlated (correlation coefficients>0.9 and p<0.0001 for all).
Participants who had positive vAβwere older and were more likely to carry at least one APOEε4 allele, compared with those with negative vAβ(Table 1).
SUVR values tended to increase with increasing age, although not significantly (Pearson’s correlation coefficients of age with global, FRC, TMP, PAR, and CG were r = 0.16, p = 0.11; r = 0.15, p = 0.14; r = 0.13, p = 0.18; r = 0.18, p = 0.07; r = 0.16, p = 0.10, respectively.). Partici-pants with one or two APOEε4 alleles had significantly higher SUVR than those withoutε4 al-lele globally and in each region (Table A inS1 File). Women tended to have higher SUVR than men globally and in all regions except for FRC (Table A inS1 File). For both males and females, those who had positive vAβhad higher AβSUVR (Table B inS1 File).
Fig 1. Procedures for quantitative PET amyloid analysis.
Cross-sectional analysis
The cognitive scores did not differ between participants with positive and negative vAβ
(Table 1) and were not correlated with any of the AβSUVR values (correlation coefficients were among the range of -0.1 to 0.1, and were not significant). Multivariable regression analysis adjusted for age at scan, sex, education, ethnicity, and APOE also showed that there was no as-sociation between any of the cognitive scores and PET Aβ(Table C inS1 File).
Longitudinal analysis
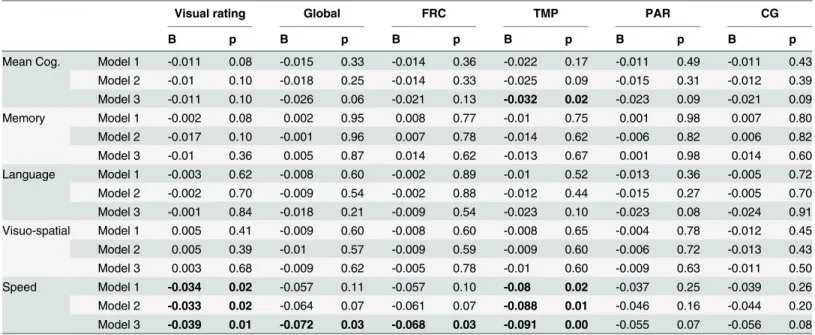
All cognitive z-scores declined significantly over time during the follow-up period before imag-ing (all unadjusted p<0.0001 except for visuospatial which had p = 0.014). Subjects with posi-tive vAβdeclined in executive/speed at a rate that was 0.034 points/year greater than that of subjects with negative vAβ(Table 2). Higher Aβburden in the temporal region were associated with faster decline in speed (one unit increase in SUVR values was associated with 0.080 points/year faster decline) (Table 2). PET Aβwas not associated with decline rate of other cog-nitive scores. Additionally adjusting for MCI status did not change the results materially (Table 2).
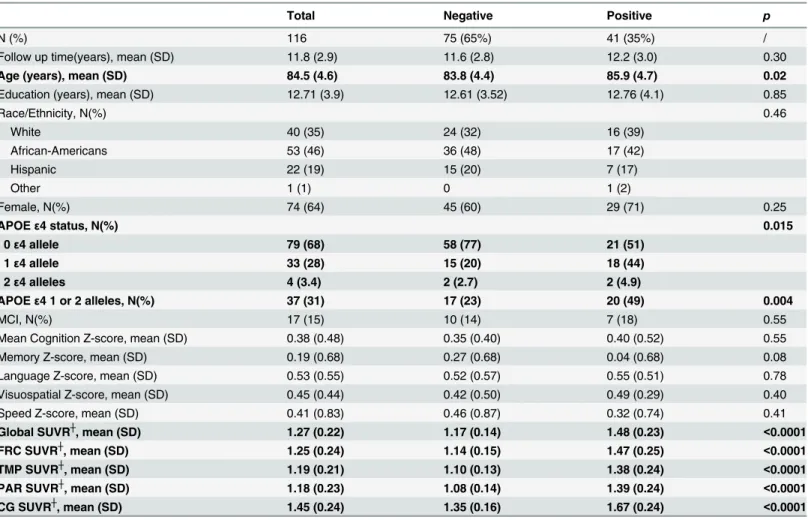
Table 1. Characteristics of study participants according to negative or positive visual reading of brain Aβimaging.
Total Negative Positive p
N (%) 116 75 (65%) 41 (35%) /
Follow up time(years), mean (SD) 11.8 (2.9) 11.6 (2.8) 12.2 (3.0) 0.30
Age (years), mean (SD) 84.5 (4.6) 83.8 (4.4) 85.9 (4.7) 0.02
Education (years), mean (SD) 12.71 (3.9) 12.61 (3.52) 12.76 (4.1) 0.85
Race/Ethnicity, N(%) 0.46
White 40 (35) 24 (32) 16 (39)
African-Americans 53 (46) 36 (48) 17 (42)
Hispanic 22 (19) 15 (20) 7 (17)
Other 1 (1) 0 1 (2)
Female, N(%) 74 (64) 45 (60) 29 (71) 0.25
APOEε4 status, N(%) 0.015
0ε4 allele 79 (68) 58 (77) 21 (51)
1ε4 allele 33 (28) 15 (20) 18 (44)
2ε4 alleles 4 (3.4) 2 (2.7) 2 (4.9)
APOEε4 1 or 2 alleles, N(%) 37 (31) 17 (23) 20 (49) 0.004
MCI, N(%) 17 (15) 10 (14) 7 (18) 0.55
Mean Cognition Z-score, mean (SD) 0.38 (0.48) 0.35 (0.40) 0.40 (0.52) 0.55
Memory Z-score, mean (SD) 0.19 (0.68) 0.27 (0.68) 0.04 (0.68) 0.08
Language Z-score, mean (SD) 0.53 (0.55) 0.52 (0.57) 0.55 (0.51) 0.78
Visuospatial Z-score, mean (SD) 0.45 (0.44) 0.42 (0.50) 0.49 (0.29) 0.40
Speed Z-score, mean (SD) 0.41 (0.83) 0.46 (0.87) 0.32 (0.74) 0.41
Global SUVR┼, mean (SD) 1.27 (0.22) 1.17 (0.14) 1.48 (0.23) <0.0001
FRC SUVR┼, mean (SD) 1.25 (0.24) 1.14 (0.15) 1.47 (0.25) <0.0001
TMP SUVR┼, mean (SD) 1.19 (0.21) 1.10 (0.13) 1.38 (0.24) <0.0001
PAR SUVR┼, mean (SD) 1.18 (0.23) 1.08 (0.14) 1.39 (0.24) <0.0001
CG SUVR┼, mean (SD) 1.45 (0.24) 1.35 (0.16) 1.67 (0.24) <0.0001
┼Limit to 105 subjects who had both clinical reading (72 negative and 33 positive readings) and quantitative data.
Stratified analyses by APOE
ε
4 genotype, ethnic groups, or gender
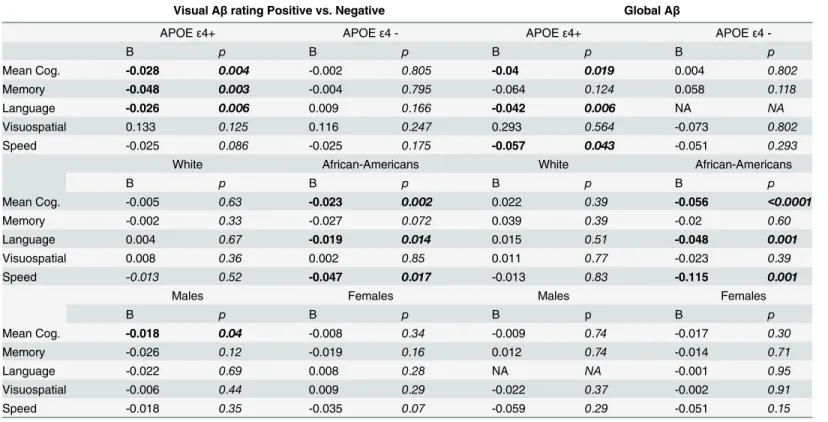
Stratified analysis showed that vAβpositivity, higher level of global Aβdeposition or Aβ depo-sition in each of the four ROIs (data not shown), was associated with a larger amount of annual decline on mean cognition, language, and executive/speed scores in African-Americans but not in Whites (Table 3), and in APOEε4 carriers but not in APOEε4 negative subjects (Table 3). Aβdeposition was also related with a faster decline in memory in APOEε4 carriers, but not in APOEε4 negative subjects (Table 3). The sample size of Hispanics was too small to yield trust-worthy parameter estimation from the latent growth curve models. We found positive vAβwas associated with faster decline in mean cognition in males only. The vAβand global AβSUVR were not associated with other cognitive score decline rate in either males or females (Table 3).
Sensitivity analysis
We compared the demographic, clinical, cognitive, and brain pathological profiles of MCI with that of cognitively normal participants (Table D inS1 File). As expected, the MCI subjects in general started with significantly lower cognitive performance than the non-MCI subjects, and their cognitive scores were also much lower than non-MCI subjects at the time of the scan visit. There were no difference of demographic, genetic, and Aβstatus between MCI and non-MCI subjects, except that no Hispanics had MCI while 14.5% of Whites and 15.1% of African-Americans had MCI.
After excluding 17 MCI participants from the analysis, we found the results remained simi-lar to the main analysis, although the associations were slightly stronger compared to the re-sults when MCI subjects were included (Table 2).
Table 2. Brain Aβin relation to the rate of cognitive decline during the decade prior to PET scan among non-demented participants.
Visual rating Global FRC TMP PAR CG
B p B p B p B p B p B p
Mean Cog. Model 1 -0.011 0.08 -0.015 0.33 -0.014 0.36 -0.022 0.17 -0.011 0.49 -0.011 0.43 Model 2 -0.01 0.10 -0.018 0.25 -0.014 0.33 -0.025 0.09 -0.015 0.31 -0.012 0.39 Model 3 -0.011 0.10 -0.026 0.06 -0.021 0.13 -0.032 0.02 -0.023 0.09 -0.021 0.09
Memory Model 1 -0.002 0.08 0.002 0.95 0.008 0.77 -0.01 0.75 0.001 0.98 0.007 0.80
Model 2 -0.017 0.10 -0.001 0.96 0.007 0.78 -0.014 0.62 -0.006 0.82 0.006 0.82
Model 3 -0.01 0.36 0.005 0.87 0.014 0.62 -0.013 0.67 0.001 0.98 0.014 0.60
Language Model 1 -0.003 0.62 -0.008 0.60 -0.002 0.89 -0.01 0.52 -0.013 0.36 -0.005 0.72
Model 2 -0.002 0.70 -0.009 0.54 -0.002 0.88 -0.012 0.44 -0.015 0.27 -0.005 0.70 Model 3 -0.001 0.84 -0.018 0.21 -0.009 0.54 -0.023 0.10 -0.023 0.08 -0.024 0.91 Visuo-spatial Model 1 0.005 0.41 -0.009 0.60 -0.008 0.60 -0.008 0.65 -0.004 0.78 -0.012 0.45
Model 2 0.005 0.39 -0.01 0.57 -0.009 0.59 -0.009 0.60 -0.006 0.72 -0.013 0.43
Model 3 0.003 0.68 -0.009 0.62 -0.005 0.78 -0.01 0.60 -0.009 0.63 -0.011 0.50
Speed Model 1 -0.034 0.02 -0.057 0.11 -0.057 0.10 -0.08 0.02 -0.037 0.25 -0.039 0.26
Model 2 -0.033 0.02 -0.064 0.07 -0.061 0.07 -0.088 0.01 -0.046 0.16 -0.044 0.20 Model 3 -0.039 0.01 -0.072 0.03 -0.068 0.03 -0.091 0.00 -0.055 0.07 -0.056 0.08
Results from latent growth curve models. B weights were the estimates for the association between Aβand cognitive change. A positive B indicated that having higher level of Aβdeposition (or positive compared to negative vAβ) was associated with less annual decline in cognitive scores, while a negative B indicated faster decline. Model 1: All subjects, adjusted for age at PET scan, gender, ethnicity, education, APOEε4 genotype. Model 2: All subjects, adjusted for above covariates and MCI status. Model 3: Sensitivity analysis: Healthy aging subjects only (excluding 17 MCI subjects), adjusted for age at PET scan, gender, ethnicity, education, APOEε4 genotype.
Discussion
In this multiethnic, non-demented elderly population, we found participants with higher load of Aβdepositions experienced an accelerated decline in executive/speed in the decade prior to the scan. Furthermore, we found the association between Aβdeposition and cognitive trajecto-ry only among African-Americans or among APOEε4 positive subjects.
Approximately 35% of the study participants had positive Aβdepositions according to visu-al reading of the PET scans, a proportion similar to other reports of Aβdeposition in healthy elderly based on either imaging techniques or postmortem pathological analysis [1–7]. Besides being slightly older, these vAβpositive subjects were more likely to have APOEε4 allele than those with negative visual Aβreadings. These findings are consistent with previous reports[25–
29]. We found the average retention ratio of Aβin the four ROIs compared to cerebellum were
1.27, similar to what has been reported in other populations using florbetaben[24,45] or PiB [27,28].
A recent meta-analysis revealed mixed evidence for cross-sectional association between cog-nitive function and Aβdeposition, although small effects on episodic memory or global cogni-tion were found according to amyloid burden[16]. In our cross-seccogni-tional analysis, Aβburden in general was not associated with concurrent cognitive scores. This null association has also been reported by previous studies either using florbetaben [24] or PiB Aβ[4,21] as the PET Table 3. Brain Aβin relation to the rate of cognitive decline during the decade prior to PET scan among non-demented participants, stratified by APOEε4 genotype, ethnicity, and gender.
Visual Aβrating Positive vs. Negative Global Aβ
APOEε4+ APOEε4 - APOEε4+ APOEε4
-B p B p B p B p
Mean Cog. -0.028 0.004 -0.002 0.805 -0.04 0.019 0.004 0.802
Memory -0.048 0.003 -0.004 0.795 -0.064 0.124 0.058 0.118
Language -0.026 0.006 0.009 0.166 -0.042 0.006 NA NA
Visuospatial 0.133 0.125 0.116 0.247 0.293 0.564 -0.073 0.802
Speed -0.025 0.086 -0.025 0.175 -0.057 0.043 -0.051 0.293
White African-Americans White African-Americans
B p B p B p B p
Mean Cog. -0.005 0.63 -0.023 0.002 0.022 0.39 -0.056 <0.0001
Memory -0.002 0.33 -0.027 0.072 0.039 0.39 -0.02 0.60
Language 0.004 0.67 -0.019 0.014 0.015 0.51 -0.048 0.001
Visuospatial 0.008 0.36 0.002 0.85 0.011 0.77 -0.023 0.39
Speed -0.013 0.52 -0.047 0.017 -0.013 0.83 -0.115 0.001
Males Females Males Females
B p B p B p B p
Mean Cog. -0.018 0.04 -0.008 0.34 -0.009 0.74 -0.017 0.30
Memory -0.026 0.12 -0.019 0.16 0.012 0.74 -0.014 0.71
Language -0.022 0.69 0.008 0.28 NA NA -0.001 0.95
Visuospatial -0.006 0.44 0.009 0.29 -0.022 0.37 -0.002 0.91
Speed -0.018 0.35 -0.035 0.07 -0.059 0.29 -0.051 0.15
Results from latent growth curve models, adjusted for age at PET scan, sex, gender, ethnicity, education, and APOEε4 genotype, except for the variable in stratification. B weights were the estimates for the association between Aβand cognitive change. A positive B indicated that having higher level of Aβ deposition (or positive compared to negative vAβ) was associated with less annual decline in cognitive scores, while a negative B indicated faster decline. NA: trustworthy parameter estimation was Not Available.
tracer. While it is possible that amyloid status in healthy elderly provides no direct link with the cognitive profile, there are other potential reasons. For example, although in normal older individuals Aβdeposition may be the earliest pathological event before clinical decline, tau or other pathophysiologic processes such as brain atrophy may also be involved[28]. Thus, cogni-tive variation may be associated with the combined effects of all these physiopathological indi-cators but not a single one of them.
We found that Aβburden was associated with more rapid decline in executive/speed in the years prior to Aβimaging in an older population with an average age of 85. This finding is con-sistent with previous reports of higher PET Aβbeing associated with greater decline in execu-tive functions[27,29]. Previous studies have also found higher Aβburden was associated with steeper trajectories of verbal memory [27], visual memory[29], semantic fluency[29], working memory[26], and visuospatial ability[26] in non-demented elderly. An early study[25] found clinically defined cognitively‘declining’subjects were much more likely to show cortical PiB binding than‘stable’subjects. Landau and colleagues found that subjects with positive florbeta-pir declined significantly faster than those with negative florbetaflorbeta-pir on Cognitive subscale of the Alzheimer’s Disease Assessment Scale [28]. Thus, our results add to the existing body of ev-idence that Aβdeposition in the brain might be associated with preceding cognitive trajectory. Nevertheless, results were not always consistent. For example, association of Aβwith visual memory was found in one[29] but in another other study[27]. Furthermore, the use of different measures of cognition and different tracers precludes a direct comparison of the findings across studies. With regard to regional Aβdeposition, we found significant associations between de-cline in executive/speed and Aβdeposition in the temporal region, a region that was also re-ported in a previous study[27]. The Aβdeposition in the frontal region, the region that is involved for executive/speed function[49], was also associated with executive/speed among cognitively normal subjects.
In the sensitivity analysis by excluding subjects who were considered as MCI at the time of scan visit, we found positive vAβ, higher AβSUVR in global, FRC, and TMP regions were asso-ciated with faster decline in executive/speed score, and SUVR values in the TMP region was as-sociated with faster decline in mean cognition. The associations seemed to be even slightly stronger compared to the results from the entire study population. The exact reason is un-known. It may not simply be due to the lower starting cognition score positioning the MCI subjects less room to deteriorate, as MCI subjects continued to decline over time. Other poten-tial explanation could be that, Aβpresence triggers the cascade of cognitive decline in cogni-tively healthy subjects, while for subjects who developed MCI, the initial cognitive decline has already happened and the continued decline depends less on Aβburden but more on other pathological changes such as Tau or structural brain changes[50]. Nevertheless, these hypothe-ses need to be tested in future studies.
Some limitations of the current study need to be noted. Our study did not examine whether brain Aβdeposit is associated with future cognitive change. However, prospective follow-up of these participants is ongoing, and future data on cognitive assessments will assist us in under-standing the relationship between brain Aβand subsequent cognitive change. Secondly, we had a smaller percent of Hispanic participants in the current study sample than the overall WHICAP population, and due to the small number of Hispanic subjects we were not able to es-timate the association between Aβand cognitive change. More Hispanic participants will be re-cruited into the imaging study in the future in order to extrapolate the results to the source community population. The interreader agreement for vAβwas not perfect and might be lower than some other studies[54–56]. However, the potential misclassification might have biased the results toward an inflated type II error rather than a false positive result (type I error). Thus, despite imperfect vAβagreement, our confidence remains with regard to the significant association between vAβand cognitive decline.
Our study has many strengths. While most of the previous studies examining cognition and PET Aβincluded predominantly a single race/ethnicity group (mainly Whites), our study in-cluded an ethnically diverse community-based population. Furthermore, separate estimates of the association between Aβand cognitive change were made for both Whites and African Americans. Our study covered an extended period of time for the cognitive change. We used composite cognitive scores based on our previous factor analysis, thus less likely to be limited by the floor or ceiling effects seen in many individual tests. Consensus diagnosis of dementia and MCI was determined according to standard research criteria. Finally, measures for multi-ple potential confounding factors have been carefully recorded and adjusted in the analyses.
Taken together, our results suggest that positive or greater burden of Aβin the brain is asso-ciated with accelerated decline in executive/speed function in the years prior to the PET scan-ning. In addition, our findings suggest further investigation of the implication of PET Aβ
deposition on cognition, while taking into account factors such as ethnicity and APOE genotype.
Supporting Information
S1 File. Supplementary tables. (DOCX)
Author Contributions
Conceived and designed the experiments: YG YS. Performed the experiments: QRR SCJ MI YS. Analyzed the data: YG LBZ. Wrote the paper: YG. Collected data: JJM AMB NS RM YS. Provided significant advice and consultation: JJM DPD AMB NS RM YS. Provided critical re-view of the manuscript: QRR LBZ SCJ MI JJM DPD AMB NS RM YS.
References
1. Benedetti B, Charil A, Rovaris M, Judica E, Valsasina P, Sormani MP, et al. Influence of aging on brain gray and white matter changes assessed by conventional, MT, and DT MRI. Neurology. 2006; 66: 535–539. PMID:16505308
2. Knopman DS, Parisi JE, Salviati A, Floriach-Robert M, Boeve BF, Ivnik RJ, et al. Neuropathology of cognitively normal elderly. J Neuropathol Exp Neurol. 2003; 62: 1087–1095. PMID:14656067 3. Price JL, McKeel DW Jr, Buckles VD, Roe CM, Xiong C, Grundman M, et al. Neuropathology of
4. Mintun MA, Larossa GN, Sheline YI, Dence CS, Lee SY, Mach RH, et al. [11C]PIB in a nondemented population: potential antecedent marker of Alzheimer disease. Neurology. 2006; 67: 446–452. PMID: 16894106
5. Rowe CC, Ng S, Ackermann U, Gong SJ, Pike K, Savage G, et al. Imaging beta-amyloid burden in aging and dementia. Neurology. 2007; 68: 1718–1725. PMID:17502554
6. Aizenstein HJ, Nebes RD, Saxton JA, Price JC, Mathis CA, Tsopelas ND, et al. Frequent amyloid depo-sition without significant cognitive impairment among the elderly. Arch Neurol. 2008; 65: 1509–1517. doi:10.1001/archneur.65.11.1509PMID:19001171
7. Pike KE, Ellis KA, Villemagne VL, Good N, Chetelat G, Ames D, et al. Cognition and beta-amyloid in preclinical Alzheimer's disease: data from the AIBL study. Neuropsychologia. 2011; 49: 2384–2390. doi:10.1016/j.neuropsychologia.2011.04.012PMID:21529702
8. Jack CR Jr., Knopman DS, Jagust WJ, Petersen RC, Weiner MW, Aisen PS, et al. Tracking pathophys-iological processes in Alzheimer's disease: an updated hypothetical model of dynamic biomarkers. Lancet Neurol. 2013; 12: 207–216. doi:10.1016/S1474-4422(12)70291-0PMID:23332364
9. Price JL, Morris JC. Tangles and plaques in nondemented aging and "preclinical" Alzheimer's disease. Ann Neurol. 1999; 45: 358–368. PMID:10072051
10. Lim YY, Ellis KA, Pietrzak RH, Ames D, Darby D, Harrington K, et al. Stronger effect of amyloid load than APOE genotype on cognitive decline in healthy older adults. Neurology. 2012; 79: 1645–1652. doi:10.1212/WNL.0b013e31826e9ae6PMID:23071163
11. Doraiswamy PM, Sperling RA, Coleman RE, Johnson KA, Reiman EM, Davis MD, et al. Amyloid-beta assessed by florbetapir F 18 PET and 18-month cognitive decline: a multicenter study. Neurology. 2012; 79: 1636–1644. doi:10.1212/WNL.0b013e3182661f74PMID:22786606
12. Kawas CH, Greenia DE, Bullain SS, Clark CM, Pontecorvo MJ, Joshi AD, et al. Amyloid imaging and cognitive decline in nondemented oldest-old: the 90+ Study. Alzheimers Dement. 2012; 9: 199–203. doi:10.1016/j.jalz.2012.06.005PMID:23164550
13. Ellis KA, Lim YY, Harrington K, Ames D, Bush AI, Darby D, et al. Decline in cognitive function over 18 months in healthy older adults with high amyloid-beta. J Alzheimers Dis. 2013; 34: 861–871. doi:10. 3233/JAD-122170PMID:23302660
14. Ewers M, Insel P, Jagust WJ, Shaw L, Trojanowski JQ, Aisen P, et al. CSF biomarker and PIB-PET-de-rived beta-amyloid signature predicts metabolic, gray matter, and cognitive changes in nondemented subjects. Cereb Cortex. 2011; 22: 1993–2004. PMID:22038908
15. Villemagne VL, Pike KE, Chetelat G, Ellis KA, Mulligan RS, Bourgeat P, et al. Longitudinal assessment of Abeta and cognition in aging and Alzheimer disease. Ann Neurol. 2011; 69: 181–192. doi:10.1002/ ana.22248PMID:21280088
16. Hedden T, Oh H, Younger AP, Patel TA. Meta-analysis of amyloid-cognition relations in cognitively nor-mal older adults. Neurology. 2013; 80: 1341–1348. doi:10.1212/WNL.0b013e31828ab35dPMID: 23547267
17. Rodrigue KM, Kennedy KM, Devous MD Sr, Rieck JR, Hebrank AC, Diaz-Arrastia R, et al. beta-Amy-loid burden in healthy aging: regional distribution and cognitive consequences. Neurology. 2012; 78: 387–395. doi:10.1212/WNL.0b013e318245d295PMID:22302550
18. Lim YY, Ellis KA, Ames D, Darby D, Harrington K, Martins RN, et al. Abeta amyloid, cognition, and APOE genotype in healthy older adults. Alzheimers Dement. 2013; 9: 538–545. doi:10.1016/j.jalz. 2012.07.004PMID:23159043
19. Kantarci K, Lowe V, Przybelski SA, Weigand SD, Senjem ML, Ivnik RJ, et al. APOE modifies the asso-ciation between Abeta load and cognition in cognitively normal older adults. Neurology. 2012; 78: 232– 240. doi:10.1212/WNL.0b013e31824365abPMID:22189452
20. Jack CR Jr., Lowe VJ, Weigand SD, Wiste HJ, Senjem ML, Knopman DS, et al. Serial PIB and MRI in normal, mild cognitive impairment and Alzheimer's disease: implications for sequence of pathological events in Alzheimer's disease. Brain. 2009; 132: 1355–1365. doi:10.1093/brain/awp062PMID: 19339253
21. Rowe CC, Ellis KA, Rimajova M, Bourgeat P, Pike KE, Jones G, et al. Amyloid imaging results from the Australian Imaging, Biomarkers and Lifestyle (AIBL) study of aging. Neurobiol Aging. 2010; 31: 1275– 1283. doi:10.1016/j.neurobiolaging.2010.04.007PMID:20472326
23. Mormino EC, Kluth JT, Madison CM, Rabinovici GD, Baker SL, Miller BL, et al. Episodic memory loss is related to hippocampal-mediated beta-amyloid deposition in elderly subjects. Brain. 2009; 132: 1310– 1323. doi:10.1093/brain/awn320PMID:19042931
24. Villemagne VL, Ong K, Mulligan RS, Holl G, Pejoska S, Jones G, et al. Amyloid imaging with (18)F-flor-betaben in Alzheimer disease and other dementias. J Nucl Med. 2011; 52: 1210–1217. doi:10.2967/ jnumed.111.089730PMID:21764791
25. Villemagne VL, Pike KE, Darby D, Maruff P, Savage G, Ng S, et al. Abeta deposits in older non-dement-ed individuals with cognitive decline are indicative of preclinical Alzheimer's disease. Neuropsycholo-gia. 2008; 46: 1688–1697. doi:10.1016/j.neuropsychologia.2008.02.008PMID:18343463
26. Storandt M, Mintun MA, Head D, Morris JC. Cognitive decline and brain volume loss as signatures of cerebral amyloid-beta peptide deposition identified with Pittsburgh compound B: cognitive decline as-sociated with Abeta deposition. Arch Neurol. 2009; 66: 1476–1481. doi:10.1001/archneurol.2009.272 PMID:20008651
27. Resnick SM, Sojkova J, Zhou Y, An Y, Ye W, Holt DP, et al. Longitudinal cognitive decline is associated with fibrillar amyloid-beta measured by [11C]PiB. Neurology. 2010; 74: 807–815. doi:10.1212/WNL. 0b013e3181d3e3e9PMID:20147655
28. Landau SM, Mintun MA, Joshi AD, Koeppe RA, Petersen RC, Aisen PS, et al. Amyloid deposition, hypometabolism, and longitudinal cognitive decline. Ann Neurol. 2012; 72: 578–586. doi:10.1002/ana. 23650PMID:23109153
29. Snitz BE, Weissfeld LA, Lopez OL, Kuller LH, Saxton J, Singhabahu DM, et al. Cognitive trajectories associated with beta-amyloid deposition in the oldest-old without dementia. Neurology. 2013; 80: 1378–1384. doi:10.1212/WNL.0b013e31828c2fc8PMID:23516317
30. Braak H, Braak E. Frequency of stages of Alzheimer-related lesions in different age categories. Neuro-biol Aging. 1997; 18: 351–357. PMID:9330961
31. Tang MX, Cross P, Andrews H, Jacobs DM, Small S, Bell K, et al. Incid ence of Alzheimer's disease in African-Americans, Caribbean Hispanics and Caucasians in northern Manhattan. Neurology. 2001; 56: 49–56. PMID:11148235
32. American Psychiatric Association. Diagnostic and statistical manual of mental disorders.1987. Wash-ington, DC: American Psychiatric Press.
33. Manly JJ, Bell-McGinty S, Tang MX, Schupf N, Stern Y, Mayeux R. Implementing diagnostic criteria and estimating frequency of mild cognitive impairment in an urban community. Arch Neurol. 2005; 62: 1739–1746. PMID:16286549
34. Petersen RC. Mild cognitive impairment as a diagnostic entity. J Intern Med. 2004; 256: 183–194. PMID:15324362
35. Brickman AM, Schupf N, Manly JJ, Luchsinger JA, Andrews H, Tang MX, et al. Brain morphology in older African Americans, Caribbean Hispanics, and whites from northern Manhattan. Arch Neurol. 2008; 65: 1053–1061. doi:10.1001/archneur.65.8.1053PMID:18695055
36. Stern Y, Andrews H, Pittman J, Sano M, Tatemichi T, Lantigua R, et al. Diagnosis of dementia in a het-erogeneous population. Development of a neuropsychological paradigm-based diagnosis of dementia and quantified correction for the effects of education. Arch Neurol. 1992; 49: 453–460. PMID:1580806 37. Buschke H, Fuld PA. Evaluating storage, retention, and retrieval in disordered memory and learning.
Neurology. 1974; 24: 1019–1025. PMID:4473151
38. Benton AL. The Visual Retention Test. 1955. New York, NY: Psychological Corp.
39. Kaplan E, Goodglass H, Weintraub S. Boston Naming Test. Philadelphia, PA: Lea & Febiger. 1983.
40. Wechsler D (1987) Wechsler Adult Intelligence Scale-Revised. San Antonio: The Psychological Corporation.
41. Goodglass H, Kaplan E. The Assessment of Aphasia and Related Disorders. Philadelphia, PA Lea & Febiger. 1983.
42. D’Elia LF, Satz P, Uchiyama CL, White T. Color Trails Test professional manual. Psychological As-sessment Resources: Odessa, FL. 1994.
43. Rosen W. The Rosen Drawing Test 1981. Odessa, FL Psychological Assessment Resources.
44. Mattis S. Dementia Rating Scale: Professional manual.1988. Odessa, FL.
46. Becker GA, Ichise M, Barthel H, Luthardt J, Patt M, Seese A, et al. PET quantification of 18F-florbeta-ben binding to beta-amyloid deposits in human brains. J Nucl Med. 2013; 54: 723–731. doi:10.2967/ jnumed.112.107185PMID:23471310
47. Fleiss JL. Statistical methods for rates and proportions.1981. Wiley, John and Sons, Incorporated, New York, N.Y.
48. Bollen KA, Curran PJ. Latent curve models: A structural equation approach.2006. Hoboken, NJ: Wiley.
49. Stuss DT. Functions of the frontal lobes: relation to executive functions. J Int Neuropsychol Soc. 2011; 17: 759–765. doi:10.1017/S1355617711000695PMID:21729406
50. Jack CR Jr, Knopman DS, Jagust WJ, Shaw LM, Aisen PS, Weiner MW, et al. Hypothetical model of dynamic biomarkers of the Alzheimer's pathological cascade. Lancet Neurol. 2010; 9: 119–128. doi: 10.1016/S1474-4422(09)70299-6PMID:20083042
51. Farrer LA, Cupples LA, Haines JL, Hyman B, Kukull WA, Mayeux R, et al. Effects of age, sex, and eth-nicity on the association between apolipoprotein E genotype and Alzheimer disease. A meta-analysis. APOE and Alzheimer Disease Meta Analysis Consortium. JAMA. 1997; 278: 1349–1356. PMID: 9343467
52. Koistinaho M, Lin S, Wu X, Esterman M, Koger D, Hanson J, et al. Apolipoprotein E promotes astrocyte colocalization and degradation of deposited amyloid-beta peptides. Nat Med. 2004; 10: 719–726. PMID:15195085
53. Ye S, Huang Y, Mullendorff K, Dong L, Giedt G, Meng EC, et al. Apolipoprotein (apo) E4 enhances am-yloid beta peptide production in cultured neuronal cells: apoE structure as a potential therapeutic target. Proc Natl Acad Sci U S A. 2005; 102: 18700–18705. PMID:16344478
54. Ng S, Villemagne VL, Berlangieri S, Lee ST, Cherk M, Gong SJ, et al. Visual assessment versus quanti-tative assessment of 11C-PIB PET and 18F-FDG PET for detection of Alzheimer's disease. J Nucl Med. 2007; 48: 547–552. PMID:17401090
55. Suotunen T, Hirvonen J, Immonen-Raiha P, Aalto S, Lisinen I, Arponen E, et al. Visual assessment of [(11)C]PIB PET in patients with cognitive impairment. Eur J Nucl Med Mol Imaging. 2010; 37: 1141– 1147. doi:10.1007/s00259-010-1382-8PMID:20143064