Temperate Grassland Species under Ambient and
Elevated CO
2
: A Comparison of Fructan and Non-Fructan
Accumulators
Hamada AbdElgawad1., Darin Peshev2., Gaurav Zinta1,3
, Wim Van den Ende2, Ivan A. Janssens3, Han Asard1*
1Laboratory for Molecular Plant Physiology and Biotechnology, Department of Biology, University of Antwerp, Antwerp, Belgium,2Laboratory of Molecular Plant Biology, KU Leuven, Leuven, Belgium,3Research Group of Plant and Vegetation Ecology, Department of Biology, University of Antwerp (Campus Drie Eiken), Wilrijk, Belgium
Abstract
Elevated CO2concentrations and extreme climate events, are two increasing components of the ongoing global climatic
change factors, may alter plant chemical composition and thereby their economic and ecological characteristics, e.g. nutritional quality and decomposition rates. To investigate the impact of climate extremes on tissue quality, four temperate grassland species: the fructan accumulating grassesLolium perenne,Poa pratensis, and the nitrogen (N) fixing legumes
Medicago lupulinaandLotus corniculatuswere subjected to water deficit at elevated temperature (+3uC), under ambient CO2
(392 ppm) and elevated CO2(620 ppm). As a general observation, the effects of the climate extreme were larger and more
ubiquitous in combination with elevated CO2. The imposed climate extreme increased non-structural carbohydrate and
phenolics in all species, whereas it increased lignin in legumes and decreased tannins in grasses. However, there was no significant effect of climate extreme on structural carbohydrates, proteins, lipids and mineral contents and stoichiometric ratios. In combination with elevated CO2, climate extreme elicited larger increases in fructan and sucrose content in the
grasses without affecting the total carbohydrate content, while it significantly increased total carbohydrates in legumes. The accumulation of carbohydrates in legumes was accompanied by higher activity of sucrose phosphate synthase, sucrose synthase and ADP-Glc pyrophosphorylase. In the legumes, elevated CO2in combination with climate extreme reduced
protein, phosphorus (P) and magnesium (Mg) contents and the total element:N ratio and it increased phenol, lignin, tannin, carbon (C), nitrogen (N) contents and C:N, C:P and N:P ratios. On the other hand, the tissue composition of the fructan accumulating grasses was not affected at this level, in line with recent views that fructans contribute to cellular homeostasis under stress. It is speculated that quality losses will be less prominent in grasses (fructan accumulators) than legumes under climate extreme and its combination with elevated CO2conditions.
Citation:AbdElgawad H, Peshev D, Zinta G, Van den Ende W, Janssens IA, et al. (2014) Climate Extreme Effects on the Chemical Composition of Temperate Grassland Species under Ambient and Elevated CO2: A Comparison of Fructan and Non-Fructan Accumulators. PLoS ONE 9(3): e92044. doi:10.1371/ journal.pone.0092044
Editor:Alberto G. Passi, University of Insubria, Italy
ReceivedSeptember 30, 2013;AcceptedFebruary 18, 2014;PublishedMarch 26, 2014
Copyright:ß2014 AbdElgawad et al. This is an open-access article distributed under the terms of the Creative Commons Attribution License, which permits unrestricted use, distribution, and reproduction in any medium, provided the original author and source are credited.
Funding:This research was funded by the University of Antwerp concerted research project ‘‘Changes in the stress sensitivity of plants and ecosystems under climate change conditions’’ (GOA-BOF-UA-2007). The funders had no role in study design, data collection and analysis, decision to publish, or preparation of the manuscript.
Competing Interests:The authors have declared that no competing interests exist.
* E-mail: [email protected]
.These authors contributed equally to this work.
Introduction
Global climate change conditions often alter plant chemical composition, which in turn can affect food and fodder quality, and decomposition rates [1–5]. These alterations in the chemical composition of plants grown under future climate will have significant impact on economical and ecological processes [1–5]. Therefore, it is pertinent to investigate the effects of climate change on plant chemical composition.
The anticipated climate changes are predominately associated with the rise in the concentrations of CO2and a gradual rise in the
earth’s temperature, but also include increased frequency and intensity of extreme events (e.g. drought, heat wave and floodings) [6]. Effects of elevated CO2in altering the chemical composition
of plants have been extensively studied [7–12]. However, global climate change is characterized by the co-occurrence of co-varying environmental variables, which often affect plant chemical composition differently as when applied separately [4,13,14]. Up to our knowledge, studies illustrating the combined effect of elevated CO2and climate extremes on the chemical composition
of plants are scarce. An example of such a study is that of Larsenet al. [12] which indicated that single treatments of drought and elevated CO2resulted in significantly increased C:N ratios, while
ratios remained unchanged when drought and elevated CO2were
combined.
chemical composition [14,15]. When applied separately, temper-ature [15] and drought [15] have been shown to alter the chemical composition of plants. Moreover, some studies have revealed that there is a significant interaction between drought and temperature in their effects on plant chemical composition [14,12]. In this context, drought and elevated temperature altered the chemical composition by affecting carbohydrate concentrations. For exam-ple, under drought conditions, alfalfa accumulated starch, but lowered soluble sugars during vegetative growth [15]. Severe drought and elevated temperature significantly reduced the accumulation of free amino acids and soluble proteins inLeymus chinensis[14]. However, in future, higher temperatures and more frequent droughts will occur against a background of elevated CO2,and very little is known about the combined effects of climate
extremes under elevated CO2.
The anticipated changes in chemical composition are likely to alter tissue quality and decomposition rate. For example, elevated CO2caused a reduction in forage quality through a lower crude
protein content in different C3and C4plant species [16], and in
combination with high temperature, reduced digestibility by enhancing fiber content inMedicago sativa[4]. Other CO2-induced
tissue quality changes include an increased C/N ratio in soybean [17], and tannin accumulation in Lotus corniculatus [18]. The decreased tissue digestibility and decomposition rate associated with tannin accumulation is related to their ability to form digestion-resistant compounds with proteins as well as to direct inhibitory effects on microbial activity [5,19,20]. Altered stoichio-metric ratios could affect the release of organic matter from decomposing materials by influencing the decomposers function [21]. On the other hand, elevated CO2 is likely to increase the
tissue quality of fructan accumulating species via further increases in fructan and non-structural carbohydrate contents [22,24]. In addition to their roles in plant stress tolerance, fructans are now widely recognized as fermentable food fibers and acknowledged for their health and immunomodulatory effects [25,26]. Inulin-type fructans promote element resorption [27] and control insulin, cholesterol, triacylglycerol and phospholipid levels in animals and humans [28,29]. Hence, to get a global overview on the tissue composition it is important to understand the metabolism under future climate conditions and to test the above mentioned metabolites to better assess the nutritional quality, digestibility and decomposability of plants. For this reason, we conducted a study in which we exposed plants to climate extreme under current and elevated CO2, and monitored the changes in a wide range of
elements and metabolites.
Understanding changes in plant chemical composition in response to global change is further complicated because effects are species dependent. This is clear from the variation in response to elevated CO2at the carbohydrate level (see above), but species
responses also differ for other tissue quality parameters. Legumes had lower C:N, higher C:P, and higher N:P ratios than non-legumes when grown under elevated CO2[30], related to their N
fixing ability, more easily matching enhanced C assimilation [31,32]. Barbehennet al. [33] indicated that C3grasses would have
higher nutritional quality than C4 grasses under elevated [CO2],
based on higher levels of proteins and fructans. Polyphenols were significantly increased in Lolium perenne compared to Medicago lupulina under climate extreme conditions [34]. It therefore appears worth to pay closer attention to compare climate effects on the chemical composition of different plant groups.
Grasslands cover 15% of the European land area and are important food sources for livestock [35,36]. They are also an important component in the global C balance, by storing approximately one third of the terrestrial C stock. Changes in
grassland growth and productivity resulting from changing climate conditions are therefore likely to have considerable impact on ecology and food resources. Thus, it is important to investigate the grassland species responses to climate changes.
Based on this knowledge, we here test the hypotheses that, 1) a climate extreme (water deficit under elevated temperature) affects the chemical composition of common temperate grassland species, which are important food sources for livestock, 2) that this effect is altered under elevated CO2, and 3) that these chemical changes
differ among plant species and species groups. Specifically, we compared four grassland species, two fructan accumulating grasses and two non-fructan accumulating legumes.
Materials and Methods
Experimental set-up and plant harvest
Experimental set-up. A mesocosm experiment was con-ducted at the Drie Eiken Campus of Antwerp University, Belgium (51o099 N, 04o249E, 10 m elevation). Seed of each species was sown in a non-climate controlled greenhouse and watered twice a week. After five weeks, seedlings of four temperate grassland species, two fructan accumulating grasses (Lolium perenne L.,Poa pratensisL.) and two N-fixing legumes (Medicago lupulina L.,Lotus corniculatusL.), were transplanted in 16 sunlit, south facing, climate controlled chambers (Figure S1). The interior surface area of each chamber was 1.561.5 m, height at the north side was 1.5 m and at
the south side 1.2 m. The top of chambers consisted of a 4-mm thick colorless polycarbonate plate, whereas the sides were made of a 200-mm thick polyethylene film, both UV transparent. For each climate treatment four chambers were used and each chamber contained two populations (9 individuals with 5 cm interspace between them) of each species (Figure S1), grown in PVC tubes (19 cm diameter, 40 cm height) with sandy soil (96% sand, [37]. At the end, results of the two populations of each species, from the same chamber, were averaged yielding four biological replicates per climate treatment (i.e. n = 4). The climate scenarios ‘current’ and ‘future climate’ were chosen according to the IPCC-SRES B2-scenario prediction of moderate change for the year 2100 [38]. In the past, numerous studies of CO2-only
have already been conducted. Our experimental facilities included 16-growth chambers, of which only four chambers were equipped with CO2-control. Because the growth chamber was the unit of
replication in this study, having a CO2-only treatment would have
reduced the degree of replication to n = 2 or n = 3, with dramatic loss of statistical power. Instead of the typical orthogonal design, which would have allowed us to test the imposed of CO2-only, we
therefore opted for an incremental design, focusing on the impact of drought stress: no drought, drought only, drought in a warmer climate, and drought in a warmer climate and higher CO2
climate. The detailed climate conditions in these four treatments were; 1) current climate, with ambient temperature and CO2
concentration (392642 ppm) and sufficient water supply (Ambi-ent, A); 2) drought stress in a current climate (D); 3) a climate extreme treatment, i.e. drought stress in a warmer climate (Tair +3uC); and, 4) a climate extreme (drought at elevated T) treatment combined with elevated CO2 (Tair+3.0260.82uC) (DTC); CO2
(615681 ppm). Treatment D was omitted from this study, for two reasons. First, significant differences between D and DT condi-tions were very few. Second, the paper becomes unnecessarily complex because the significance levels of the difference between the D and A treatment were often different from those between the DT and A treatments.
The CO2concentrations were monitored and maintained at the
Hitchin, UK). The air temperature was monitored by a Siemens, type QFA66 sensor (Berlin, Germany). The temperature in current climate chambers followed the average daily air temper-ature course calculated for the period from 1996 to 2005. The temperature in the future climate treatments followed the same course but elevated by 3uC. Photosynthetic active radiation (PAR) was measured by a SDEC, type JYP1000 quantum sensor (SDEC, Reignac sur Indre, France). Microclimate parameters inside and outside each chamber were automatically logged every 30 min [39]. The average vapour pressure deficit was 0.3560.02 and 0.4660.02 kPa (SD) in the climate treatments with ambient and warmed air temperature, respectively. Irrigation was calculated from the monthly rainfall over the period 1995–2005 and corrected for differences in evapotranspiration (ET) inside and outside the chambers De Boecket al. [40].
Drought was induced by withdrawing irrigation at 122 days after sowing for different periods of time. Plants were harvested for analysis when 50% of the drought-exposed population showed clear signs of stress:i.e.leaf discoloration, wilting and dehydration. This occurred after one week forM. lupulinaandL. corniculatus, two weeks for L. perenne and three weeks for P. pratensis. These differences in the timing of stress occurrence mirrored declines of photosynthesis rate and stomatal conductance (see Figure S 2). Harvesting of the above ground tissue of nine plants in each population was done by cutting plants 4 cm above the soil surface, rapid freezing in liquid nitrogen and storage at280uC. For each species, the biochemical results of both populations per chamber were averaged yielding four replicates (chambers) per climate treatment.
Metabolite Measurements
Carbohydrates. Small soluble sugars were determined in 0.2 g (FW) plant material, ground in liquid nitrogen (MagNA-Lyser, Roche, Vilvoorde, Belgium) and extracted in 1 ml of 50 mM TAE buffer pH 7.5 (0.02% sodium azide, 10 mM mannitol, 0.1% polyclar, 10 mM NaHSO3, 1 mM
mercapto-ethanol, 1 mM phenylmethanesulfonylfluoride (PMSF)). The extract was centrifuged (14,000 g, 4uC, 5 min), 150ml was heated for 5 min in a water bath at 90uC. After cooling and centrifugation (14,000 g, 4uC, 5 min), the supernatant was added to a mixed bed Dowex column (300ml Dowex H+, 300ml Dowex Ac–
; both 100– 200 mesh; Acros Organics, Morris Plains, NJ, USA). The column was eluted six times with 150ml of ddH2O. Glucose, fructose,
sucrose and raffinose concentrations were measured by HPAEC-PAD as before [41]. In legumes (M. lupulina and L. corniculatus), total soluble sugars was calculated as a sum of the measured individual soluble sugars, whereas total fructan was also added in the case of grasses (L. perenneandP. pratensis). Total fructan levels and fructan patterns were generated as described [42].
The remaining pellet of soluble sugars extraction was treated with a mixture of a-amylase and amyloglucosidase to extract starch (100 U/ml, 1 h, 45uC, [43]. Sugar concentrations in the total soluble and starch extracts was estimated by the anthrone reagent method. Cellulose was extracted from 0.2 g DW plant material, by boiling in 100uC nitric acid/acetic acid (1:8, v/v, 1 h) to remove lignin, hemicellulose and xylosans after successive centrifugations at 14,000 for 15 min, and dilution with 67% H2SO4 (v/v). Cellulose was determined at 620 nm using the
anthrone reagent.
Soluble and total protein. Frozen plant material (0.2 g FW) was homogenized by MagNALyser in 2 ml of cold 0.05 M K-phosphate buffer (pH 7.0) and centrifuged (14,000 g, 4uC, 20 min). The supernatant was treated with 10% (w/v) TCA to precipitate soluble protein, which were redissolved in 1 N NaOH.
The remaining pellet was used to measure insoluble proteins. It was successively washed with 80% ethanol (v/v), 10% (w/v) cold TCA, ethanol:chloroform (3:1, v/v), ethanol:ether (3:1, v/v), and ether to remove phenolic compounds. The washed pellet was re-dissolved in 1 N NaOH at 80uC for 1 h and soluble and insoluble protein content was estimated [44]. Total protein content was calculated by adding the contents of soluble and insoluble proteins. Lignin, polyphenols and tannin. For lignin determination, 0.1 g DW plant material was homogenized (MagNALyser) with 2 ml 95% ethanol and centrifuged (14,000 g, 4uC, 3 min). The pellet was washed with different organic solvents at high temperatures, then 1 ml of 25% acetyl bromide in acetic acid (1:3, v/v) was added to the pellet and incubated at 70uC for 30 min. After cooling, 0.2 ml of 2 M NaOH and 0.1 ml of 7.5 M hydroxylamine hydrochloride were added, and the volume was made up to 10 ml with acetic acid. After centrifugation (1,000 g, 5 min), the absorbance was measured at 280 nm [45]. Polyphe-nols were extracted in 2 ml 80% ethanol (v/v) (0.2 g DW, MagNALyser) and determined with gallic acid as the standard [46]. Tannin content was determined [47] by homogenizing (MagNALyser) 0.2 g FW tissue in 2 ml 0.1 M acetate buffer pH 5, containing 2 mg of bovine serum albumin, incubated for 15 min at room temperature and centrifuged (14,000 g, 4uC, 15 min). The pellet was dissolved in 4 ml a 1% (w/v) SDS and 5% (v/v) tri-ethanolamine solution. One ml of 10 mM FeCl3in 0.01 N HCl
was added and the absorbance determined at 510 nm. Tannic acid was used as the standard.
C, N, macro-minerals and trace elements. C and N contents were measured with a CN element analyser (NC-2100, Carlo Erba Instruments, Milan, Italy). For Macro-minerals and trace elements, 100 mg DW plant material was digested in a 5:1 ratio of HNO3/H2O in a microwave oven and determined by
mass spectrometry (ICP-MS, Finnigan Element XR, Scientific, Bremen, Germany). A mixture of standards was prepared in 1% nitric acid.
Enzyme activity measurements
Carbohydrate metabolism enzymes. Neutral and soluble acid invertases were extracted in five volumes of the same ice-cold TAE extraction buffer (pH 7.5) as used for the small soluble sugar analysis (see above) and then centrifuged at 14,000 g, 15 min at 4uC. The pellet was washed three times with ice-cold 50 mM Na-acetate buffer, pH 5.0 and redissolved in this buffer. Aliquots of this suspension were subsequently used for cell wall activity determinations under continuous shaking at 30uC (500 rpm; ThermomixerH, eppendorf) to keep the walls in suspension. The supernatant was split in two parts and used for the determinations of soluble acid and neutral invertase activities, respectively. After precipitation by 80% saturated (NH4)2SO4, (incubation on ice for
30 min, centrifugation at 14 000 g, 4uC, 5 min), the pellets were washed three times with 800ml of 80% (NH4)2SO4-saturated in
TAE buffer pH 8.5 (neutral invertases) and Na-acetate buffer, pH 5.0 (soluble acid invertases). Finally, pellets were dissolved in 150ml 50 mM Na-acetate buffer, pH 5.0 (soluble acid invertase and in TAE buffer pH 8.5 (neutral invertases). Invertase activity was determined in 100ml reaction mixtures containing 100 mM sucrose in TAE buffer pH 8.5 or Na-acetate buffer pH 5.0 containing 0.02% (w/v) Na-azide. Reaction mixtures were incubated at 30uC, and the reactions were stopped by keeping an aliquot for 5 min in a water bath at 90uC. Fructose concentrations were measured as described above.
5 mM MgCl2, 2 mM sodium diethyl dithiocarbamate, 5 mMb
-mercaptoethanol, 1% PPV). After centrifugation (14,000 g, 4uC, 15 min) the supernatant was cleaned [48]. Sucrose synthase activity was measured [49] by measuring the reduction of NAD+
at 340 nm, in a reaction mixture containing 100 mM bicine KOH buffer (pH 8.5, 100 mM sucrose, 2 mM UDP, 0.025 U UDP-glucose dehydrogenase, 1.5 mM NAD+). Sucrose phosphate
synthase was measured in 1 ml of HEPES buffer (20 mM HEPES, pH 8.2, 2.2 mM UDP- glucose, 4.4 mM fructose-6-phosphate, 1 mM MgCl2, 2 mM NaF) at 37uC for 15 min, and stopped by
adding 30% NaOH and 10 min boiling. Sucrose concentrations were determined with the anthrone reagent, as described above.
ADP-Glc pyrophosphorylase was extracted (MagNALyser) from 0.2 g FW plant samples [50]. After centrifugation (14,000 g, 4uC, 5 min), the supernatant was mixed with 80 mM HEPES buffer (pH 7.4, 10 mM MgCl2, 1 mM ADP-glucose, 0.6 mM NAD+,
10mM glucose-1,6- phosphate, 2,3 mM DTT, 0.02% BSA, 1 U phosphoglucomutase, 2.5 U NAD-linked glucose-6-phosphate dehydrogenase), and the activity measured as the NAD+reduction
at 340 nm and 30uC.
Phenol and lignin biosynthesis enzymes. PAL was extracted from 0.2 g (FW) frozen plant material in 1 ml sodium borate buffer (200 mM, pH 8.8, Koukol and Conn, 1961), and assayed by measuring the absorbance of trans-cinnamic acid at 290 nm. For the cinnamyl alcohol dehydrogenase activity analysis, 5 g (FW) tissue was extracted in 10 ml Tris:HCl buffer (200 mM Tris, pH 7.5), the activity was measured by monitoring the production of cinnamyl aldehyde at 400 nm [51].
Statistical analysis
The data were analyzed by procedure of the Statistical Analysis System (SPSS Inc., Chicago, IL, USA). The assumptions of normality of distribution and homogeneity of variance were examined. Since both assumptions were met, transformations were not necessary and analysis of variance (ANOVA) was done on the original data. The impact of climate treatments: no drought, drought in a warmer climate, and drought in a warmer climate and higher CO2 climate was tested by one-way ANOVA
procedure. Number of replicates (chambers) for each climate treatment was four (n = 4). The significant differences between the means were determined by using the Duncan test (P,0.05). Multiple testing corrections were carried out by using Benjamini and Hochberg false discovery rate (FDR). The relationships between treatment variables were analyzed by using Pearson correlation.
Results
Carbohydrate metabolism
The difference in fructan and starch accumulation between the grasses and legumes is clear (Figure 1E and H), as well as the strongly differing cell wall and neutral invertase activities (Figure 2B and D). In all four species, the total soluble sugar and non-structural carbohydrates content significantly increased under climate extreme conditions (DT) (Figure 1A and G). This increase was also often reflected in the contents of individual soluble sugars, glucose, fructose, sucrose, raffinose and total fructan (Figure1 B, C, D, E and F). As compared to the two legumes, fructans were detected only in the two grasses and were further accumulated by climate extreme conditions. There was generally no effect of the climate extreme on the accumulation of starch (Figure 1H), cellulose (Figure 1I) and total structural carbohydrates (Figure 1J).
Elevated CO2(DTC) magnified the climate-mediated induction
of the sucrose and fructan contents and counteracted the increase of hexoses in the grasses, without significantly changing the total soluble sugar content. On the other hand, elevated [CO2] further
increased all carbohydrates levels in the two legumes (Figure 1). A species-specific pattern was also observed at the level of the total structural and non-structural carbohydrate content, and at the starch and cellulose levels; i.e. as compared to climate extreme, elevated CO2 did not affect, or even slightly decreased, these
carbohydrates in L. perenne and P. pratensis, but significantly increased their levels inM. lupulinaandL. corniculatus.
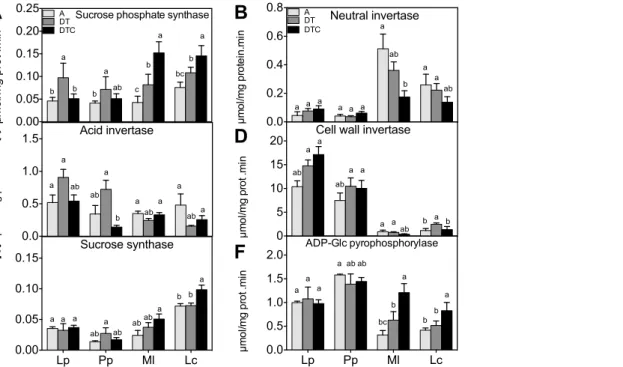
Sucrose phosphate synthase, different types of invertases, sucrose synthase and ADP-Glc pyrophosphorylase are key enzymes in sucrose and starch metabolism. Sucrose phosphate synthase mediates the synthesis of sucrose-6-phosphate [52], whereas sucrose synthase and invertases are involved in sucrose degradation [53], affecting subsequent starch synthesis via ADP-Glc pyrophosphorylase [54]. The climate extreme conditions had different effects on these enzymes. Sucrose phosphate synthase activity (Figure 2A) was induced by drought and elevated temperature (DT) in all species. However, these conditions had little effect on invertase activity, i.e. neutral-, acid soluble invertase and acid cell wall-invertases (Figure 2B, C and D respectively) in either species. Similarly, no clear changes in sucrose synthase and ADP-Glc pyrophosphorylase activity were observed in either species under the climate extreme (Figure 2E, F).
As was observed at the level of the soluble sugar concentrations, elevated [CO2] reduced the effect of the climate extreme on
sucrose phosphate synthase in the grasses. However, the opposite was observed in the legumes where elevated CO2 resulted in
increased soluble sugar levels and sucrose phosphate synthase activities. At the invertase level, increased CO2did not alter the
impact of the climate extreme, except in the legumes, where the activity of the neutral invertase and cell wall invertases strongly decreased as compared to the DT condition. By contrast, sucrose synthase and ADP-Glc pyrophosphorylase activities were induced in the legumes by 36 and 34% and by 92 and 60% inM. lupulina andL. corniculatus respectively, under the combined treatment of climate extreme and elevated CO2.
Constituents affecting plant nutritional quality and decomposition rate
The climate extreme generally had no or little effect on the total protein and lipid contents (Figure 3A and B). The treatment significantly increased the polyphenol content in all species except L. corniculatus(Figure 3C). Lignin, an indigestible polymer, showed no significant changes under the climate conditions in both grass species, whereas higher lignin contents were observed in the legumes (Figure 3D). Tannins are commonly found metabolites that possess anti-nutritional and anti-feed properties [5]. Tannins did not change in both legume species, but markedly decreased in the two grasses as a result of the drought and warming (44 and 39%, respectively) (Figure 3E).
Increasing the CO2 concentration affected the response to
drought and warming of some of measured tissue quality parameters. Elevated CO2did not alter the lipid or lignin content
in any of the species, but it significantly reduced the total protein content in the legumes (Figure 3A). Similarly, elevated CO2did
not alter the climate extreme-response of the polyphenols and tannins in the grasses, while it significantly increased the tannins in the legumes.
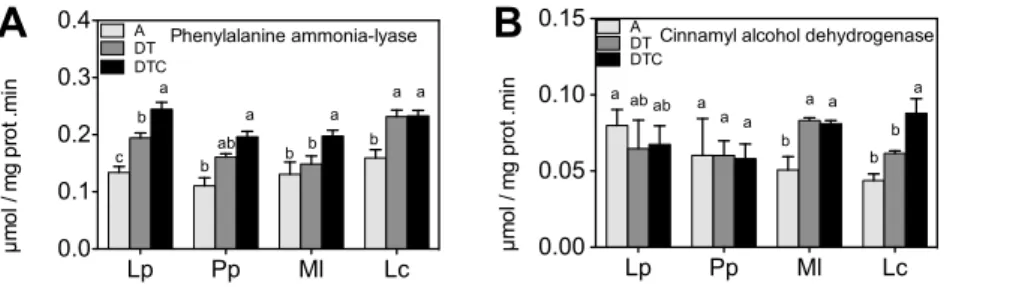
their respective biosynthetic pathways. Phenylalanine ammonia lyase activity increased slightly by the climate extreme treatment in most species, and strongest inL. corniculatus(Figure 4A). Activity of cinnamyl alcohol dehydrogenase increased only in the legumes (Figure 4B). Elevation of CO2levels in the drought and warming
treatment (DTC) generally did not significantly alter phenylala-nine ammonia lyase and cinnamyl alcohol dehydrogenase activities, with the exception of an increase in the activity of cinnamyl alcohol dehydrogenase inL. corniculatus.
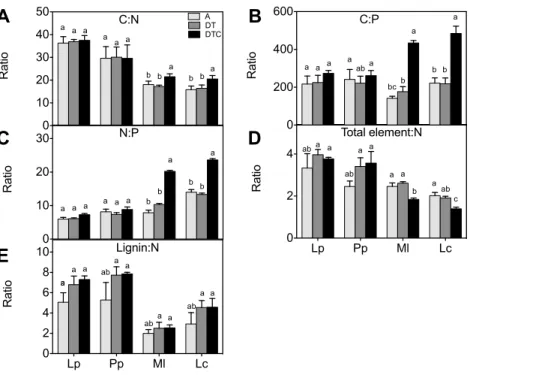
Net rates of nutrient release during plant decomposition are strongly related to their initial concentration and stoichiometry [55]. We found that there was no significant effect of the climate extreme on the concentrations of macronutrients (N, C, P, Ca, Mg, Na and K) or trace elements (Cu and Mn) in all four-plant species (Figure 5 A, B, C, D, E and F). The climate extreme also did not significantly affect aboveground plant stoichiometry in either species (Figure 6).
Elevated CO2 in combination with climate extreme (DTC)
increased the content of C and N and decreased the
concentra-tions of P and Mg in the legumes (Figure 5 A, B, C and D), relative to those in the extreme only (DT) treatment. Importantly, these decreases in P and Mg concentrations were not significant in the grasses. Elevated CO2only affected element ratios in the legumes,
but not in the grasses. The legumes showed significant increases in C:N and C:P ratios through the increased C concentration (Figure. 6A, B). The increased N:P ratio in legumes may in part be explained by increases in N content, but also results from a decreased P content (Figure. 5A). Also the total element:N ratio was reduced significantly by elevated CO2 in the two legumes
(Figure 6D).
Are changes in enzyme activities and metabolites correlated?
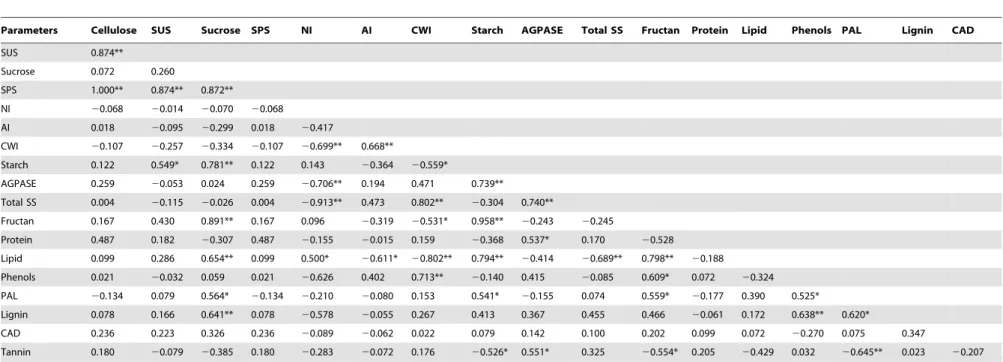
To unravel the importance of the enzymes in controlling the respective carbohydrate metabolite levels, a correlation analysis was performed. There was a statistically significant, positive correlation between the change in sucrose phosphate synthase activity and the change in the sucrose content (Table 1, r = 0.872, Figure 1. Effect of climate extreme conditions in ambient and elevated CO2on carbohydrate fractions.Climate conditions: ambient (A), drought and warming (DT), drought and warming in elevated CO2.Grassland species:Lolium perenne(Lp),Poa pratensis(Pp),Medicago lupulina(Ml)
andLotus corniculatus(Lc). The different panels show, Total soluble sugar (A), Glucose (B), Fructose (C), Sucrose (D), Raffinose (E), Total fructan (F), Non structural carbohydrate (G), Starch (H), Cellulose (I) and Structural carbohydrate (J). Different letters in the graph represent significant differences between A, DT and DTC at p,0.05 (n = 4).
Figure 2. Effect of climate extreme conditions in ambient and elevated CO2on carbohydrate metabolism enzyme activities.Climate conditions: ambient (A), drought and warming (DT), drought and warming in elevated CO2.Grassland species:Lolium perenne(Lp),Poa pratensis(Pp), Medicago lupulina(Ml) andLotus corniculatus(Lc). The different panels show Sucrose phosphate synthase (A), Neutral invertase (B) Soluble acid invertase (C), Cell wall invertase (D), Sucrose synthase (E) and ADPG pyrophosphorylase (F). Different letters in the graph represent significant differences between A, DT and DTC at p,0.05 (n = 4).
doi:10.1371/journal.pone.0092044.g002
Figure 3. Effect of climate extreme conditions in ambient and elevated CO2on metabolite classes.Climate conditions: ambient (A), drought and warming (DT), drought and warming in elevated CO2.Grassland species:Lolium perenne(Lp),Poa pratensis(Pp),Medicago lupulina(Ml)
andLotus corniculatus(Lc). The different panels show Protein (A), Lipid (B), Lignin (C), Polyphenols (D) and Tannins (E). Different letters in the graph represent significant differences between A, DT and DTC at p,0.05 (n = 4).
p,0.05). We also found a positive correlation between sucrose synthase activity and starch content (Table 1, r = 0.549, p,0.05). Oppositely, there was no correlation between the invertases activities and the change in sucrose content. There was also a positive correlation between ADP-Glc pyrophosphorylase activity and starch levels (Table 1, r = 0.739, p,0.05). Consistent with the absence of variation in the starch contents in both grasses, no effects of climate extreme and elevated CO2conditions on
ADP-Glc pyrophosphorylase activity was observed.
At the level of other metabolites and enzymes, we found a significant correlation between phenylalanine ammonia lyase activity and the phenolic content (Table 1, r = 0.525, p,0.05). However, despite the observation that increases in the lignin content in the two legume species were accompanied by higher cinnamyl alcohol dehydrogenase activity in climate extreme conditions, there was no strong correlation between lignin content and the enzyme activity (Table 1, r = 0.347, p,0.05).
We also observed correlations between changes in metabolite levels. There was a negative correlation (Table 1, r =20.528, Figure 4. Effect of climate extreme conditions in ambient and elevated CO2on polyphenol metabolism enzyme activities.Climate conditions: ambient (A), drought and warming (DT), drought and warming in elevated CO2.Grassland species:Lolium perenne(Lp),Poa pratensis(Pp), Medicago lupulina(Ml) andLotus corniculatus(Lc). The different panels show Phenylalanine ammonia-lyase (A) and Cinnamyl alcohol dehydrogenase (B). Different letters in the graph represent significant differences between A, DT and DTC at p,0.05 (n = 4).
doi:10.1371/journal.pone.0092044.g004
Figure 5. Effect of climate extreme conditions in ambient and elevated CO2 on macronutrients and trace elements. Climate conditions: ambient (A), drought and warming (DT), drought and warming in elevated CO2.Grassland species:Lolium perenne(Lp),Poa pratensis(Pp), Medicago lupulina(Ml) andLotus corniculatus(Lc). The different panels show C (A), N (B), P (C), Mg (D), Na (E), Ca (F), K (G) and Mn (H). Different letters in the graph represent significant differences between A, DT and DTC at p,0.05.
p,0.05) across all species, between the non-structural carbohy-drate and the protein content. This was particularly apparent in the legumes and suggests C being reallocated from proteins to sugars. Also, there was a strong correlation between accumulation of sucrose, soluble sugar and non-structural carbohydrate and the accumulation of polyphenols and tannins (Table 1, r = 0.822, 0.705 and 0.609 respectively, p,0.05).
Discussion
Climate extreme conditions affect plant chemical composition
To evaluate changes in grassland food properties, we analysed the carbohydrate, lipid, protein and element composition of four grassland species (L. perenne, P. pratensis, M. lupulina and L. corniculatus) subjected to a climate extreme, water deficit combined with elevated temperature (+3uC), under ambient and elevated CO2. In climate extreme conditions all plants accumulated more
soluble sugars and polyphenols. In addition, the legumes also had increased lignin content and the grasses showed decreased tannin levels. These results are consistent with previous observations, such as increases in soluble sugars in Phaseolus vulgaris leaves under temperature stress [56], and increases in tannin, polyphenols and lignin as a result of drought and/or high temperature stress in Lotus,Lolium and Medicago [15,34,57,58]. A reduction in tannin contents was also observed under drought stress inL. corniculatus leaves [18].
The climate extreme conditions did not affect insoluble sugars, proteins, lipids and minerals, or plant (element) stoichiometric ratios. Similarly, little or no significant changes in total protein, mineral or starch were reported under drought stress in Lolium perenne and Tobacco plant [59,60]. This is in contrast to results reported by others, in which water deficit stress induced changes in these parameters. For example, high temperature and drought, or
their combination, increased starch content inM. sativa[15], and decreased protein and lipid contents in Leymus chinensis and soybean [1,14]. The variations in responses at the plant composition level may be attributed to variation in the magnitude of the stress conditions, as well as to different plant species.
The accumulation of soluble sugars and polyphenols, in adverse climate conditions, are probably examples of adaptive protection strategies [61,62]. Polyphenols constitute a large group of diverse molecules, implemented in ROS detoxification and in the protection of the photosynthetic apparatus [63,64]. Higher amounts of soluble sugars provide more substrate for other defense responses [65]. However, these changes in chemical composition not only enhance plant protection, they will likely also affect the nutritional value and digestibility of these species [2,3]. Accumulation of polyphenols (toxic compounds) and lignin (indigestible fiber) decreased plant quality in economic point of view [66,67,68]. Polyphenols can also retard microbial and enzymatic decomposition by forming resistant compounds or by inhibiting microbial activity [20,69]. The stress-induced increase in polyphenols is probably explained by parallel increases in phenylalanine ammonia lyase activity, a key enzyme in polyphenol biosynthesis [61] (e.g. Table 1).
Elevated CO2alters the climate extreme impact
With the continued rise in atmospheric CO2, the effect of
climate extremes is best evaluated against an elevated CO2
background. InL. perenne, P. pratensis, M. lupulinaandL. corniculatus, elevated CO2 in climate extreme conditions enhanced several
aspects of the carbohydrate and secondary metabolite metabolism. In the legumes, significant increases in the soluble sugar, starch, cellulose, structural carbohydrate, polyphenol and tannin contents were observed. On the other hand, in the grasses, combination of elevated CO2with climate extremes increased sucrose and fructan
contents and reduced hexoses.
Figure 6. Effect of climate extreme conditions in ambient and elevated CO2on stoichiometric ratios.Climate conditions: ambient (A), drought and warming (DT), drought and warming in elevated CO2.Grassland species:Lolium perenne(Lp),Poa pratensis(Pp),Medicago lupulina(Ml)
andLotus corniculatus(Lc). The different panels show C:N ratio (A), C:P ratio (B), N:P ratio (C), Element: P ratio (D) and Lignin: N ratio (E). Different letters in the graph represent significant differences between A, DT and DTC at p,0.05 (n = 4).
Table 1.Correlations among various variables of four studied grassland species.
Parameters Cellulose SUS Sucrose SPS NI AI CWI Starch AGPASE Total SS Fructan Protein Lipid Phenols PAL Lignin CAD
SUS 0.874**
Sucrose 0.072 0.260
SPS 1.000** 0.874** 0.872**
NI 20.068 20.014 20.070 20.068
AI 0.018 20.095 20.299 0.018 20.417
CWI 20.107 20.257 20.334 20.107 20.699** 0.668**
Starch 0.122 0.549* 0.781** 0.122 0.143 20.364 20.559*
AGPASE 0.259 20.053 0.024 0.259 20.706** 0.194 0.471 0.739**
Total SS 0.004 20.115 20.026 0.004 20.913** 0.473 0.802** 20.304 0.740**
Fructan 0.167 0.430 0.891** 0.167 0.096 20.319 20.531* 0.958** 20.243 20.245
Protein 0.487 0.182 20.307 0.487 20.155 20.015 0.159 20.368 0.537* 0.170 20.528
Lipid 0.099 0.286 0.654** 0.099 0.500* 20.611* 20.802** 0.794** 20.414 20.689** 0.798** 20.188
Phenols 0.021 20.032 0.059 0.021 20.626 0.402 0.713** 20.140 0.415 20.085 0.609* 0.072 20.324
PAL 20.134 0.079 0.564* 20.134 20.210 20.080 0.153 0.541* 20.155 0.074 0.559* 20.177 0.390 0.525*
Lignin 0.078 0.166 0.641** 0.078 20.578 20.055 0.267 0.413 0.367 0.455 0.466 20.061 0.172 0.638** 0.620*
CAD 0.236 0.223 0.326 0.236 20.089 20.062 0.022 0.079 0.142 0.100 0.202 0.099 0.072 20.270 0.075 0.347
Tannin 0.180 20.079 20.385 0.180 20.283 20.072 0.176 20.526* 0.551* 0.325 20.554* 0.205 20.429 0.032 20.645** 0.023 20.207
**Correlation is significant at P,0.01 (2-tailed). *Correlation is significant at P,0.05 level (2-tailed).
SUS = Sucrose synthase, SPS = Sucrose phosphate synthase, NI = Neutral invertase, AI = Acid invertase, CWI = Cell wall invertase, AGPASE = ADP-Glu pyrophosphorylase, Total SS = Total soluble sugar, PAL = Phenylalanine ammonialyase, CAD = Cinnamyl alcohol dehydrogenase.
doi:10.1371/journal.pone.0092044.t001
Tissue
Chemistry
Composition
in
Future
Climate
ONE
|
www.ploson
e.org
9
March
2014
|
Volume
9
|
Issue
3
|
Increases in structural and non-structural carbohydrates due to CO2enrichment have been reported, and may be explained by
higher carbohydrate assimilation rates [70,71,72]. The carbohy-drate accumulation in legumes was accompanied by increased activities of sucrose phosphate synthase and ADP-Glc pyropho-sphorylase (Figure 2) as was also previously observed inPhaseolus leaves [56]. Interestingly, it appears a switch occurred in cytosolic sucrose catabolism from neutral invertase to sucrose synthase in the legumes, but not in the grasses (Figure. 2). Increased sucrose synthase activities are also linked to increased starch synthesis, although the underlying mechanisms require further exploration [73,74].L. perenneandP. pratensisare fructan-accumulating grasses, and elevated CO2 has previously been observed to allocate to
fructans in fructan accumulators [24,75].
At the level of secondary metabolites, there is a notable increase in tannin and lignin content, under stress in elevated CO2
conditions in the legumes. Similar observations have been attributed to increased shikimate metabolism in high C availability [76,77]. The accumulation of tannins in legumes can retard decomposition [20,23,68].
Frequently observed changes in tissue chemistry, induced by changing climate conditions e.g., elevated CO2 and/or drought
and temperature, include decreases in protein content [7,8,14]. In our experiment, elevated CO2in climate extreme reduced protein
level mostly in the legumes (Figure. 3). A decrease in tissue protein content lowers its nutritive quality [68,78]. Given the increases in carbohydrates, it appears that the part of the tissue C is reallocated from proteins to carbohydrates under elevated CO2 in the
legumes. Importantly, fructan-accumulating grasses did not show such decreased protein levels under elevated CO2. It can be
speculated that these species keep their C fluxes towards fructans and polyphenols (as stress tolerance contributors) and proteins (economic importance), while they are diverting none (or less) extra C to cellulose, other structural carbohydrates, lignins and tannins.
Overall, strong correlations were observed between accumula-tion of sucrose, total soluble sugar and non-structural carbohy-drate and the accumulation of polyphenols. It is well-known that sucrose specific signalling mechanisms trigger polyphenol synthesis pathways [26,79]. In Arabidopsis, soluble sugars, anthocyanins and proline typically increase together under water-deficit stress [79], and in chicory, exogenous sucrose feeding leads to the combined increase in polyphenols and fructans [80]. In addition to their direct ROS scavenging effects, fructans are recently proposed as (secondary) stress signals stimulating innate immunity responses, in plants and animals [26,80]. Both fructans and polyphenols, such as anthocyanins, might play roles both in abiotic and biotic stress responses [81].
Increasing CO2 under climate extreme did not affect the
element composition in the grasses, but several elements, most prominently C and N increased, and P and Mg decreased, in the legumes (Figure. 5). In general, reductions in P and Mg in legumes could lower their food quality for herbivores [82,83]. As a result of the changes in P, also the C:P and N:P ratios change considerably in the legumes. Elevated CO2has often been observed to decrease
nutrient concentrations of plant tissues [84]. These stress and climate-induced stoichiometry changes are therefore likely to affect food nutritional quality and decomposition [82,83,85,21].
Under combination of elevated CO2 concentration with
drought or temperature, plants typically show increased tissue C concentrations [24,86], with correspondingly reduced concentra-tions of other elements, including N [87], and several trace elements [85]. In agreement [30], we also found that elevated CO2
in climate extreme increased C:P and N:P ratios in legumes only.
The increase in C:P ratio (e.g. Figure 6B, is not only explained by elevated C accumulation, but also by a lower P content. The lignin:N ratio is another factor that could affect decomposition rates [88], but this parameter did not change considerably in extreme climate conditions.
Climate extreme and elevated CO2effects are
species-group specific
Plant responses to climate change is complicated by significant ‘species x climate’ interactions and show species-group specific responses. For example, plant functional types differed in their stoichiometric ratios under elevated CO2 [30]. Also, fructan
accumulating grasses showed higher tissue quality than non-fructan accumulators and showed increase in proteins and non-fructans levels under elevated CO2[33]. Accumulation of fructan content
in species, improve their protein utilization by livestock [89] and digestibility by ruminants [29,33]. For this reason we estimated responses of different species to climate change conditions.
Grasses and legumes responded differently to extreme climate conditions and elevated CO2 in various tissue composition
parameters. At the level of carbohydrate metabolism, soluble sugar levels were stress-induced in all species. However, fructan levels were only increased in the grasses. Moreover, elevated CO2
also affected sugar metabolism differentially between legumes and grasses, with a noteworthy shift in sugar metabolism in the legumes, where non-structural and structural carbohydrates were increased. At least parts of these differences relate to the N-fixing potential, supporting more and higher C sinks [90]. Consistently, interactive effects of elevated CO2and plant species on starch and
sugar concentrations were observed in previous study [91]. Also other tissue composition parameters were affected differ-ently between these species groups, in particular at elevated CO2.
For example, in contrast to the grasses, protein, P and Mg levels decreased, and polyphenol, tannin and lignin levels increased in the legumes under climate extreme and elevated CO2. Moreover,
in legumes element’s stoichiometry were affected (C:N, C:P, N:P and element:N). As legume are N-fixing species, high N and low P content resulted in a high N:P ratio compared to grasses. This increase was also observed in previous studies [30,91].
Together, these findings suggest that future climate elevated CO2, combined with climate extreme conditions, may reduce
tissue digestibility and quality of legume species. It also appears that the fructan accumulating grasses preserved their tissue quality (protein, macro and micronutrients) better under stress and elevated CO2, partially at the expense of the deposition of cell
wall materials. This observation fits with reports that fructan accumulating plants such as chicory behave well under stress [92], but show a growth lag phase possibly related to slower deposition of new cell wall materials [93,94]. It can be speculated that fructan accumulators invest more in defense responses during early developmental stages, even in the absence of stress. This is consistent with the strongly increased cell wall invertase activities in fructan accumulators (Figure 2D). Increased cell wall invertase activities are typically associated with stress responses [95] and tolerant genotypes maintain higher cell wall invertase activities, even in the absence of stress [96]. Cell wall invertases are emerging as important regulators of apoplastic sugar homeostasis [97] associated with altered sugar signaling events and C partitioning [79,26,96].
Conclusions and perspectives
elevated CO2, in particular in legumes. Interactions between
elevated CO2and climate extremes were observed in many cases,
where elevated CO2 amplified or reduced the impact of the
climate extreme. The results also support the importance of the variation in responses among species groups. Growth of legumes under extreme climate and elevated CO2 conditions resulted in
large compositional changes, while minor changes in tissue chemistry of the fructan-accumulating grasses were observed. This suggests that quality losses may be more prominent in non-fructan accumulators. Further research is needed to the roles of fructans as antioxidants and putative (stress) signals affecting C partitioning. For this purpose, metabolite pools in fructan-accumulating transgenic crops and wild-type crops should be rigorously compared under stress and/or elevated CO2conditions.
Supporting Information
Figure S1 Experimental design.Design of the 16 climate-controlled chambers (A) and internal arrangement of pots in chamber 1 (B).
(EPS)
Figure S2 Effect of climate extreme on photosynthesis and stomatal conductance.Climate conditions: ambient (A), drought and warming (DT), drought and warming in elevated CO2] Grassland species: Lolium perenne (Lp), Poa pratensis (Pp),
Medicago lupulina(Ml) andLotus corniculatus(Lc). The different panels show photosynthesis (A) and stomatal conductance (B) after 0,1,2 and 3 weeks of drought stress.
(EPS)
Acknowledgments
We thank Dr. Evelyn Roxana Farfan-Vignolo for her help during the set-up of the experiment and plant harvesting, and Mrs. Nadine Calluy for carbon and nitrogen analysis.
Author Contributions
Conceived and designed the experiments: H. Asard IAJ. Performed the experiments: H. AbdElgawad DP GZ. Analyzed the data: H. AbdElgawad GZ DP. Contributed reagents/materials/analysis tools: H. Asard IAJ WVE. Wrote the paper: H. AbdElgawad IAJ H. Asard WVE.
References
1. DaMatta FM, Grandis A, Arenque BC, Buckeridge MS (2010) Impacts of Climate Changes on Crop Physiology and Food Quality. Food Res Int 7: 1814– 1823.
2. Storeheier PV, Mathiesen SD, Tyler NJC, Olsen MA (2002) Nutritive value of terricolous lichens for reindeer in winter. Lichenologist 34: 247–257. 3. Warren JM, Bassman JH, Fellman JK, Mattinson DS, Eigenbrode S (2003)
Ultraviolet-B radiation alters phenolic salicylate and flavonoid composition of Populus trichocarpa leaves. Tree Physiol 23: 527–535.
4. Sanz-Sa´ez A´ , Erice G, Aguirreolea J, Mun˜oz F, Sa´nchez-Dı´az M, et al. (2012) Alfalfa forage digestibility, quality and yield under future climate change scenarios vary withSinorhizobium melilotistrain. J Plant Physiol 169: 782–788. 5. Mueller-Harvey I (2006) Unravelling the conundrum of tannins in animal
nutrition and health. J Sci Food Agr 86: 2010–2037.
6. IPCC (2012) Summary for Policymakers. In: Managing the Risks of Extreme Events and Disasters to Advance Climate Change Adaptation [Field CB, Barros V, Stocker TF, Qin D, Dokken DJ, et al. (eds.)]. A Special Report of Working Groups I and II of the Intergovernmental Panel on Climate Change. Cambridge University Press, Cambridge, UK, and New York, NY, USA, pp.1–19. 7. Turunen M, Soppela P, Kinnunen H, Sutinen M-L, Martz F (2009) Does
climate change influence the availability and quality of reindeer forage plants? Polar Biol 32: 813–832.
8. Taub D, Miller B, Allen H (2008) Effects of elevated CO2on the protein
concentration of food crops: A meta-analysis. Glob Change Biol 14: 565–575 9. Poorter H, Van Berkel Y, Baxter R, Den Hertog J, Dijkstra P, et al. (1997) The
effect of elevated CO2on the chemical composition and construction costs of
leaves of 27 C3species. Plant Cell Environ 20: 472–482.
10. Roumet C, Laurent G, Roy J (1999) Leaf structure and chemical composition as affected by elevated CO2: genotypic responses of two perennial grasses. New
Phytol 143: 73–81.
11. Muntifering RB, Chappelka AH, Lin JC, Karnosky DF, Somers GL (2006) Chemical composition and digestibility of Trifolium exposed to elevated ozone and carbon dioxide in a free-air (FACE) fumigation system. Funct Ecol 20: 269– 275.
12. Larsen KS, Andresen LC, Beier C, Jonsasson S, Albert KR, et al. (2011) Reduced N cycling in response to drought, warming, and elevated CO2 in a Danish heathland: synthesizing results of the CLIMAITE project after two years of treatments. Glob Change Biol 17: 1884–1899.
13. Hay R, Porter J (2006) The physiology of crop yield (2nd ed.). Oxford: Blackwell. 14. Xu ZZ, Zhou GS (2006) Combined effects of water stress and high temperature on photosynthesis, nitrogen metabolism and lipid peroxidation of a perennial grassLeymus chinensis. Planta 224: 1080–1090.
15. Erice G, Irigoyen JJ, Pe´rez P, Martı´nez-Carrasco R, Sa´nchez-Dı´az M (2006) Effect of elevated CO2, temperature and drought on photosynthesis of nodulated
alfalfa during a cutting regrowth cycle. Physiol Plantarum 126: 458–68. 16. Wand SJE, Midgley GF, Jones MH, Curtis PS (1999) Responses of wild C4and
C3grass (Poaceae) species to elevated CO2concentration: a meta-analytic test of
current theories and perceptions. Glob Change Biol 5: 723–41.
17. Ainsworth EA, Davey PA, Bernacchi CJ, Dermody OC, Heaton EA, et al. (2002). A meta analysis of elevated [CO2] effects on soybean (Glycine max)
physiology, growth and yield. Glob Change Biol 8: 695–709.
18. Carter E, Theodorou MK, Morris P (1999) Responses ofLotus corniculatusto environmental change. 2. Effect of elevated CO2, temperature and drought on
tissue digestion in relation to condensed tannin and carbohydrate accumulation. J Sci Food Agric 79: 1431–1440.
19. Swift MJ, Heal OW, Anderson JM (1979) Decomposition in terrestrial ecosystems. University of California Press, Berkeley, CA.
20. Kraus TEC, Dahlgren RA, Zasoski RJ (2003) Tannins in nutrient dynamics of forest ecosystems—a review. Plant Soil 256: 41–66.
21. King JY, Mosier AR, Morgan JA, LeCain DR, Milchunas DG, et al. (2004) Plant nitrogen dynamics in shortgrass steppe under elevated atmospheric carbon dioxide. Ecosystems 7: 147–160.
22. Fisher DS, Mayland HF, Burns JC (2002) Variation in ruminants preference for tall fescue hays cut either at sundown or at sunup. J Anim Sci 77: 762–8. 23. Liao JX, Hou ZD, Wang GX (2002) Effects of elevated CO2 and drought on
chemical composition and decomposition of spring wheat (Triticum aestivum). Funct Plant Biol 29: 891–897.
24. Oliveira VF, Silva EA, Zaidan LBP, Carvalho MAM (2013) Effects of elevated CO2 concentration and water deficit on fructan metabolism in Viguiera discolor Baker. Plant Biol 15: 471–482.
25. Ritsema T, Smeekens S (2003) Fructans: beneficial for plants and humans. Curr Opin Plant Bio 6: 223–30.
26. Van den Ende W (2013). Multifunctional fructans and raffinose family oligosaccharides. Fron Plant Sci 4: 1–11.
27. Scholz-Ahrens KE, Schaafsma G, van den Heuvel EGHM, Schrezenmeir J (2001) Effects of prebiotics on mineral metabolism. Am J Clin Nutr 73: 459S– 64S.
28. Jackson K, Taylor G, Clohessy A, Williams C (1999) The effect of the daily intake of inulin on fasting lipid, insulin, and glucose concentrations in middle-aged men and women. Br J Nutr 82: 23–30.
29. Van Soest PJ (1994) Nutritional Ecology of the Ruminant. Cornell University Press, Ithaca, NY, Delzenne NM, Kok N (2001) Effects of fructans-type prebiotics on lipid metabolism. Am Soc Clin Nut 73: 456–458.
30. Novotny AM, Schade JD, Hobbie SE, Kay AD, Kyle M, et al. (2007) Stoichiometric response of nitrogen-Wxing and non-Wxing dicots to manipu-lations of CO2, nitrogen, and diversity. Oecologia 151:687–696.
31. Lee TD, Tjoelker MG, Reich PB, Russelle MP (2003) Contrasting growth response of an N2-fixing and non-fixing forb to elevated CO2: dependence on
soil N supply. Plant Soil 255: 475–486.
32. Torbert HA, Prior SA, Rogers HH, Runion GB (2004) Elevated atmospheric CO2effects on N fertilization in grain sorghum and soybean. Field Crops Res
88: 57–67.
33. Barbehenn RV, Chen Z, Karowe DN, Spickard A (2004) C3grasses have higher
nutritional quality than C4grasses under ambient and elevated atmospheric
CO2. Glob Change Biol 10: 1565–1575.
34. Farfan-Vignolo ER, Asard H (2012) Effect of elevated CO2and temperature on
the oxidative stress response to drought inLolium perenneL. andMedicago sativaL. Plant Physiol Biochem 59: 55–62.
35. Carlier L, Rotar I, Vlahova M, Vidican R (2009) Importance and Functions of Grasslands. NOT BOT HORT Agrobot Clui 73: 25–30.
36. Ciais P, Gervois S, Vuichard N, Piao SL, Viovy N (2011) Effects of land use change and management on the European cropland carbon balance Global Change Biology 17: 320–338.
38. IPCC (2001) Climate change (2001) The scientific basis. Contribution of Working Group I to the Third Assessment Report of the Intergovernmental Panel on Climate Change. Weather 57: 267–269.
39. Naudts K, Van den Berge J, Janssens IA, Nijs I, Ceulemans R (2013) Combined effects of warming and elevated CO2 on the impact of drought in grassland species. Plant Soil 369: 497–507.
40. De Boeck, HJ, Lemmens C, Bossuyt H, Malchair S, Carnol M, et al. (2006) How do climate warming and plant species richness affect water use in experimental grasslands? Plant and Soil 288: 249–261.
41. Vergauwen R, Van den Ende W, Van Laere A (2000) The role of fructan in flowering ofCampanula rapunculoides. J Exp Bot 51: 1261–1266.
42. Verspreet J, Pollet A, Cuyvers S, Vergauwen R, Van den Ende W, et al. (2012) A simple and accurate method for determining wheat grain fructan content and average degree of polymerization. J Agr Food Chem. 60: 2102–2107. 43. Galtier N, Foyer CH, Murchie E, Alred R, Quick P, et al. (1995) Effects of light
and atmosphere CO2enrichment on photosynthetic carbon partitioning and
carbon/nitrogen ratios in tomato (Lycopersicon esculentumL.) plants over-expressing sucrose phosphate synthase. J Exp Bot 46: 1335–1344.
44. Lowry OH, Rosebrough NJ, Farr AL, Randall RJ (1951). Protein measurement with the Folin Phenol Reagent. J Biol Chem 193: 265–275.
45. Lin CC, CH Kao (2001) Cell wall peroxidase against ferulic acid, lignin, and NaCl-reduced root growth of rice seedlings. J Plant Physiol 158: 667–671. 46. Zhang Q, Zhang Q, Shen J, Silva V, Denis DA, et al. (2006) A simple 96-well
microplate method for estimation of total polyphenol content in seaweeds. J Appl Phycol 18: 445–450.
47. Hagerman AE, Butlir LG (1978) Protein precipitation method for the quantitative determination of tannins. J Agric Food Chem 26: 809–812. 48. Sharma PK, Anand P, Sankhalkar S, Shetye R (1998) Photochemical and
biochemical changes in wheat seedlings exposed to supplementary ultraviolet-B radiation. Plant Sci 132: 21–30
49. Morell M, Copeland L (1985) Sucrose synthase of soybean nodules. Plant Physiol 78: 149–154
50. Neuhaus HE, Quick WP, Siegl G, Stitt M (1990) Control of photosynthate partitioning in spinach leaves: analysis of the interaction between feed- forward and feedback regulation of sucrose synthesis. Planta 181: 583–592
51. Mansell RL, Gross GG, Stockigt J, Franke H, Zenk MH (1974) Purification and properties of cinnamyl alcohol dehydrogenase from higher plants. Phytochem 13: 2427–2435
52. Geigenberger P, Reimholz R, Geiger M, Merlo L, Canale V, et al. (1997) Regulation of sucrose and starch metabolism in potato tubers in response to short-term water deffcit. Planta 201: 502–518.
53. Karen Koch (2004) Sucrose metabolism: regulatory mechanisms and pivotal roles in sugar sensing and plant development. Current Opinion in Plant Biology 2004, 7: 235–246
54. Preiss J (2009) Biochemistry and Molecular Biology of Starch Biosynthesis. IN: Starch: Chemistry and Technology (3rd edition) R.L. Whistler and J. BeMiller (eds.) Elsevier, Inc., Oxford, UK, 83–147
55. Zhang D, Hui D, Luo Y, Zhou G (2008) Rates of litter decomposition in terrestrial ecosystems: global patterns and controlling factors. J Plant Ecol 1: 85– 93
56. Prasad PV, Boote KJ, Va JCV, Allen LH Jr. (2004) The carbohydrate metabolism enzymes sucrose-P synthase and ADG-pyrophosphorylase in Phaseolusbean leaves are up-regulated at elevated growth carbon dioxide and temperature. Plant Sci 166: 1565–1573.
57. Anuraga M, Duarsa P, Hill MJ, Lovett JV (1993) Soil moisture and temperature affect condensed tannin concentrations and growth inLotus corniculatusandLotus pedunculatus. Aust J Agric Res 44: 1667.
58. Cherney JH, Hall MV (2007) Forage Quality in Perspective: Agronomy facts 30. 2007. Pennsylvania State University, College of Agricultural Sciences, PA 16802, USA.
59. Thomas H (1991) Accumulation and consumption of solutes in swards ofLolium perenneduring drought and after rewatering. New phytol 18: 35–48. 60. Pilon-Smits EAH, Ebskamp MJM, Paul MJ, Jeuken MJW, Weisbeek PJ, et al.
(1995) Improved Performance of Transgenic Fructan-Accumulating Tobacco under Drought Stress Plant Physiol 107: 125–130.
61. Oh M-M, Trick HN, Rajashekar CB (2009) Secondary metabolism and antioxidants are involved in environmental adaptation and stress tolerance in lettuce. J plant Physiol 166: 180–191
62. Le Martret B, Poage M, Shiel K, Nugent GD, Dix PJ (2011) Tobacco chloroplast transformants expressing genes encoding dehydroascorbate reduc-tase, glutathione reducreduc-tase, and glutathione-S-transferase, exhibit altered anti-oxidant metabolism and improved abiotic stress tolerance. Plant Biotechnol J 9: 661–673.
63. Mittler R, Vanderauwera S, Gollery M, Van Breusegem F (2004) Reactive oxygen gene network of plants. Trends Plant Sci 9: 490–498.
64. Reddy KR, Kakani VG, Zhao D, Koti S, Gao W (2004) Interactive effects of ultraviolet-B radiation and temperature on cotton physiology, growth, development and hyperspectral reflectance. Photochem Photobiol 79: 416–427. 65. Ramel F, Sulmon C, Cabello-Hurtado F, Taconnat L, Martin-Magniette ML, et al. (2007) Genome-wide interacting effects of sucrose and herbicide-mediated stress in Arabidopsis thaliana: novel insights into atrazine toxicity and sucrose-induced tolerance. BMC Genom 8: 450.
66. Ehleringer JR, Cerling TE, Dearing MD (2002) Atmospheric CO2 as a global change driver influencing plant–animal interactions. Integr Comp Biol 42: 424– 430.
67. Powell MC, Muntifering RB, Lin JC, Chappelka AH (2003) Yield and nutritive quality of sericea lespedeza (Lespedeza cuneata) and little bluestem (Schizachyrium) exposed to ground-level ozone. Environ Pollut 122: 313–22.
68. Milchunas DG, Moiser AR, Morgan JA, LeCain DR, King JY, et al. (2005) CO2
and defoliation effects on shortgrass steppe: forage quality versus quantity for ruminants. Agr Ecoyst Environ 111: 166–84.
69. Fog K (1988) The effect of added nitrogen on the rate of decomposition of organic matter. Biol Rev 63: 433–462.
70. Moore BD, Palmquist DE, Seemann JR (1997) Influence of plant growth at high CO2concentrations on leaf content of ribulose-1,5-bisphosphate carboxylase/
oxygenase and intracellular distribution of soluble carbohydrates in tobacco, snapdragon, and parsley. Plant Physiol 115: 241–248.
71. Teng N, Wang J, Chen T, Wu X, Wang Y, Lin J (2006) Elevated CO2induces
physiological, biochemical and structural changes in leaves of Arabidopsis thaliana. New Phytol 172: 92–103.
72. De Souza AP, Gaspar M, Silva EA, Ulian EC, Waclawovsky AJ, et al. (2008) Elevated CO2increases photosynthesis, biomass and productivity, and modifies
gene expression in sugarcane. Plant Cell Environ 31: 1116–1127.
73. Baroja-Ferna´ndez E, Mun˜oz FJ, Montero M, Etxeberria E, Sesma MT, et al. (2009) Enhancing sucrose synthase activity in transgenic potato (Solanum tuberosum L.) tubers results in increased levels of starch, ADPglucose and UDPglucose and total yield. Plant Cell Physiol 50: 1651–1662.
74. Mun˜oz FJ, Baroja-Ferna´ndez E, Mora´n-Zorzano MT, Viale AM, Etxeberria E, et al. (2005) Sucrose synthase controls both intracellular ADP glucose levels and transitory starch biosynthesis in source leaves. Plant Cell Physiol 46: 1366–1376 75. Kinmonth-Schultz H, Kim S-H (2011) Carbon gain, allocation and storage in rhizomes in response to elevated atmospheric carbon dioxide and nutrient supply in a perennial C3grass,Phalaris arundinacea. Funct Plant Biol 38: 797–807
76. De Boeck HJ, Dreesen F, Janssens IA, Nijs I (2011) Whole-system responses of experimental plant communities to climate extremes imposed in different seasons. New Phytol 189: 806–817.
77. Naudts K, Van den Berge J, Janssens IA, Nijs I, Ceulemans R (2013) Combined effects of warming and elevated CO2 on the impact of drought in grassland species. Plant Soil 369: 497–507.
78. Larson SR, Mayland HF (2007) Comparative mapping of fiber, protein, and mineral content QTLs in two interspecificLeymus wildryefull-sib families. Mol Breeding 20: 331–347.
79. Bolouri Moghaddam M, Van den Ende W (2013) Sweet immunity in the plant circadian regulatory network. J Exp Bot 64: 1439–1449.
80. Peshev D, Vergauwen R, Moglia A, Hideg E, Van den Ende W (2013) Towards understanding vacuolar antioxidant mechanisms: a role for fructans?J Exp Bot 64: 1025–1038.
81. Van den Ende W, El-Esawe SK (2013) Sugar signaling pathways leading to fructan and anthocyanin accumulation: a dual function in abiotic and biotic stress responses? Environ. Exp. Bot In press.
82. Schade JD, Kyle M, Hobbie SE, Fagan WF, Elser JJ (2003) Stoichiometric tracking of soil nutrients by a desert insect herbivore. Ecol Lett 6: 96–101. 83. Perkins MC, Woods HA, Harrison JF, Elser JJ (2004) Dietary phosphorus affects
the growth of larval Manduca sexta. Arch Insect Biochem Physiol 55: 153–168. 84. Luomala EM, Laitinen K, Sutinen S, Kelloma¨ki S, Vapaavuori E (2005) Stomatal density, anatomy and nutrient concentrations of Scots pine needles are affected by elevated CO2 and temperature. Plant Cell Environ 28: 733–749. 85. Billings SA, Zitzer SF, Wwatherly H, Schaeffer SM, Charlet T, et al. (2003)
Effects of elevated carbon dioxide on green leaf tissue and leaf litter quality in an intact Mojave Desert ecosystem. Glob Change Biol 9: 729–735.
86. Read JJ, Morgan JA, Chatterton NJ, Harrison PA (1997) Gas exchange and carbohydrate and nitrogen concentrations in leaves ofPascopyrum smithii(C3) and
Bouteloua gracilis (C4) at different carbon dioxide concentrations and
temperatures. Ann Bot 79: 197–206.
87. Runion GB, Entry JA, Prior SA, Mitchell RJ, Rogers HH (1999) Tissue chemistry and carbon allocation in seedlings of Pinus palustris subjected to elevated atmospheric CO2and water stress. Tree Physiol 19: 329–33
88. Melillo JM, Aber JD, Muratore JF (1982) Nitrogen and lignin control of hardwood leaf litter decomposition dynamics. Ecol 63: 621–626.
89. Miller LA, Moorby JM, Davies DR, Humphreys MO, Scollan ND, et al. (2001) Increased concentration of water-soluble carbohydrate in perennial ryegrass (Lolium perenne L.): milk production from late-lactation dairy cows. Grass and Forage Sci 56: 383–394.
90. Rogers A, Gibon Y, Stitt M, Morgan PB, Bernacchi CJ, et al. (2006) Increased C availability at elevated carbon dioxide concentration improves N assimilation in a legume. Plant Cell Environ 29: 1651–1658.
91. Goverde M, Arnone JA, Erhardt A (2002) Species-specific reactions to elevated CO2 and nutrient availability in four grass species. Basic Appl Ecol 3: 221–227. 92. Vandoorne B, Mathieu A-S, Van den Ende W, Vergauwen R, Pe´rilleux C, et al. (2012) Water stress drastically reduces root growth and inulin yield inCichorium intybus(var. sativum) independently of photosynthesis. J Exp Bot 63: 4359–4373. 93. Refre´gier G, Pelletier S, Jaillard D, Ho¨fte H (2004) Interaction between wall deposition and cell elongation in dark-grown hypocotyl cells in Arabidopsis. Plant Physiol 135: 959–968.
by chlorophyllafluorescence imaging. I. Light induction curve.Photosynthetica49: 161–171.
95. Roitsch T, Hofmann M, Proels R, Balibrea ME, Sinha AK (2003) Extracellular invertase: key metabolic enzyme and PR protein. Journal Exp Bot 54: 513–24.