Americans
Daniel Shriner1*, Alan Herbert2, Ayo P. Doumatey1, Jie Zhou1, Hanxia Huang1, Michael R. Erdos3, Guanjie Chen1, Norman P. Gerry4, Michael F. Christman4, Adebowale Adeyemo1, Charles N. Rotimi1*
1Center for Research on Genomics and Global Health, National Human Genome Research Institute, Bethesda, Maryland, United States of America,2Department of Genetics and Genomics, Boston University School of Medicine, Boston, Massachusetts, United States of America,3Genome Technology Branch, National Human Genome Research Institute, Bethesda, Maryland, United States of America,4The Coriell Institute for Medical Research, Camden, New Jersey, United States of America
Abstract
The incidence of chronic kidney disease varies by ethnic group in the USA, with African Americans displaying a two-fold higher rate than European Americans. One of the two defining variables underlying staging of chronic kidney disease is the glomerular filtration rate. Meta-analysis in individuals of European ancestry has identified 23 genetic loci associated with the estimated glomerular filtration rate (eGFR). We conducted a follow-up study of these 23 genetic loci using a population-based sample of 1,018 unrelated admixed African Americans. We included in our follow-up study two variants inAPOL1 associated with end-stage kidney disease discovered by admixture mapping in admixed African Americans. To address confounding due to admixture, we estimated local ancestry at each marker and global ancestry. We performed regression analysis stratified by local ancestry and combined the resulting regression estimates across ancestry strata using an inverse variance-weighted fixed effects model. We found that 11 of the 24 loci were significantly associated with eGFR in our sample. The effect size estimates were not significantly different between the subgroups of individuals with two copies of African ancestryvs. two copies of European ancestry for any of the 11 loci. In contrast, allele frequencies were significantly different at 10 of the 11 loci. Collectively, the 11 loci, including four secondary signals revealed by conditional analyses, explained 14.2% of the phenotypic variance in eGFR, in contrast to the 1.4% explained by the 24 loci in individuals of European ancestry. Our findings provide insight into the genetic basis of variation in renal function among admixed African Americans.
Citation:Shriner D, Herbert A, Doumatey AP, Zhou J, Huang H, et al. (2012) Multiple Loci Associated with Renal Function in African Americans. PLoS ONE 7(9): e45112. doi:10.1371/journal.pone.0045112
Editor:Farook Thameem, The University of Texas Health Science Center (UTHSCSA ), United States of America
ReceivedMarch 28, 2012;AcceptedAugust 16, 2012;PublishedSeptember 13, 2012
This is an open-access article, free of all copyright, and may be freely reproduced, distributed, transmitted, modified, built upon, or otherwise used by anyone for any lawful purpose. The work is made available under the Creative Commons CC0 public domain dedication.
Funding:The Howard University Family Study was supported by National Institutes of Health grants S06GM008016-320107 and S06GM008016-380111. Enrollment was carried out at the Howard University General Clinical Research Center, supported by National Institutes of Health grant 2M01RR010284. This research was supported in part by the Intramural Research Program of the Center for Research on Genomics and Global Health. The Center for Research on Genomics and Global Health is supported by the National Human Genome Research Institute, the National Institute of Diabetes and Digestive and Kidney Diseases, the Center for Information Technology, and the Office of the Director at the National Institutes of Health (Z01HG200362). Genotyping support was provided by the Coriell Institute for Medical Research. The funders had no role in study design, data collection and analysis, decision to publish, or preparation of the manuscript.
Competing Interests:The authors have declared that no competing interests exist.
* E-mail: [email protected] (DS); [email protected] (CNR)
Introduction
Chronic kidney disease (CKD) is a common health condition that increases the risk of kidney failure and cardiovascular disease. According to two National Health and Nutrition Examination Surveys, the prevalence of CKD in the USA increased from 10.0% in 1988–1994 to 13.1% in 1999–2004 [1]. Particularly alarming is the projection that the public health burden of CKD will worsen due to the increasing prevalence in the general population of major risk factors including hypertension, obesity, and type 2 diabetes [1,2]. The risk of developing CKD varies by ethnicity, with African Americans having about two-fold higher risk than European Americans after controlling for clinical, lifestyle, and socio-demographic factors [3]. Stages of CKD are defined by a combination of renal damage, often quantified by proteinuria, and renal function, often quantified by the estimated glomerular filtration rate (eGFR) [2].
There is strong evidence for genetic loci influencing eGFR. In the Framingham Heart Study, the heritability estimate for eGFR
was 0.46 [4]. In families of European ancestry ascertained for type 2 diabetes, the estimated heritability for eGFR was 0.75 [5]. In a genome-wide association study of European-ancestry individuals, genetic variants in the genes UMOD, SHROOM3, and GATM
-SPATA5L1were associated with eGFR [6]. Associations at these three loci explained 0.7% of the phenotypic variance of eGFR, indicating the presence of additional genetic risk factors [6]. Meta-analysis has revealed a total of 23 loci influencing eGFR, collectively explaining 1.4% of the phenotypic variance of eGFR among individuals of European ancestry [7]. Using admixture mapping, APOL1 has been identified as a risk gene for non-diabetic end-stage renal disease in African Americans [8,9,10]; whether this gene is also associated with eGFR is unknown.
influences eGFR. We used stratified regression to account for confounding of association by ancestry at the level of the individual as well as the marker [11]. For those associations that transferred to our sample, we used differences in linkage disequilibrium patterns to fine-map the loci and we used conditional analysis to detect secondary associations [12].
Results
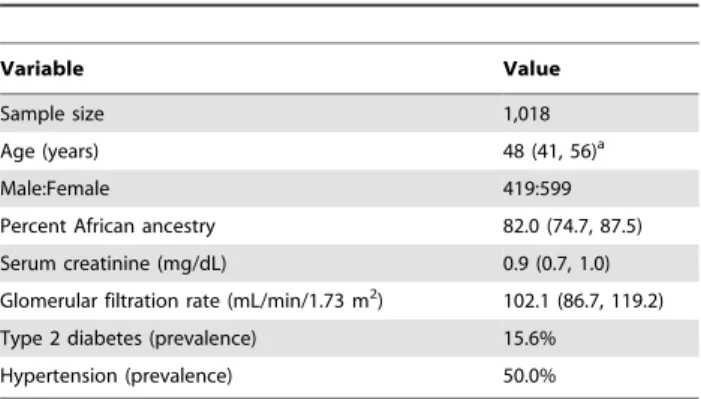
We assessed the transferability of association with eGFR for 23 index single nucleotide polymorphisms (SNPs) from European ancestry to admixed African Americans. Our sample of 1,018 unrelated individuals (Table 1) provided at least 80% power to detect effects explaining$0.77% of the phenotypic variance at the 5% significance level [13]. For each of the 23 loci, we identified a set of proxies for the index SNP based on the HapMap Phase II+III CEU reference data. Our strategy revealed that the most strongly associated SNP in our sample differed from the index SNP for each of the 23 loci (Table 2). We detected significant association for 10 of the 23 loci (Table 2 and Supplementary Figure S1). Collectively, these 10 loci explained 8.8% of the phenotypic variance of eGFR in our sample (Supplementary Table S1).
Given that the 8.8% of the phenotypic variance explained in our sample was considerably larger than the 1.4% explained among individuals of European ancestry [7], we performed a reality check by estimating the percent variance explained when comparing a full model consisting of the 10 SNPs, age, sex, and global ancestry with a reduced model consisting of age, sex, and global ancestry. Uncorrected for local ancestry, genotypic effects of our 10 most strongly associated SNPs collectively explained 5.7% of the phenotypic variance of eGFR. By comparison, genotypic effects of the 10 index SNPs explained only 1.1% of the phenotypic variance of eGFR. Thus, even without accounting for local ancestry, our fine-mapping strategy enabled explanation of four-fold more phenotypic variance in our African American sample with less than half of the loci discovered in the meta-analysis of individuals of European ancestry. The 10 local ancestries collectively explained an additional 2.0% of the phenotypic variance. Principal component analysis revealed only one significant principal component, reflecting global ancestry and indicating an absence of residual population structure (Supple-mentary Figure S2). There was no compelling evidence for recent positive natural selection at any of the loci in either of the ancestral samples (Table 2). Overall weaker levels of linkage disequilibrium in African Americans compared to Europeans improved resolution
of associated regions from an average of 199.7 kb to 15.0 kb (Supplementary Figure S1).
We also tested two markers inAPOL1previously associated with end-stage renal disease [10]. The SNP rs73885319 was not associated with eGFR under either the additive (p~0:305) or
recessive (p~0:913) model. The 6 bp deletion rs71785313 was
associated with eGFR under the additive (p~0:046) but not
recessive (p~0:778) model. Rs71785313 showed an excess of
heterozygotes (p~0:035). The association at rs71785313
ex-plained an additional 0.3% of the phenotypic variance (Supple-mentary Table S1). Both markers are monomorphic in individuals of European ancestry and hence explain no phenotypic variance in such individuals.
To further explore the effects of local ancestry, we tested the allele frequencies in the subgroups of 0 vs. 2 chromosomes of African ancestry. The allele frequencies were statistically different at 10 of the 11 loci (Supplementary Table S2). This amount of differentiation for 11 loci was not excessive, given the amount of differentiation genome-wide between the CEU and YRI reference samples (p~0:3018). The effect size estimates were not statistically
different between the two subgroups at any of the 11 loci (Supplementary Table S2). Similarly, none of the 11 loci showed an admixture effect,i.e., an effect of excess ancestry (Supplemen-tary Table S2).
We performed secondary analyses for the 10 loci discovered in individuals of European ancestry using the same stratified regression approach. We tested each SNP within a locus, conditioned on the most strongly associated SNP within that locus. We detected four secondary associations at three loci,
PSMA5,TFDP2, andWDR72, collectively explaining an additional 3.1% of the phenotypic variance of eGFR (Supplementary Table S3). Taken together, genotype effects at the 11 associated loci explained 8.8%+3.1%+0.3% = 12.2% of the phenotype variance, with local ancestry effects explaining an additional 2.0% of the phenotypic variance, compared to 1.4% explained by all 24 loci in individuals of European ancestry.
The stratified regression approach can also be used as is at the genome-wide scale. None of the 797,831 SNPs was genome-wide significant for association with eGFR using either the unstratified or stratified approach (Supplementary Figure S3).
Discussion
Association analysis can be confounded by variation in ancestry. Similar confounding can result from population structure among discrete populations, i.e., multiple ancestrally homogeneous populations, as well as population structure due to admixture [14]. We recently developed a stratified regression approach for association analysis that controls by individual and, critically for admixed samples, by marker, for confounding due to variation in ancestry [11,15]. We applied this approach in a follow-up study for eGFR in admixed African Americans given associations originally discovered in individuals of European ancestry. Despite substantial heterogeneity in allele frequencies, we found significant associations for 10 of 23 loci (SYPL2,TFDP2,SLC34A1,SLC22A2,
PHTF2, PIP5K1B/FAM122A, OVOL1, SLC30A4, WDR72, and
BCAS3/TBX2). Furthermore, we fine-mapped the associations at the 10 loci by leveraging the generally weaker levels of linkage disequilibrium in individuals of African ancestry compared to individuals of European ancestry, improving resolution by over an order of magnitude on average. We also found association with eGFR for a deletion inAPOL1originally associated with end-stage renal disease.
Table 1.Characteristics of the study sample.
Variable Value
Sample size 1,018
Age (years) 48 (41, 56)a
Male:Female 419:599
Percent African ancestry 82.0 (74.7, 87.5)
Serum creatinine (mg/dL) 0.9 (0.7, 1.0)
Glomerular filtration rate (mL/min/1.73 m2) 102.1 (86.7, 119.2)
Type 2 diabetes (prevalence) 15.6%
Hypertension (prevalence) 50.0%
Allele frequencies were significantly differentiated between African and European ancestries for 10 of the 11 loci. Given the amount of differentiation between the CEU and YRI samples at the genome-wide level, 10 of 11 loci showing significant allelic differentiation is not excessive. We found no evidence supporting the action of recent positive natural selection at the 10 loci discovered in individuals of European ancestry, suggesting that differentiation at the 10 loci reflects divergence due to random genetic drift following the ancestral split between Africans and Europeans. In contrast, evidence for balancing selection exists at
APOL1[10].
We found that stratifying genotypes by local ancestry resulted in an additional 3.0% of phenotypic variance explained over genotypes uncorrected for local ancestry, indicating that local ancestry masked genotypic effects. Thus, accounting for local ancestry can increase the phenotypic variance explained by two distinct mechanisms: the direct effect of local ancestry, which is the basis of admixture mapping, and the indirect effect of masking genotypic effects, which is revealed by removing confounding. Previously, associations at 12/23 loci were reported to transfer to African Americans, but those results did not account for local ancestry and therefore are potentially subject to confounding [16]. There are three main limitations of our study. One limitation is that the HUFS sample of 1,018 unrelated individuals has less than
80% power in a follow-up study to detect effects explaining
v0:77% of the phenotypic variance and is underpowered in a discovery study for a polygenic trait. Another limitation is a lack of data addressing how the implicated genes influence eGFR. Possibilities include genes that affect creatinine metabolism (SLC22A2, PHTF2, WDR72, andBCAS3/TBX2) and genes that affect renal function (SYPL2, TFDP2, SLC34A1, PIP5K1B/
FAM122A, OVOL1, and SLC30A4) [7]. The third limitation is that we did not include imputation, which is used to increase coverage of the genome by predicting genotypes for untyped markers. Imputation is based on the conditional distribution of haplotype frequencies given external reference data and thus requires specification of local ancestry. For admixed individuals such as African Americans, it is necessary to account for variation in ancestry both by individual and by marker and methods to do so are under development.
In summary, we identified 11 genetic loci influencing eGFR in a population-based sample of African Americans. We used stratified regression to test for association conditional on local ancestry, thereby controlling for confounding due to variation in ancestry at the individual level as well as at the marker level. We showed that the effect size estimates were population-consistent across the subgroups of individuals with two chromosomes of African ancestry vs. two chromosomes of European ancestry but that
Table 2.Association with eGFR stratified by ancestry.
Index SNP Chr Positiona Gene No.
SNPsb DoFc Best
SNP Position
Coded
Allele bmetad SEmetad AdjustedP FST iHSCEU iHSYRI rs1933182 1 109801361 SYPL2 31 3.62 rs12136063 109815693 G 0.426 0.166 0.037 0.246 20.425 0.746
rs267734 1 149218101 ANXA9 40 6.63 rs3754210 149220885 G 20.296 0.152 0.336 0.084 20.163 21.136
rs1260326 2 27584444 GCKR 41 6.28 rs13392197 27657618 C 20.688 0.386 0.472 0.015 NA 21.079
rs13538 2 73721836 NAT8 56 4.79 rs2567603 73839633 G 0.846 0.383 0.130 NA 1.867 NA
rs7422339 2 211248752 CPS1 35 4.65 rs2287413 211325773 C 0.573 0.351 0.476 0.055 21.404 NA
rs347685 3 143289827 TFDP2 33 5.04 rs11569291 143152375 A 21.670 0.575 0.019 NA 0.322 NA
rs17319721 4 77587871 SHROOM3 74 8.98 rs10025494 77408404 A 0.372 0.159 0.173 0 20.480 0.801
rs11959928 5 39432889 DAB2 26 4.70 rs700242 39420645 A 20.255 0.161 0.531 0.035 0.029 20.128
rs6420094 5 176750242 SLC34A1 24 4.99 rs10037055 176623885 G 0.381 0.147 0.049 0.237 20.552 0.171
rs881858 6 43914587 VEGFA 9 4.62 rs744103 43913340 T 0.213 0.163 0.884 0.281 0.937 1.984
rs2279463 6 160588379 SLC22A2 42 8.33 rs2774225 160621171 G 0.559 0.147 1.1661023
0.004 21.747 0.648
rs6465825 7 77254375 PHTF2 56 6.52 rs12705112 77380997 C 21.473 0.511 0.026 NA 20.786 NA
rs4744712 9 70624527 PIP5K1B/ FAM122A
103 8.89 rs17482181 70577820 C 0.705 0.178 6.3261024 0.031 21.315 20.109
rs10794720 10 1146165 WDR37 38 6.73 rs6560711 1158563 A 20.410 0.180 0.156 0.009 0.711 1.591
rs4014195 11 65263398 OVOL1 37 6.22 rs489574 65299315 G 0.469 0.170 0.035 0.006 20.358 20.025
rs10774021 12 219559 SLC6A13 35 6.18 rs486098 258918 C 0.349 0.170 0.245 0.020 20.507 21.843
rs626277 13 71245697 DACH1 21 4.38 rs9564840 71235100 A 20.759 0.412 0.287 NA 0.648 NA
rs2467853 15 43486085 SLC30A4 72 4.85 rs6493153 43561217 A 20.516 0.162 0.007 NA NA 21.637
rs491567 15 51733885 WDR72 98 9.46 rs4332691 51677654 C 0.929 0.289 0.012 0.198 21.380 NA
rs1394125 15 73946038 UBE2Q2 23 4.16 rs335711 73971795 C 20.232 0.160 0.614 0.040 20.840 22.534
rs12917707 16 20275191 UMOD 14 4.43 rs4522429 20293616 C 0.260 0.161 0.472 0.113 0.790 0.441
rs9895661 17 56811371 BCAS3/TBX2 15 4.17 rs11079428 56821483 T 0.535 0.166 0.005 0.467 21.631 0.289
rs12460876 19 38048731 SLC7A9 63 7.99 rs17272267 38063033 G 20.713 0.280 0.086 0.087 22.373 NA
a
Positions are based on NCBI build 36.
bShown are the nominal numbers of SNPs in the set for each locus.
c‘‘DoF’’ indicates the effective degrees of freedom for each locus, which is the correction factor used to adjustp-values. dbmetaand SE
allele frequencies differed substantially. Our fine-mapping ap-proach identified SNPs more strongly associated with eGFR than the index SNPs originally discovered in individuals of European ancestry. In addition, we demonstrated that local ancestry can mask genotypic effects. Consequently, our approach explained an increased proportion of phenotypic variance. Taken together, 11 loci explained 14.2% of the variance in eGFR. The approach implemented in this study can explain some of the missing heritability by simultaneously identifying more strongly associated SNPs, controlling for confounding due to ancestry, and identifying secondary associations, thereby enhancing disease and trait locus mapping in admixed as well as ancestrally homogenous popula-tions.
Materials and Methods
Ethics approval for the Howard University Family Study (HUFS) was obtained from the Howard University Institutional Review Board and written informed consent was obtained from each participant. All clinical investigation was conducted accord-ing to the principles expressed in the Declaration of Helsinki.
The HUFS is a population-based genetic epidemiology study of African Americans in the Washington, D.C. metropolitan area. We analyzed 1,018 unrelated individuals [17]. Using the Affymetrix Genome-Wide Human SNP Array 6.0 and established quality control filters, we obtained genome-wide genotypes for 808,465 autosomal single nucleotide polymorphisms (SNPs) [17]. In order to address possible confounding due to variation in ancestry, we first estimated the local ancestry (0, 1, or 2 chromosomes of African ancestry) for 797,831 unique autosomal SNPs using LAMPANC version 2.3 [18] and HapMap Phase II+III CEU and YRI reference allele frequencies (http://hapmap. ncbi.nlm.nih.gov/downloads/frequencies/2010-08_phaseII+III/). Genome-wide, the average proportion of African ancestry was 0.799 (Supplementary Figure S4). Individual admixture propor-tions or global ancestry calculated from these estimates of local ancestry correlated very highly (r2
~0:974) with estimates from
STRUCTURE [19] using a panel of 2,076 ancestrally informative markers [20]. Our approach improves upon previous methodol-ogy [21] by assessing local ancestry for every genotyped marker rather than relying on local ancestry estimates at a small number of ancestrally informative markers and extrapolation of local ancestry for other markers.
Recognizing that the originally discovered index SNP might not be the most strongly associated SNP in follow-up samples, we followed a previously described fine-mapping strategy [12]. First, a region of linkage disequilibrium (LD) surrounding the index SNP was defined with bounds determined by the SNPs most distant to the index SNP with r2
$0.3 using the HapMap CEU LD data (http://hapmap.ncbi.nlm.nih.gov/downloads/ld_data/latest/). Second, we estimated the covariance matrix for this set of SNPs using our sample genotypes. Third, this covariance matrix was spectrally decomposed and the effective degrees of freedom, Neff, was estimated using the relationship
Neff~ P
K
k~1 lk
2,
PK
k~1 l2k
, in whichlk is the kth eigenvalue
of theK6Kcovariance matrix for theKSNPs in the set [22]. For the locus, the significance threshold was set at0
:05
Neff. We did not correct for multiple loci because testing multiple loci in a follow-up study does not constitute a family of tests [23].
Serum creatinine levels were estimated on fasting samples using the modified Jaffe´ method. eGFR was calculated using the simplified Modification of Diet in Renal Disease Study equation
[2,24]: (eGFR (ml/min/1.73 m2) = 1866(serum creatini-ne)21
.1546age20
.203 (60.742 if female) (61.210 if black). Due to non-normality, the distribution of eGFR was transformed using a Box-Cox transformation (Supplementary Figure S5). We winsor-ized the distribution at63 standard deviations to reduce residual positive kurtosis. We then performed linear regression for eGFR on genotype assuming an additive genetic model, stratified by local ancestry and adjusted for age, sex, and global ancestry [11], following the model used in the original publications (in which neither hypertension nor type 2 diabetes were significant covariates) [6,7]. We reported effect size estimates oriented with respect to 0, 1, or 2 copies of the allele listed as ‘‘coded.’’ Covariate adjustment for local ancestry assumes that ancestry effects are additive whereas our stratification approach is model-free in this regard. Covariate adjustment for local ancestry also assumes that local ancestry and genotype are independent, whereas local ancestry and genotype are known to covary [25,26,27]. Our stratification approach is based on the fact that genotype cannot be confounded by local ancestry within a homogeneous stratum of local ancestry. Finally, we combined the three sets of regression coefficients and standard errors using inverse variance-weighted fixed effects meta-analysis [28]. The fixed effect model assumes that inferential interest is limited to the observed local ancestry strata whereas the random effects model assumes that the observed local ancestry strata are part of a larger set of possible strata. Given that our study design limits local ancestry to three possible strata (i.e., 0, 1, or 2 chromosomes of African ancestry), the fixed effects model is more appropriate. We performed conditional analysis for associated loci by following the same stratified regression approach, with the addition of an additive covariate for the genotype of the most strongly associated SNP within the locus. Regression analysis was performed using R [29].
To test whether 10/11 SNPs showing significant allelic differentiation was excessive, we randomly sampled without replacement11 SNPs from the 797,831 SNPs included in our study. For each SNP, we performed a test of proportions using the HapMap CEU and YRI allele counts. We estimated ap-value by recording how many times out of 10,000 independent replicates $10/11 SNPs showed allelic differentiation.
Principal components analysis of the genome-wide data was performed to estimate how much genetic variance was explained by admixture [30]. Briefly, autosomal SNPs were pruned for linkage disequilibrium atr2
§0:3and then randomly thinned to 10,000 SNPs. These data were merged with genotype data for HapMap CEU and YRI unrelated individuals. The number of significant principal components was assessed using the minimum average partial test.
De novo genotyping for rs73885319 and rs71785313 was performed using the iPLEX Gold assay on the MassArray platform (Sequenom, San Diego, CA). PCR and extension primers were designed using MassArray designer software and publicly available sequence data. Genotyping success rates were 98.1% and 97.6%, respectively. Quality control was assessed by testing for Hardy-Weinberg equilibrium.
Supporting Information
Figure S1 Local genetic architectures for the 23 loci.For each locus, the set of SNPs was bounded by the two SNPs farthest from the query SNP for whichr2
§0
:3in pairwise comparison
light blue curve depicts the recombination rate from the combined HapMap Phase II data. Linkage disequilibrium based on the HUFS sample is color-coded red forr2to the top SNP between 0.8 and 1.0, orange forr2between 0.5 and 0.8, blue forr2between 0.2 and 0.5, and gray forr2
between 0 and 0.2. Green arrows indicate the direction of transcription.
(PDF)
Figure S2 Principal components analysis.Red represents CEU, blue represents YRI, and black represents the HUFS sample. Only the first principal component explained a significant amount of genetic variance.
(PNG)
Figure S3 Genome-wide Manhattan plots.(A) Unstratified by ancestry. (B) Stratified by ancestry.
(PNG)
Figure S4 Genome-wide distribution of admixture pro-portion.
(PNG)
Figure S5 Density plots. The phenotypic distribution of eGFR was Box-Cox transformed to reduce skew using the
transformationeGFR
l {1
l with the maximum likelihood estimate l~0
:545. The resulting distribution was winsorized at63 SD to
reduce kurtosis. These adjustments reduced skew from 2.4 to20.1
and reduced kurtosis from 25.2 to 1.0. Units for unadjusted glomerular filtration rate are mL/min/1.73 m2.
(PDF)
Table S1 Percent variance explained among associated loci.
(DOC)
Table S2 Ancestry effects among the associated loci.
(DOC)
Table S3 Significant secondary associations.
(DOC)
Acknowledgments
The contents of this publication are solely the responsibility of the authors and do not necessarily represent the official view of the National Institutes of Health. We thank the participants of the Howard University Family Study. We thank the anonymous reviewers and the editor for their comments which helped to improve this manuscript.
Author Contributions
Conceived and designed the experiments: AA CNR. Performed the experiments: APD HH MRE NPG. Analyzed the data: DS AH APD JZ HH MRE GC NPG AA. Contributed reagents/materials/analysis tools: MFC CNR. Wrote the paper: DS AA CNR.
References
1. Coresh J, Selvin E, Stevens LA, Manzi J, Kusek JW, et al. (2007) Prevalence of chronic kidney disease in the United States. JAMA 298: 2038–2047. 2. National Kidney Foundation (2002) K/DOQI clinical practice guidelines for
chronic kidney disease: evaluation, classification, and stratification. Am J Kidney Dis 39: S1–S266.
3. Tarver-Carr ME, Powe NR, Eberhardt MS, LaVeist TA, Kington RS, et al. (2002) Excess risk of chronic kidney disease among African-Americanversus white subjects in the United States: a population-based study of potential explanatory factors. J Am Soc Nephrol 13: 2363–2370.
4. Fox CS, Yang Q, Cupples LA, Guo C-Y, Larson MG, et al. (2004) Genomewide linkage analysis to serum creatinine, GFR, and creatinine clearance in a community-based population: the Framingham Heart Study. J Am Soc Nephrol 15: 2457–2461.
5. Langefeld CD, Beck SR, Bowden DW, Rich SS, Wagenknecht LE, et al. (2004) Heritability of GFR and albuminuria in Caucasians with type 2 diabetes mellitus. Am J Kidney Dis 43: 796–800.
6. Ko¨ttgen A, Glazer NL, Dehghan A, Hwang S-J, Katz R, et al. (2009) Multiple loci associated with indices of renal function and chronic kidney disease. Nat Genet 41: 712–717.
7. Ko¨ttgen A, Pattaro C, Boger CA, Fuchsberger C, Olden M, et al. (2010) New loci associated with kidney function and chronic kidney disease. Nat Genet 42: 376–384.
8. Kao WH, Klag MJ, Meoni LA, Reich D, Berthier-Schaad Y, et al. (2008)MYH9 is associated with nondiabetic end-stage renal disease in African Americans. Nat Genet 40: 1185–1192.
9. Kopp JB, Smith MW, Nelson GW, Johnson RC, Freedman BI, et al. (2008) MYH9is a major-effect risk gene for focal segmental glomerulosclerosis. Nat Genet 40: 1175–1184.
10. Genovese G, Friedman DJ, Ross MD, Lecordier L, Uzureau P, et al. (2010) Association of trypanolytic ApoL1 variants with kidney disease in African Americans. Science 329: 841–845.
11. Shriner D, Adeyemo A, Rotimi CN (2011) Joint ancestry and association testing in admixed individuals. PLoS Comput Biol 7: e1002325.
12. Ramos E, Chen G, Shriner D, Doumatey A, Gerry NP, et al. (2011) Replication of genome-wide association studies (GWAS) loci for fasting plasma glucose in African-Americans. Diabetologia 54: 783–788.
13. Gauderman WJ (2002) Sample size requirements for matched case-control studies of gene-environment interaction. Stat Med 21: 35–50.
14. Rosenberg NA, Nordborg M (2006) A general population-genetic model for the production by population structure of spurious genotype-phenotype associations in discrete, admixed or spatially distributed populations. Genetics 173: 1665– 1678.
15. McClellan J, King M-C (2010) Why it is time to sequence. Cell 142: 353–355. 16. Liu CT, Garnaas MK, Tin A, Kottgen A, Franceschini N, et al. (2011) Genetic association for renal traits among participants of African ancestry reveals new loci for renal function. PLoS Genet 7: e1002264.
17. Adeyemo A, Gerry N, Chen G, Herbert A, Doumatey A, et al. (2009) A genome-wide association study of hypertension and blood pressure in African Americans. PLoS Genet 5: e1000564.
18. Sankararaman S, Sridhar S, Kimmel G, Halperin E (2008) Estimating local ancestry in admixed populations. Am J Hum Genet 82: 290–303.
19. Falush D, Stephens M, Pritchard JK (2003) Inference of population structure using multilocus genotype data: linked loci and correlated allele frequencies. Genetics 164: 1567–1587.
20. Chen G, Shriner D, Zhou J, Doumatey A, Huang H, et al. (2010) Development of admixture mapping panels for African Americans from commercial high-density SNP arrays. BMC Genomics 11: 417.
21. Deo RC, Reich D, Tandon A, Akylbekova E, Patterson N, et al. (2009) Genetic differences between the determinants of lipid profile phenotypes in African and European Americans: the Jackson Heart Study. PLoS Genet 5: e1000342. 22. Bretherton CS, Widmann M, Dymnikov VP, Wallace JM, Blade´ I (1999) The
effective number of spatial degrees of freedom of a time-varying field. J Climate 12: 1990–2009.
23. The Wellcome Trust Case Control Consortium (2007) Genome-wide association study of 14,000 cases of seven common diseases and 3,000 shared controls. Nature 447: 661–678.
24. Levey AS, Bosch JP, Lewis JB, Greene T, Rogers N, et al. (1999) A more accurate method to estimate glomerular filtration rate from serum creatinine: a new prediction equation. Ann Intern Med 130: 461–470.
25. Qin H, Morris N, Kang SJ, Li M, Tayo B, et al. (2010) Interrogating local population structure for fine mapping in genome-wide association studies. Bioinformatics 26: 2961–2968.
26. Wang X, Zhu X, Qin H, Cooper RS, Ewens WJ, et al. (2011) Adjustment for local ancestry in genetic association analysis of admixed populations. Bioinfor-matics 27: 670–677.
27. Shriner D, Adeyemo A, Ramos E, Chen G, Rotimi CN (2011) Mapping of disease-associated variants in admixed populations. Genome Biol 12: 223. 28. de Bakker PI, Ferreira MA, Jia X, Neale BM, Raychaudhuri S, et al. (2008)
Practical aspects of imputation-driven meta-analysis of genome-wide association studies. Hum Mol Genet 17: R122–R128.
29. R Development Core Team (2011) R: A Language and Environment for Statistical Computing. Vienna, Austria: R Foundation for Statistical Computing. 30. Shriner D (2011) Investigating population stratification and admixture using