Original Article
Fault detection of a spur gear using vibration signal
with multivariable statistical parameters
Songpon Klinchaeam, Nopdanai Ajavakom*, and Withaya Yongchareon
Department of Mechanical Engineering, Faculty of Engineering, Chulalongkorn University, Pathum Wan, Bangkok, 10330 Thailand.
Received: 18 October 2013; Accepted: 5 June 2014
Abstract
This paper presents a condition monitoring technique of a spur gear fault detection using vibration signal analysis based on time domain. Vibration signals were acquired from gearboxes and used to simulate various faults on spur gear tooth. In this study, vibration signals were applied to monitor a normal and various fault conditions of a spur gear such as normal, scuffing defect, crack defect and broken tooth. The statistical parameters of vibration signal were used to compare and evaluate the value of fault condition. This technique can be applied to set alarm limit of the signal condition based on statistical parameter such as variance, kurtosis, rms and crest factor. These parameters can be used to set as a boundary decision of signal condition. From the results, the vibration signal analysis with single statistical parameter is unclear to predict fault of the spur gears. The using at least two statistical parameters can be clearly used to separate in every case of fault detection. The boundary decision of statistical parameter with the 99.7% certainty ( 3 ) from 300 referenced dataset and detected the testing condition with 99.7% ( 3 ) accuracy and had an error of less than 0.3 % using 50 testing dataset.
Keywords: condition monitoring, vibration signals, spur gear fault, time domain, multivariable statistical parameter
1. Introduction
In the past decades, many successful efforts have been made to use vibration analysis as a means for condition based monitoring (CBM) of rotating machinery. A number of methods, such as time domain analysis, frequency domain analysis, time- frequency analysis and pattern recognition, have shown a high potential for the vibration signal (Samanta, 2004). Vibration monitoring is concerned with the collection and interpretation of vibration signal to support maintenance decision. The vibration signal can show a typical signal pattern produced by a localized fault in the various compo-nents of rotating machine (Jardine et al., 2006). The vibration signal can used the impact signal at a local fault on the teeth of spur gears. A shock was introduced and excited high
frequency resonance of the whole structure between rack and pinion in one revolution (Halim et al., 2008). The series of the broadband burst signals excited by the shocks are further modulated in amplitude by two factors. First, the strength of the burst signal depends on the impacting event of rack and pinion. Thus, the normally amplitude is modu-lated by the rate at which the fault is passing through the load zone. Second, when the fault is moving, the transfer function of the transmission path varies with respect to the fixed position of response transducers (Yuan et al., 2009; Wua et al., 2013).
For a non-expert to carry out the diagnosis operations, it would be wise to present an approach to define the cause-symptom relationship for quick understanding of gearboxes. Presently, many diagnosis methods have been proposed to help a maintenance engineer to undertake analysis such as Artificial Neural Network (ANN) (Samanta, 2004). The diagnosis methods based on neural network and soft-computing technology need to be studied further to improve
* Corresponding author.
Email address: nopdanai.a@chula.ac.th
the diagnosis performance such as increasing diagnosis accuracy and decreasing diagnosis time.
This paper reports a study of vibration analysis techniques for condition based monitoring. Vibration signals were acquired on gearboxes using the LabVIEW program with in-house developed software. The accelerometers were attached on a surface of the housing bearing by a flat magnetic clamp and the proximity sensor was used to record a revolution signal. The signals were analyzed using typical time domain techniques to determine various statistical parameters. Then, the vibration signals detected on the spur gear were related to faults associated with the various simu-lated faults conditions and selected to consider the fault conditions using the boundary decision generating. Finally, these vibration signals can separate the various faults in this study.
2. Signal Processing
Signal analysis techniques are based on time domain. The analysis techniques were used to describe some useful statistical parameter and boundary decision from data training of referenced vibration signals. The key issue of the recognition and classification of the machine condition is feature analysis. Since the mechanical system is becoming more and more complex with stochastic characteristics, a deterministic time function is often not applicable to describe its behavior. Accordingly, it is difficult to evaluate the working status of the mechanical system from the raw time series data directly (Endo et al., 2009). Feature extrac-tion techniques, which transform the original signal space into the feature space, are needed to identify the patterns that are hidden in the raw time series data, but which charac-terize machine working status based on differences in the regularity, the sensitivity and the clustering characteristics among various features in boundary decision. Multivariable statistical parameters were applied to develop a non-linear feature extraction scheme to extract more sensitive and stable features, which can characterize a spur gear condition effec-tively. The fundamental principle mainly includes two steps, as discussed in the time domain in detail as follows.
2.1 Statistical parameters
To obtain various statistical parameter that effectively reflects the machine characteristics in the time domain, all parameters can be defined as follows (Klinchaeam et al., 2010; Heyns et al., 2012)
Mean: 1 1 N i i x x N
(1)Variance:
2 2 1 1 1 N i i x x N
(2)Skewness:
31 3 1 N
-i i x x N skewness
(3)Kurtosis:
41 4 1 -3 N i i x x N
kurtosis
(4)RMS: 2 1 1 N RMS i i
X RMS x
N
(5)Signal energy: 2 0 ( ) t x
E
x t dt (6)Max Peak:
( ) MAX
X Peak Max x t (7)
Crest Factor MAX RMS X CF X (8)
Where: N is a number of data. xi is an element of data x t( ).
x is a mean value of data x t( ), and is the standard devia-tion of data ( )x t .
These parameters are used to find the relationship of the data group of the vibration signals that are acquired from the various fault conditions. These analysis methods can be applied to complicated signals. Thus, the mechanical pheno-mena in the spur gear can be described.
2.2 Multivariable statistical parameter
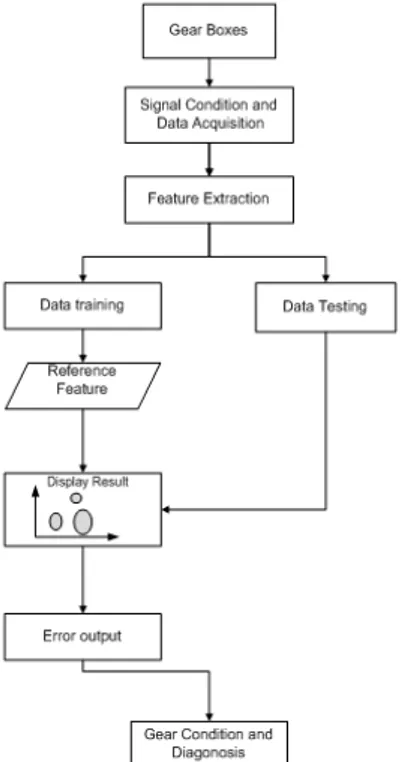
In order to determine the average value of the two random variables, the statistical approach was applied to create the boundary decision using correlation of two statis-tical parameters which can use the concept of ellipses equa-tion to generate boundary decision of multivariate statistical parameter in every interested parameter (Newland, 2003). The ellipses equation was used to create the boundary condition as shown below and would get the result as Figure 1 when compared to the referenced data training. The methodology of signal processing and data analysis is shown in Figure 1. All of time domain signals, equation (1)-(8), were used to calculate and to compare with parameters, (Klinchaeam, 2011).
2 2 1 2 1 22 2 1
3 3
P P
P i P i
X X Y Y
(9)
Where, XP1 is statistical parameter 1 in horizontal axis, YP2 is
clearly used to separate the group of spur gear fault detec-tion. Thus, this method can be used to monitor and set an alarm limit of the gearbox monitoring system.
3. Experiments
This study using the gear boxes run at a speed of 1440 rpm, with various faults, such as normal, scuffing tooth, broken tooth, and crack tooth, (Wua et al., 2013; Yuan et al., 2009), as shown in Figure 2. All fault conditions were simu-lated on the one tooth of spur gear as follows:
Normal (N) as simulated normal condition
Fault 1 (F1) as scuffing 50% of contact area, (single tooth)
Fault 2 (F2) as cracking 50% of tooth width, (single tooth)
Fault 3 (F3) as broken 50% of tooth height, (single tooth, broken flat)
The real defect of spur gear would generate many defects on a tooth. This study simulated faults with approxi-mately 50% damage because the important signal pattern on time domain of every fault condition can be described the characteristic vibration signature. If the analysts know the vibration signal pattern, they can diagnose the fault signal in the time domain and can use to confirm the data evaluation. The vibration and pulse signals were acquired from an accelerometer and a proximity sensor, using in-house developed LabVIEW program. A schematic diagram of data acquisition (DAQ) system is shown in Figure 3. This system consists of an accelerometer, a proximity sensor, and a DAQ
device with in-house developed LabVIEW software. In this study, National Instruments (NI) DAQ card high resolution device, 24-bit, PXI 4462, was used to acquire and digitize both vibration and crank angle signals which were recorded with sampling frequency of 100 kHz, number of sampling 100k sample/s and saved into files for later analysis. The vibration signals were measured simultaneously from an accelerometer attached on the housing bearing as shown in Figure 4. A flat magnetic clamp was used to hold a Bruel &
Figure 1. Data Analysis Methodology (Klinchaeam, 2011) Figure 2. Testing Condition
Figure 3. Schematic diagram of a data acquisition system (Klinchaeam, 2011)
Kjaer accelerometer, Model 4397, on horizontal, vertical and axial axes with the proximity sensor attached simultaneously to measure one pulse per revolution from a shaft, as shown in Figure 5. All calculations were averaged over 3000 cycles of each testing condition.
4. Results and Discussion
The typical vibration signal acquired from the gearbox is a random signal type that occurs from a spur gear of test rig. The signal in this section will described the characteris-tics of the vibration signal from gearbox. This study is concerned with the time domain signal analysis technique that is used to identify the abnormal signal pattern of the gearbox, using multi-statistical parameters. The time domain signal analysis technique can be used normally to analyse the random signal that can then be used to set an alarm limit of the system dynamic. The recorded vibration signals can help to understand not only of the gearbox impaction processes but also can be used to identify abnormal conditions from the tooth defects. The test rig was fixed to the ground with high stiffness like a rigid body, The natural frequency of the structural test rig was not of concern because this technique can reflect to the pattern recognition of the random vibration signals that were used to classify the abnormal signal from normal operation by a data base or a signal reference in normal operation. Thus, the reference parameter can be a parameter calculated from frequency domain or time-frequency domain that is used to identify the fault condition but this study used the statistical parameter of time domain to analysis the fault condition and to create boundary condi-tion.
All of the example signals of each testing condition are shown in Figure 5A (time domain), Figure 5B (crank domain) and are normal (N), Fault 1 by scuffing 50% (F1), fault 2 by crack tooth 50% (F2) and fault 3 by broken tooth 50% (F3). The vibration signals of each fault are produced by gearbox rotation running under steady load (20 Nm) applied by the magnetic brake as shown in Figure 4 in each testing condition. The pattern of the vibration signal on the horizontal axis can be seen in the time domain signal as shown in Figure 5. The time domain signal presents the horizontal axis only because the fault signal may be used to identify and analyze.
Thus, the result can use only one direction for gear fault analysis. In this paper, the vibration signals in the hori-zontal axis of each testing condition were used to determine various statistical parameters such as mean, variance, skew-ness, kurtosis, RMS, crest factor and signal energy using equation (1)-(9). The statistical parameters can help to describe the relationship between normal and fault signals in each condition. Only one statistical parameter cannot be used to separate the vibration signal of all spur gear fault condition as shown in Figure 6. The statistical parameters that can be used to analyse were variance, kurtosis, RMS and crest factor.
These statistical parameters can be described clearly when, at least, two parameters were used to analyse together. The result of the multi-statistical parameter is shown in Figure 7 and represents the vibration signal. In Figure 7, the vibration signals were calculated from all data points in each testing condition. The statistical parameters were calculated by rotation per cycle using the pulse signal from the proxi-mity sensor over 300 datasets in each condition. It can be seen clearly The horizontal axis as shown in figure 7 were variance, kurtosis, Crest Factor (CF) and RMS, respectively four groups of data are associated with normal and fault condition that can be separated. The dash line is the reference boundary of data training.
Each testing condition was used to calculate with a training dataset to generate the decision boundary. The statistical parameters can help to describe the relationship between normal and fault signals in each testing condition. The decision boundary used the covariance between normal and abnormal signals to separate the data group. At least, two statistical parameter such as variance and RMS was
Figure 5. (A.) Time Domain of raw data, (B.) Crank Domain convert from Time Domain
used to analyse as shown in Figure 7 and then the concept used in signal processing of section 2. Based on the statistical feature vector, the decision boundary vector was trained by the reference dataset using normal, Fault 1 (F1), Fault 2 (F2), Fault 3 (F3), respectively.
The vibration signal analysis based on the decision boundary (DB) was easy to understand and to separate the group of the abnormal signals that differed from the normal data training. The DB vector must use the statistical feature vector of the reference data training to create the relationship between normal and faulty. If the signal has the similar relation patterns, the point of data will be a similar value and a similar distance value of the central concept. Figure 1 illus-trates the steps to analyse vibration signal using DB. The correlation of statistical parameters of this study used the RMS, variance, kurtosis and crest factor to separate a group of fault condition that has the similar correlation parameter out of others. The data testing was shown in Figure 7 using data testing of 50 datasets to verify the decision boundary. The new data testing appear inside the cycle of the decision boundary (dashed line) without any points out of boundary as shown in each group of fault condition. The error was
Figure 7. Multi-statistical parameter testing with decision boundary
calculated is to less than 0.3% of the normal distribution. The high sensitivity was used to classify the fault condition based on the data training. If the data trainings were used to calcu-late many datasets, the error of data testing will be near zero. This technique can be used to separate a group of data that have a statistical feature vector for various abnormal conditions. Figure 7 illustrates the comparison with a group of data and to classify with the statistical parameter using multi-parameter value of testing condition. In the result, the group of the data can be separated into four groups using the multi-statistical parameter illustration. The four groups are the normal (N), fault 1 by scuffing 50% (F1), fault 2 by crack tooth 50% (F2), and fault 3 by broken tooth 50% (F3).
5. Conclusions
This work has demonstrated through a range of experimental results that vibration signal analysis technique has a potential for investigating the behavior of gearbox rotation. The vibration signal of a spur gear damage could use time-domain signal analysis with Boundary Decision (BD) to clearly 4 classify the fault pattern signal time-domain as well as can be used to separate the gearbox fault condition. This technique can be used as a tool to detect for fault detec-tion. However, the knowledge of rotating machine processes and signal processing techniques is necessary for statistical analysis based on the co-parameter of a feature vector that was used to analysis or to classify using by boundary deci-sion analysis. This method could be used to separate the fault conditions without the knowledge of the gearbox operation in order to set up the alarm limit of the condition monitoring system. For future work, it is necessary to use advanced signal processing technique to improve accuracy of the gearboxes state monitoring and to improve vibration monitor-ing technique for reliability systems.
Acknowledge
The author would like to thank the Graduate School, Chulalongkorn University, for the 100th Anniversary Chulalongkorn University Fund for Doctoral Scholarship.
References
Endo, H., R.B.Randall, and C.Gosselin. 2009. Differential diagnosis of spall vs.cracks in the gear tooth fillet region: Experimental validation. Mechanical System and Signal Processing. 23, 636-651.
Halim, E. B., Choudhury, M. S., Shah, S. L., and Zuoc, M. J. 2008. Time domain averaging across all scales: A novel method for detection of gearboxes faults. Mechanical Systems and Signal Processing. 22, 261-278.
fluctuating loads and operating speed. Mechanical Systems and Signal Processing. 27, 651-666.
Jardine, A. K., Lin, D., and Banjevic, D. 2006. A review on machinery diagnostics and progonostics implement-ing condition-based maintenance. Machanical Systems and Signal Processing. 20, 1483-1510.
Klinchaeam, S. 2011. Fault Detection of Spur Gear Using Sta-tistical Analysis of Time-Domain Vibration Signal .
Master’s Thesis: Chulalongkorn University, Thailand. Klinchaeam, S., and Nivesrangsan, P. 2010. Condition moni-toring of valve clearance fault on a small four strokes petrol engine using vibration signals. Songklanakarin Journal of Science and Technology.(32), 619-625. Newland, D. 2003. An introduction to Random Vibrations,
Spectral and Wavelet Analysis. Jonh Wiley and Sons, New York, USA.
Samanta, B. 2004. Artificial neural networks and genetic algorithms for gear fault detection. Mechanical System and Signal Processing. 18, 1273-1282. Wua, T., Chen, J.C., and Wang, C.C. 2013. Characterization of
gear faults in variable rotating speed using Hilbert-Huang Transformand instantaneous dimensionless frequency normalization. Mechanical Systems and Signal Processing. 30, 103-122.