VALIdAtIoN oF EQuAtIoNS oF SKINFoLd
tHICKNESS FoR FAt MASS EStIMAtIoN IN
HIV/AIdS SuBJECtS: A CoMPARISoN oF
duAL ENERGY X-RAY ABSoRPtIoMEtRY ANd
CoMPutEd toMoGRAPHY oF ABdoMEN
ALEX ANtoNIo FLoRINdo1; MARIA do RoSARIo dIAS dE oLIVEIRA LAtoRRE2;
AuRÉLIo BoRELLI3; MANoEL dE SouZA RoCHA3; ALuISIo AuGuSto
CotRIM SEGuRAdo4
1 Escola de Artes, Ciências e Humanidades – Universidade de São Paulo;
2 Departamento de Epidemiologia, Faculdade de Saúde Pública – Universidade de São Paulo; 3 Instituto de Radiologia, Faculdade de Medicina – Universidade de São Paulo;
4 Departamento de Moléstias Infecciosas e Parasitárias, Faculdade de Medicina – Universidade de São Paulo.
ABStRACt
oRIGINAL
VALIdAtIoN oF EQuAtIoNS oF SKINFoLd tHICKNESS FoR FAt MASS EStIMAtIoN IN HIV/AIdS SuBJECtS: A CoMPARISoN oF duAL ENERGY X-RAY ABSoRPtIoMEtRY ANd CoMPutEd toMoGRAPHY oF ABdoMEN
The objective of the present study was to develope and to validate equations based on skinfold thickness for the estimation of percent body fat (%BF) in HIV/AIDS subjects using dual energy X-ray absorptiometry (DEXA) and computed tomography of abdomen (CTA) as the gold standards. The sample included 15 adult Brazilian HIV/AIDS subjects (10 men and 5 women). Mean age was 36.9 years (SD 8.2) and mean %BF by DEXA was 18.2 (SD 9.5). The estimation of %BF was done using linear regression models, and the independent variables were the sum of one to seven skinfold thickness. The skinfold thickness was compared with DEXA and CTA. The Durnin & Womersley equation was also tested. The best equation for males was [%BF = 3.385 + 0.279 * (axillary + subscapular); r2=0.83] and for females was [%BF = -24.323 + 0.736 * (suprailiac + abdominal + medial calf); r2=0.81]. The total error of the estimate of %BF in HIV/AIDS was <3.5%, the means were not different between males and females from the values measured by DEXA, and the estimated values were highly correlated with DEXA and CTA. The 95% limits of agreement between HIVE and DEXA by the Bland-Altman method were good. The Durnin & Womersley equation was also tested, and the values showed signifi cant differences in the means (males) and the total error was >3.5% for males and females in the comparison with DEXA. The HIV/AIDS equation complied with all the validation criteria. We recommended this equation to be tested in larger samples for estimating %BF among HIV/AIDS subjects.
KEY-WORDS: body composition; HIV/AIDS; skinfold thickness; dual energy X-ray absorptiometry; computed tomography
of abdomen.
Recebido: 24/11/2008
Re-submissão: 09/01/2009 Aceito: 28/01/2009
INtRoduCtIoN
Changes in body composition such as accu-mulation of abdominal fat and metabolic abnor-malities such as hyperlipidemia are factors present in the life of HIV/AIDS subjects who regularly use
highly active antiretroviral therapy1. These
chan-ges obviously lead to increased risk for
cardiovas-cular disease2,3. Imaging methods such as whole
body dual energy X-ray absorptiometry (DEXA) and computed tomography of abdomen (CTA) are considered to be the gold standard for the
measu-rement of body composition4,5 and have been used
in studies on HIV-infected subjects1,6. However,
for developing countries such as Brazil, the cost of these exams is still very high, impairing and often preventing research on this area. An alternative for epidemiologic studies is to use more accessible me-thods anthropometrics as skinfold thickness (ST) in order to estimate the fat mass using equations. The search for an ideal equation for the estimate of body composition in the HIV/AIDS population has
been the objective of some investigators7. Andrade
et al (2002)8 recently validated the Durnin &
Wo-mersley (1974) equation (DWE)9 for the estimate
of fat mass in American HIV/AIDS subjects, even though this equation has been extensively used for
this specific population6,7,10.
The objective of the present study was to de-velope and to validate equations for estimating fat mass in HIV/AIDS subjects (HIVE) living in a de-veloping country.
MEtHodS
SubjectsThe sample consisted of 15 HIV-infected adults, 10 men and 5 women. The study was con-ducted from October 2001 to February 2002. All subjects admitted to the study had been on highly active antiretroviral therapy including protease inhibitors and reverse transcriptase inhibitors for at least 3 months. Samples size was calculated ba-sed on the mean correlation coefficients obtained in previous studies carried out to validate the
esti-mate of fat mass5,11,12,13.
data Collection
This was a validation study carried out in the AIDS Clinic, a health unit linked to the Depart-ment of Infectious Diseases of School of Medicine of São Paulo University. The unit is located in the central region of the São Paulo city and provides care for 4000 registered HIV/AIDS patients, being considered a reference center for multi-professio-nal health care and for research on persons living with HIV/AIDS. The Research Ethics Committee of all institutions approved the study and all sub-jects gave written informed consent to participate. Subjects were selected by consecutive sam-pling after a visit to the infectologist. Exclusion criteria were: presence of any active acute oppor-tunistic infection that might influence the results of analysis of body composition at the time of eva-luation, having been submitted to a surgical inter-vention such as liposculpture or liposuction up to three months before the study, presence of any di-sabling disease that would prevent measurements and examinations, being pregnant, and using cor-ticosteroids, anabolic steroids and hormonal con-traceptives because of the possible influence of these medications on body fat. DEXA and CTA were performed at the Radiology Institute of the University Hospital, São Paulo University, by te-chnicians specifically trained.
dual Energy X-ray Absorptiometry
DEXA used as the gold standard for the de-termination of fat mass. The exam was carried out using a model QDR 4500 Hologic apparatus (Hologic Inc., Waltham, MA, USA). Standard procedures were adopted to position the subjects during the acquisition phase of the exam. Patients were first instructed to remove any metal objects and their shoes and to lie in dorsal decubitus in the apparatus. Crosswise scans were then obtained from the head to the feet and the images were la-ter analyzed with specific Hologic software. The fat mass was determined in percentual (%BF) and kilograms (kg).
Computed tomography of Abdomen
CTA was used as the gold standard for the assessment of total abdominal fat on the L4-L5
plane. The procedure was carried out using a CT PACE apparatus (General Electric, Milwaukee, WI, USA). A digital image of the lumbar region was first obtained for the determination of the L4-L5 disc plane. The field of view was supposed to permit the visualization of the entire abdominal wall. The areas of visceral fat and subcutaneous fat as well as their sum were then measured on this image to determine total abdominal fat. For the determination of visceral fat area, a line was first traced with the electronic cursor along the fascia transversalis anterior and along the fascia of the square lumbar musculature posterior, excluding the vertebral body. After this region was delimi-ted, the computer of the tomograph was program-med to calculate only the fat present in this region and the minimum and maximum coefficients of attenuation corresponding to fat were determined. Coefficients of –250 to –50 Hounsfield units were adopted in the present study. Thus, the equipment excluded from the calculation structures not con-sisting of fat. The area of subcutaneous fat was then calculated by tracing a line immediately ex-ternal to the skin contouring the entire abdominal circumference. At the point where this line met the initial point of the tracing, the line was made to pass anteriorly to the muscular plane and internally to the skin plane along the entire abdominal circu-mference. The same procedure of non-fat structure exclusion was then repeated by adopting the same limit values of the coefficients of attenuation. The areas of visceral fat, subcutaneous fat and total ab-dominal fat were determined in squared
centime-ters (cm2).
Anthropometrics Measures
The biceps, triceps, subscapular, axillary, su-prailiac, abdominal, and medial calf ST were
mea-sured by the method of Norton et al (1996)14. Each
ST was measured three times and the mean value of the three measurements was calculated. The ST was measured with a Lange caliper with 1.0 milli-meters precision.
Height was measured three times and the mean value was calculated, and body weight was measu-red only once. The precision of the height mea-surement was 0.1 centimeters and the value was
obtained using a Sanny anthropometric tape fixed to the wall of the measuring room. The precision of the weight measurement was 0.1 kilograms and the value was obtained with a Filizola digital scale. A specifically trained professional made all mea-surements with extensive experience in the area of measurement and evaluation.
Body Composition Equations
The DWE used at estimated body density was:
Women: Db(g/cc)=1.1567 -0.0717 * log∑ (bi-ceps + tri(bi-ceps + subscapular + suprailiac)
Men: Db(g/cc)= 1.1765 -0.0744 * log∑ (bi-ceps + tri(bi-ceps + subscapular + suprailiac)
At the estimated for %BF was used the
for-mulas the Siri (1961)15:
%BF=
(
4.95 -4.50)
* 100.Db
To create HIVE we used the ST variables. The DEXA and CTA were used as the gold standard for comparison with HIVE and DWE.
Statistical Analysis
For the elaboration of specific HIVE, we cal-culated the Pearson correlation coefficient between fat mass of DEXA and each ST. after this simple linear regression models were estimated simple li-near regression models using one to seven ST as independent variable, which had the higher corre-lation was choose the begin procedure.
The Kolmogorov-Smirnov test showed that all variables had goodness-of-fitness for normal dis-tribution and the intraclass correlation coefficient was used to estimate the relation between fat mass values obtained by DEXA and DWE and HIVE values. The Student t-test was used to compare the mean values obtained DEXA to those estimated by the DWE and HIVE equations. Total error of the equations was calculated according to Lohman
(1992)16. The Bland & Altman method was used to
analyze agreement between the DWE and HIVE in the comparison with DEXA. The Pearson
cor-relation coefficient was used to estimate cor-relation between total fat abdominal obtained by CTA and total fat mass obtained by HIVE.
The research was approved by the Research Ethics
Committee of the School of Public Health, University of São Paulo, and by the Research Projects Analysis Committee of the Hospital das Clinicas, School of Medicine, University of São Paulo.
RESuLtS
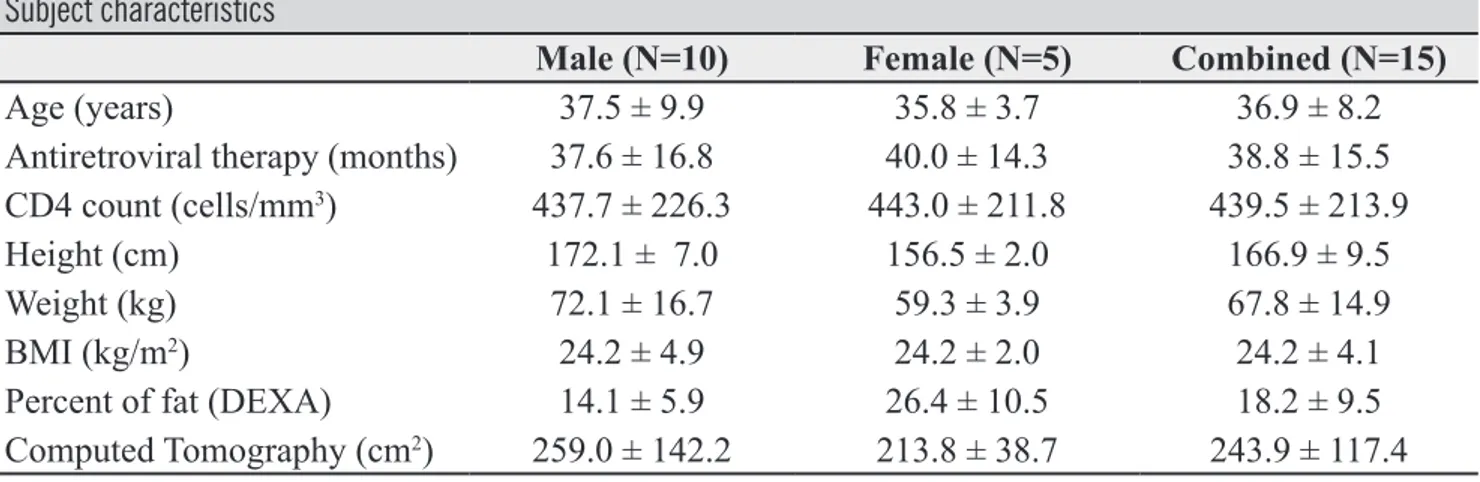
Table 1 shows the clinical and anthropometric characteristics of the study population. Most of the population (60%) was within the age range up to 35 years. Mean time of use of highly active anti-retroviral therapy was 37.6 ± 16.8 months for men and 40 ± 14.3 months for women. Only one man and one woman had CD4+ counts below 200 cells per cubic milimiter; however, since no problem was observed that might influence body compo-sition at the time of collection, it was decided to keep them in the analysis. With respect to anthro-pometric data, mean fat mass varied significantly in both sexes.
When ST variables was correlated with %BF (data not shown), the magnitude of the
correla-tions in increasing order was axillary, subscapular, abdominal, suprailiac, biceps, triceps and medial calf in men, suprailiac, abdominal, medial calf, axillary, biceps, triceps and subscapular in women. The equations for fat mass estimates are shown in Table 2. The best models were found to be 2 ST for men and 3 ST for women.
Comparison of the mean and correlation be-tween the values measured by DEXA and those es-timated by the equations showed that mean DWE values were significantly different in men in com-parison with the DEXA (Table 3). For women, no variable variable was highly correlated, but no sig-nificant differences were observed between means the DWE in comparison with the DEXA. The total error of the DWE was high in both sexes. With res-pect to the HIVE equations (Table 4), the values were found to be highly correlated with DEXA and no significant differences were observed between means The HIVE in comparison with DEXA either in men or in women. The total error of the HIVE was low in both sexes.
The body fat in kg obtained for HIVE was cor-related with total fat abdominal obtained by CTA (Figure 1). The %BF estimated for the HIVE had high agreement with the %BF measured for the DEXA (Figure 2).
table 1
Subject characteristics
Male (N=10) Female (N=5) Combined (N=15)
Age (years) 37.5 ± 9.9 35.8 ± 3.7 36.9 ± 8.2
Antiretroviral therapy (months) 37.6 ± 16.8 40.0 ± 14.3 38.8 ± 15.5
CD4 count (cells/mm3) 437.7 ± 226.3 443.0 ± 211.8 439.5 ± 213.9
Height (cm) 172.1 ± 7.0 156.5 ± 2.0 166.9 ± 9.5
Weight (kg) 72.1 ± 16.7 59.3 ± 3.9 67.8 ± 14.9
BMI (kg/m2) 24.2 ± 4.9 24.2 ± 2.0 24.2 ± 4.1
Percent of fat (DEXA) 14.1 ± 5.9 26.4 ± 10.5 18.2 ± 9.5
Computed Tomography (cm2) 259.0 ± 142.2 213.8 ± 38.7 243.9 ± 117.4
table 2
Regression equations for the estimate of percentage of fat
Regression equations r r2 s.e.e. (%)
Men %BF=5.062+0.496 * (AM) 0.91 0.81 2.56 %BF=3.385+0.279 * (AM+SB)1 0.92 0.83 2.42 %BF=3.970+0.168 * (AM+SB+AB) 0.91 0.81 2.55 %BF=4.185+0.126 * (AM+SB+AB+SI) 0.91 0.80 2.61 %BF=3.873+0.121 * (AM+SB+AB+SI+BI) 0.91 0.81 2.58 %BF=3.351+0.118 * (AM+SB+AB+SI+BI+TR) 0.92 0.82 2.46 %BF=3.023+0.112 * (AM+SB+AB+SI+BI+TR+MC) 0.92 0.82 2.46 Women %BF=-31.116+2.228 * (SI) 0.84 0.61 6.62 %BF=-26.047+0.843 * (SI+AB) 0.78 0.49 7.54 %BF=-24.323+0.736 * (SI+AB+MC)1 0.92 0.81 4.62 %BF=-28.112+0.623 * (SI+AB+MC+AM) 0.90 0.74 5.34 %BF=-28.311+0.557 * (SI+AB+MC+AM+BI) 0.88 0.71 5.72 %BF=-28.800+0.501 * (SI+AB+MC+AM+BI+TR) 0.89 0.73 5.44 %BF=-53.734+0.582 * (SI+AB+MC+AM+BI+TR+SB) 0.94 0.83 4.28
(BI), biceps; (TR), triceps; (SB), subscapular; (AM), axillary; (SI), suprailiac; (AB), abdominal; (MC), medial calf; (WC); 1. used equations
table 3
Comparison of percentage of fat measured by DEXA and estimated by EHIV and DWE
mean (s.d.) T test (p) ICC (r) TE (%)
Males %BFDEXA 14.1 ± 5.9 %BFHIVE 14.1 ± 5.4 0.986* 0.92** 2.0 %BFDWE 20.5 ± 6.8 <0.001* 0.71** 6.7 Females %BFDEXA 26.4 ± 10.5 %BFHIVE 26.4 ± 9.8 0.999* 0.86** 2.4 %BFDWE 34.0 ± 1.4 0.145* 0.03** 4.0 Combined %BFDEXA 18.2 ± 9.5 %BFHIVE 18.2 ± 2.3 0.993 0.96 2.2 %BFDWE 25.0 ± 2.2 <0.001 0.65 5.3
(ICC) Intraclass correlation coefficient; *in comparison with %BFDEXA (TE) Total error= √∑ (y-y’)2 /
N **p<0.05
Figure 1
Relationship between abdominal body fat by CTA with total body fat by HIVE (r=0.69; p=0.012) (combined male and fe-male).
Figure 2
Comparison of the %BF HIVE equation with %BF DEXA through the Bland-Altman method (combined male and female).
-10 -5 0 5 10 Dif ference (% fat HIV -% fat DEXA) 0 10 20 30 40
Mean (% fat DEXA + % fat HIV / 2) 0 100 200 300 400 500 0 4 8 12 16 20 24
Total body fat (Kilograms)
Abdominal
body
fat
(Square
dISCuSSIoN
Studies conducted in developed countries have attempted to determine the correlation between fat mass estimated by ST equations and the values
me-asured by DEXA5,11-13. Other studies on HIV/AIDS
subjects have also detected significant correlations between fat mass values obtained by ST equations
and the values obtained by DEXA6,10. More
recen-tly, two other studies used DEXA and magnetic re-sonance to validate anthropometric equations for
fat mass estimates in HIV/AIDS patients7,8.
With respect to the elaboration of specific equations for fat mass estimate, in women the suprailiac, abdominal and medial calf ST may
reflect a distribution of the gynoid type16 mainly
represented by the suprailiac ST, although with a tendency to accumulation in the abdominal re-gion due to the phenomenon of fat redistribution represented by the abdominal ST. In addition, the medial calf ST may represent a loss of fat in the limbs. The axillary and subscapular ST represen-ted well the distribution of fat observed in men in the present study, which may aggravate the already characteristic android effect commonly observed in males, consisting of a great accumulation of fat
in the central region16. Bell et al (1995)17 showed
that the suprailiac ST was important for women and the subscapular ST was important for men at %BF estimate in an English population with gro-wth hormone deficiency.
According to Lohman (1992)16, correlation
coefficients of 0.80 or higher are ideal for the va-lidation equations when compared with standard measurements. In the present study we observed that DWE was well correlated with standard va-lues in men, whereas low correlation coefficients were obtained for women. The studies using this DWE equation are controversial. Recently,
Andra-de et al. (2002)8 showed that this equation was
hi-ghly correlated with total fat measured by magne-tic resonance in North American adult HIV/AIDS patients. Positive results were obtained for other
populations, with correlations of more than 0.80
in adult Englishmen11,17, in English female and
male renal transplant recipients12, in adult
Austra-lian men5, and in adult Spanish men18. Other
stu-dies, however, have found correlations of less than 0.80 in the validation of this equation compared to
standard values for English women11 and for North
American HIV/AIDS men10.
With respect to the quality of the equations, although the methods may be well correlated there may be problems in agreement, especially
concer-ning the estimate of fat mass12. DWE was found to
overestimate both fat mass in men, with significant differences in mean values compared to standard values, whereas no such differences were observed for women. Other studies reported no significant differences in adult English women and men with
growth hormone deficiency17 or in adult and
elder-ly Australian men5. However, studies on English
recipients of kidney transplants12 and on adult
Spa-nish men18 showed significant differences between
the mean values predicted by this equation and the standard measured values. The mean values esti-mated by HIVE did not differ significantly from measured values.
The main problem of HIV/AIDS subjects is
the accumulation of abdominal fat1,3. The HIVE
was representative of this fat type, presenting rela-tionship with the CTA.
Lohman (1992)16 argued that it the total error
for the estimate of %BF should not exceed 3.5%. DWE overestimated fat mass both in women and in men, whereas HIVE yielded errors within ac-ceptable limits for both sexes. Other studies have shown that errors within acceptable limits were obtained with DWE when compared to gold
stan-dards in adult Spanish men18, although the errors
exceeded these limits in North American women19.
One limitation of this study is that the cross-validation of the equation was not tested in a lar-ger sample of HIV/aids subjects, which would be important to confirm the validity of the equations.
REFERêNCIAS
1. Carr A, Samaras K, Thorisdottir A, Kaufmann GR, Chisholm DJ, et al. Diagnosis, prediction, and natural course of HIV-1 protease-inhibi-tor-associated lipodystrophy, hyperlipidaemia, and diabetes mellitus: a cohort study. Lancet. 1999;353:2093-9.
2. Lewis W. Atherosclerosis in AIDS: Potential pa-thogenetic roles of antiretroviral therapy and HIV. J Moll Cel Cardiol. 2000;32:2115-29.
3. Carr A, Cooper DA. Images in clinical medicine: lipodystrophy associated with an HIV-protease inhibitor. N Engl J Med. 1998; 339:1296.
4. Erselcan T, Candan F, Saruhan S, Ayca T. Compa-rison of body composition analysis methods in cli-nical routine. Ann Nutr Metabol, 2000; 44:243-8. 5. Pritchard JE, Nowson CA, Strauss BJ, Carlson JS,
Kaymakci B. Evaluation of dual energy X-ray ab-sorptiometry as a method of measurement of body fat. Eur J Clin Nutr.1993; 47:216-28.
6. Paton NI, Macallan DC, Jebb AS, Noble C, Bal-dwin C, et al. Longitudinal changes in body com-position measured with a variety of methods in patients with AIDS. J Acquir Immune Defic Syndr Hum Retrovirol.1997;14:119-27.
7. Kotler DP, Rosenbaum K, Wang J, Pierson RN. Studies of body composition and fat distribution in HIV infected and control subjects. J Acquir Im-mune Defic Sindr Hum Retrovirol. 1999;20:228-37.
8. Andrade S, Lan SJJ, Engelson ES, Agin D, Wang J, Heymsfield SB, et al. Use of a Durnin-Womers-ley formula to estimate change in subcutaneous fat content in HIV-infected subjects. Am J Clin Nutr 2002;75:587-92.
9. Durnin JVGA, Womersley J. Body fat assessed from total body density and its estimation from skinfold thickness: measurements on 481 men and women aged from 16 to 72 years. Br J Nutr. 1974;32:77-97.
10. Corcoran C, Anderson EJ, Burrows B, Stanley T, Walsh M, et al. Comparison of total body po-tassium with other techniques for measuring lean body mass in men and women with AIDS wasting. Am J Clin Nutr. 2000;72:1053-8.
11. Stewart SP, Bramley PN, Heighton R, Green JH, Horsman A, et al. Estimation of body composition from bioelectrical impedance of body segments: comparison with dual-energy X-ray absorptiome-try. Br J Nutr, 1993;69:645-55.
12. Hart PD, Wilkie ME, Edwards A, Cunningham J. Dual energy X-ray absorptiometry versus skin-fold measurements in the assessment of total body fat in renal transplant recipients. Eur J Clin Nutr 1993; 47:347-52.
13. Van Den Ham FC, Kooman JP, Christiaans MH, Nieman FH, Van Kreel BK, et al. Body compo-sition in renal transplant patients: bioimpedance analysis compared to isotope dilution dual energy X-ray absorptiometry, and anthropometry. J Am Soc Nephrol. 1999;10:1067-79.
14. Norton K, Whittingham N, Carter L, Kerr D, Gore C, et al. Measurement Techniques in Anthropo-metry. In Anthropometric: A Textbook of Body Measurement for Sports and Health Courses, ed. Norton K and Olds T, 1996; pp 25-75, Sidney: University of New South Wales Press.
15. Siri WE. Body composition from fluid spaces and density: analisys of methods. In Techniques for measuring body composition, ed. Brozek J and Henschel A, 1961; pp. 223-224, Washington: DC: National Academy of Sciences.
16. Lohman TG. Advances in body composition as-sessment. 1992; Illinois: Human Kinetics.
17. Bell W, Davies JS, Evans WD, Scanlon MF. The validity of estimating total body fat and fat-free mass from skinfold thickness in adults with growth hormone deficiency. J Clin Endocrinol Metab,1995; 80:630-6.
In view of the present results, we believe that the specific equations created for HIV/AIDS sub-jects in this study are highly suitable for the
esti-mate of fat mass in this population, in addition to being better than the DWE.
AGRAdECIMENtoS:
Agradecemos à Fundação de Amparo a Pesquisa do Estado de São Paulo (FAPESP) pela bolsa de doutorado concedida a Alex Antonio Florindo (Processo 00/09482-8). Este estudo foi conduzido na clí-nica da AIDS, uma unidade de saúde vinculada ao Departamento de Moléstias Infecciosas e Parasitárias da Faculdade de Medicina da USP.
Universidade de São Paulo Rua: Arlindo Bettio, 1000 CEP: 03828-000 - São Paulo - SP.
E-mail: [email protected]
CoRRESPoNdêNCIA
18. Calbet JAL, Ramos AO, Cabrero JC, García CD. Una ecuación antropométrica para la determina-ción del porcentaje de grasa corporal en varones jóvenes de la población canaria. Med Clin (Barc.), 1997;108:207-13.
19. Irwin ML, Ainsworth BE, Stolarczyk LM and Heyward VH. Predictive accuracy of skinfold equations for estimating body density of Afri-can-American women. Med Sci Sports Exerc. 1998;30:1654-8.