Higher Dietary Choline and Betaine Intakes
Are Associated with Better Body Composition
in the Adult Population of Newfoundland,
Canada
Xiang Gao1,2, Yongbo Wang2,3, Edward Randell2, Pardis Pedram2, Yanqing Yi2, Wayne Gulliver2, Guang Sun2*
1College of Food Science and Engineering, Ocean University of China, No.5, Yu Shan Road, Qingdao, Shandong Province, China,2Faculty of Medicine, Memorial University, 300 Prince Philip Drive, St. John’s, NL, Canada,3The Department of Endocrinology, the First Affiliated Hospital of Dalian Medical University, Dalian, Liaoning, China
*gsun@mun.ca
Abstract
Background
Choline is an essential nutrient and betaine is an osmolyte and methyl donor. Both are important to maintain health including adequate lipid metabolism. Supplementation of die-tary choline and betaine increase muscle mass and reduce body fat in animals. However, little data is available regarding the role of dietary choline and betaine on body composition in humans.
Objective
To investigate the association between dietary choline and betaine intakes with body com-position in a large population based cross-sectional study.
Design
A total of 3214 subjects from the CODING (Complex Disease in Newfoundland population: Environment and Genetics) study were assessed. Dietary choline and betaine intakes were computed from the Willett Food Frequency questionnaire. Body composition was measured using dual-energy X-ray absorptiometry following a 12-hour fast. Major founding factors including age, sex, total calorie intake and physical activity level were con-trolled in all analyses.
Result
Significantly inverse correlations were found between dietary choline and betaine intakes, with all obesity measurements: total percent body fat (%BF), percent trunk fat (%TF), per-cent android fat (%AF), perper-cent gynoid fat (%GF) and anthropometrics: weight, body mass
a11111
OPEN ACCESS
Citation:Gao X, Wang Y, Randell E, Pedram P, Yi Y, Gulliver W, et al. (2016) Higher Dietary Choline and Betaine Intakes Are Associated with Better Body Composition in the Adult Population of
Newfoundland, Canada. PLoS ONE 11(5): e0155403. doi:10.1371/journal.pone.0155403
Editor:Stephen D Ginsberg, Nathan Kline Institute and New York University School of Medicine, UNITED STATES
Received:December 3, 2015
Accepted:April 28, 2016
Published:May 11, 2016
Copyright:© 2016 Gao et al. This is an open access article distributed under the terms of theCreative Commons Attribution License, which permits unrestricted use, distribution, and reproduction in any medium, provided the original author and source are credited.
Data Availability Statement:All relevant data are within the paper and its Supporting Information files.
index, waist circumference, waist-to-hip ratio in both women and men (r range from -0.13 to -0.47 for choline and -0.09 to -0.26 for betaine, p<0.001 for all). Dietary choline intake had stronger association than betaine. Moreover, obese subjects had the lowest dietary choline and betaine intakes, with overweight subjects in the middle, and normal weight subjects consumed the highest dietary choline and betaine (p<0.001). Vice versa, when subjects were ranked according to dietary choline and betaine intakes, subjects with the highest intake of both had the lowest %TF, %AF, %GF, %BF and highest %LM among the groups in both sexes.
Conclusion
Our findings indicate that high dietary choline and betaine intakes are significantly associ-ated with favorable body composition in humans.
Introduction
Obesity is widely recognized as a chronic disease associated with many serious health problems including type 2 diabetes, cardiovascular disease, hypertension and at least a dozen of cancers [1,2]. In the past three decades, the prevalence of obesity and overweight has risen substantially and affects over 600 million people globally [3]. Due to the high prevalence of obesity and its associated health consequences, effective weight reduction and maintenance strategies are needed. Excessive weight gain is influenced by a range of factors including genetic predisposi-tion, improper nutripredisposi-tion, individual behaviour, environmental and social factors [4]. The role of nutrients in diet, especially micronutrients in obesity has been long debated [5–8].
Choline and betaine are quaternary ammonium compounds, which are obtained from diet or by de novo synthesis in tissues. Both of them are found in a wide variety of foods. Among the most concentrated sources of dietary choline are eggs, beef, pork, liver, seafood and milk, whereas betaine is mainly obtained from grains, cereal, beets and spinach [9–13]. Choline is recognized as an essential nutrient and plays an important role in neurotransmitter synthesis, cell-membrane signaling, lipid transport in lipoproteins and methyl-group metabolism by serv-ing as a precursor for acetylcholine, sphserv-ingolipid and phospholipids head groups, and the methyl donor betaine [14,15]. Betaine serves as a compatible osmolyte and a methyl donor in many pathways, including the side-chain methylation of the homocysteine sulfhydryl to form methionine [16]. Growing evidence shows that choline and betaine are involved in the patho-genies of various diseases, including fatty liver [17], cardiovascular diseases [18], metabolic syndrome [19], and various cancers [12].
The beneficial effect of choline and betaine on reducing body fat has been demonstrated in animals, including rats [20], pigs [21,22], chickens [23,24]. Choline and betaine are widely used as dietary additives to promote growth and to improve carcass characteristics (reducing percentage body fat and increasing relative lean mass) in livestock industry [25,26]. However, studies on the effect of dietary choline and betaine intakes on body composition and further-more on the development of obesity in humans are scarce, and the limited results are contra-dictory as well. A cross sectional study in examining Norwegian middle aged and elderly men and women showed that plasma betaine was inversely associated with body mass index (BMI), body fat percentage and waist circumference (WC), while plasma choline had the opposite effect [19]. Similarly, a recent study found that higher serum concentration of betaine rather
design, data collection and analysis, decision to publish, or preparation of the manuscript.
than choline was associated with better profiles of body fat and fat distribution in Chinese adults [27]. Few studies have investigated the effect of betaine supplementation on body weight and body composition in small samples. A study consisting of 23 lean males reported that, 11 of whom received a 2.5 g/day betaine supplementary with simultaneous 6-week progressive resistance training program significantly improved their body composition by both increasing lean mass and reducing fat mass compared with placebo treatment subjects [28]. However, another study in 42 obese subjects with 12 weeks of 6 g/day betaine supplementation did not improve body composition [29]. Similarly, no change of body composition was found in a study involving 34 young males after 10 days of 2 g/day betaine supplementation [30].
To the best of our knowledge, there is no previous study examining the effects of dietary choline and betaine intakes on body composition in a large general population. Therefore, the current cross-sectional study was designed to investigate the association of dietary choline and betaine intakes with body composition in the general Newfoundland population after control-ling for potential confounding factors such as age, sex, total calorie intake and physical activity level.
Materials and Methods
Study population
All participants were from the CODING (Complex Diseases in the Newfoundland population: Environment and Genetics) study [31–35]. Eligibility of participants for the CODING study was based upon the following inclusion criteria: 1)19 years of age; 2) at least a third genera-tion Newfoundlander; and 3) without serious metabolic, cardiovascular, or endocrine diseases. A total of 3214 participants (2295 females and 919 males) were employed. Among them, 160 individuals were excluded for having incomplete data, including: 8 individuals missed weight and height, 38 individuals missed waist and hip circumference, 12 individuals missed the results of body scan, 156 individuals missed the results of Food Frequency Questionnaire (FFQ), and 69 individuals missed physical activity questionnaire. All participants provided written and informed consent and the study received ethics approval from the Health Research Ethics Authority (HREA), Memorial University, St. John’s, Newfoundland, Canada, with Proj-ect Identification Code #10.33 (latest date of approval: 21 January 2015).
Anthropometric and body composition measurements
Anthropometrics, body composition measurements were collected following a 12-hour fast. Trained personnel conducted the anthropometric measurements of each subject using stan-dard procedures. Standing height was measured using a fixed stadiometer (to the nearest 0.1 cm). After urinating to empty their bladders, subjects wore standard hospital gowns for all weight measurements using a platform manual scale balance (Health O Meter, Bridgeview, IL; to the nearest 0.1 kg). BMI (kg/m2) was calculated as weight in kilograms divided by height squared in meters. WC was defined as the midway point between the iliac crest and the lower rib, and hip by the maximum circumference over the buttocks below the iliac crest. Waist-to-hip ratio (WHR) was division of WC by Waist-to-hip circumference.
Medical Systems, Madison, WI) software package was used for DXA data acquisition. Quality assurance was performed on the DXA scanner daily and the typical CV during the study period was 1.3% [33,34].
Lifestyle and dietary assessment
Information regarding lifestyles of participants was collected through a self-administered screening questionnaire. The questions were related to demographics (age and gender), disease status, smoking status, alcohol consumption, and medication use. A separate questionnaire was administered to women with relation to their menopausal status. Physical activity patterns were measured using the ARIC Baecke Questionnaire, which consists of a Work Index, Sports Index, and Leisure Time Activity Index [36].
Dietary intake of each participant was assessed using a 124 item semi-quantitative Willett FFQ [37,38]. The Willett FFQ requires subjects reporting the number of weekly servings con-sumed of common food items over the past 12 months. NutriBase Clinical Nutrition Manager (version 8.2.0; Cybersoft Inc, Phoenix, AZ) software package was used to convert weekly intakes into mean daily intakes of calorie (kcal/day), choline and betaine (mg/day) for each individual [39,40]. Dietary choline and betaine intakes per kilogram body weight (mg/kg/day) were calculated as daily intakes of choline and betaine (mg/day) divided by body weight in kilogram.
Data analysis
All data are presented as mean ± standard deviation (SD). To perform effective statistical anal-ysis, total calorie intake, dietary choline, betaine intakes per person per day, and dietary cho-line, and betaine intakes per kilogram body weight per day were log-transformed to normalize the data distributions. Differences in anthropometrics, body composition measurements and dietary choline and betaine intakes between females and males were assessed with independent Student’sttest.
Statistical interaction between dietary choline, betaine intakes and gender on the main out-comes was tested by analysis of covariance (ANCOVA). Partial correlation analysis controlling for age, total calorie intake, and physical activity level was used to evaluate the correlations of dietary choline, betaine intakes with weight, BMI, WC, WHR, %TF, %AF, %GF, %BF and % LM within female and male groups. To overcome the possible influence of smoking, medica-tion use, drinking and menopausal status, participants were also divided into subgroups according to smoking status (yes or no), medication use (yes or no) and alcohol consumption (yes or no). Women were further divided into pre- or post-menopausal groups according to their menopausal status.
measurements, such as weight, BMI, WC, WHR, %TF, %AF, %GF, %BF and %LM among the three groups of choline or betaine intakes were assessed using ANCOVA controlling for age, total calorie intake and physical activity level.
All statistical analyses were performed using SPSS 20.0 (SPSS Inc., Chicago, IL). All tests were two sided and a p<0.05 was considered to be statistically significant.
Results
Physical parameters and dietary characteristics
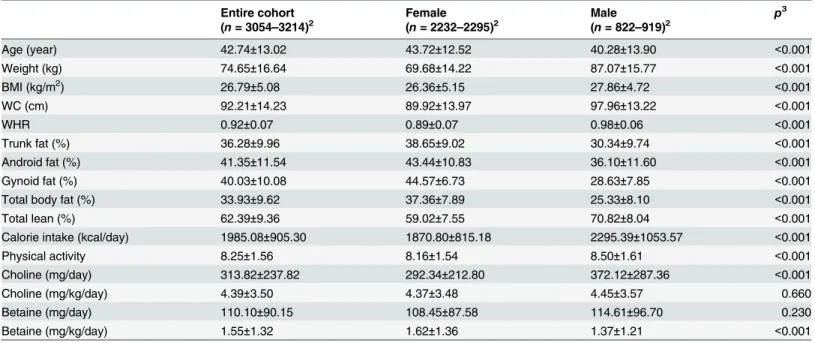
Demographic, physical and dietary characteristics of the entire population and different gender groups are presented inTable 1. Female subjects were on average 3.4 years older than male sub-jects. Weight, BMI, WC, WHR, %LM and physical activity were significantly higher in males than females (p<0.001). %TF, %AF, %GF, and %BF were significantly lower in males as com-pared to females (p<0.001). In terms of dietary intake, male participants consumed signifi-cantly higher daily calorie (kcal/day) and choline intake (mg/day) than females (p<0.001), while there was no significant difference for daily betaine intake (mg/day) between different gender groups. When daily choline and betaine intakes were expressed in per kilogram body weight (mg/kg/day), female participants consumed significantly more betaine than males but there was no significant difference for choline intake.
Correlation between dietary choline, betaine intakes and obesity
measurements
Significant interactions between dietary choline, betaine intakes and gender on weight, BMI, WC, WHR, %TF, %AF, %GF, %BF and LM% were found (p<0.05 for all). The correlations
Table 1. Obesity indexes and dietary choline, betaine intakes by gender1.
Entire cohort Female Male p3
(n= 3054–3214)2 (n= 2232–2295)2 (n= 822–919)2
Age (year) 42.74±13.02 43.72±12.52 40.28±13.90 <0.001
Weight (kg) 74.65±16.64 69.68±14.22 87.07±15.77 <0.001
BMI (kg/m2) 26.79±5.08 26.36±5.15 27.86±4.72 <0.001
WC (cm) 92.21±14.23 89.92±13.97 97.96±13.22 <0.001
WHR 0.92±0.07 0.89±0.07 0.98±0.06 <0.001
Trunk fat (%) 36.28±9.96 38.65±9.02 30.34±9.74 <0.001
Android fat (%) 41.35±11.54 43.44±10.83 36.10±11.60 <0.001
Gynoid fat (%) 40.03±10.08 44.57±6.73 28.63±7.85 <0.001
Total body fat (%) 33.93±9.62 37.36±7.89 25.33±8.10 <0.001
Total lean (%) 62.39±9.36 59.02±7.55 70.82±8.04 <0.001
Calorie intake (kcal/day) 1985.08±905.30 1870.80±815.18 2295.39±1053.57 <0.001
Physical activity 8.25±1.56 8.16±1.54 8.50±1.61 <0.001
Choline (mg/day) 313.82±237.82 292.34±212.80 372.12±287.36 <0.001
Choline (mg/kg/day) 4.39±3.50 4.37±3.48 4.45±3.57 0.660
Betaine (mg/day) 110.10±90.15 108.45±87.58 114.61±96.70 0.230
Betaine (mg/kg/day) 1.55±1.32 1.62±1.36 1.37±1.21 <0.001
1
All values are mean±SDs. BMI, body mass index; WC, waist circumference; WHR, waist-to-hip rate.
2
Sample size range in each study group.
3
Significant differences between female and male groups, based on independence sampleStudent's t-test, Statistical significance was set to p<0.05.
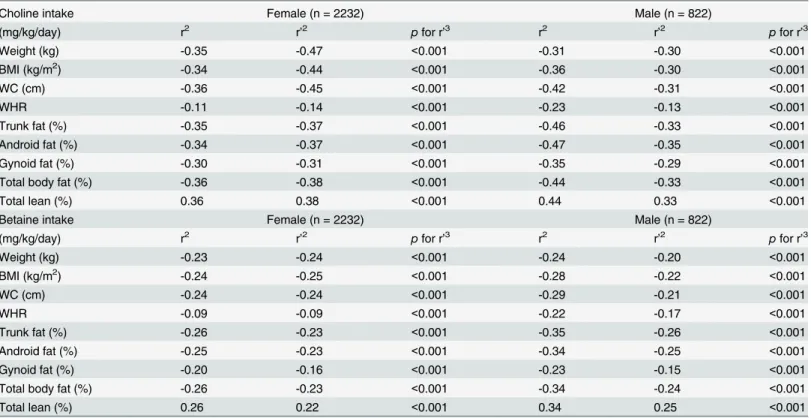
between dietary choline, betaine intakes and weight, BMI, WC, WHR, %TF, %AF, %GF, %BF and %LM in different gender groups are presented inTable 2. In both female and male sub-jects, dietary choline, betaine intakes (mg/kg/day) were negatively correlated with weight, BMI, WC, WHR, %TF, %AF, %GF, %BF and positively correlated with %LM. The correlations remained significant after adjusting for age, total calorie intake, and physical activity level. Die-tary choline intake had the most pronounced correlation with body weight among all measures in females (r = -0.47, p<0.001), while with %AF in males (r = -0.35, p<0.001). However, the association between dietary betaine intake and BMI was the most pronounced in females (r = -0.25, p<0.001), while TF% had the most prominent correlation with dietary betaine intake in males (r = -0.26, p<0.001).
Comparison of dietary choline and betaine intakes among different
adiposity groups
Subjects were divided into three adiposity groups by gender: normal weight, overweight and obese groups according to BMI recommended by WHO and according to %BF by Bray criteria.
According to BMI, as shown inTable 3andS1 Fig, weight, BMI, WC, WHR, %TF, %AF, %GF and %BF were significantly higher, while %LM was significantly lower in obese and over-weight subjects than normal over-weight subjects (p<0.001). Dietary choline and betaine intakes Table 2. Correlations between dietary choline and betaine intakes (mg/kg/day) with body composition1.
Choline intake Female (n = 2232) Male (n = 822)
(mg/kg/day) r2 r
’2 pfor r’3 r2 r
’2 pfor r’3
Weight (kg) -0.35 -0.47 <0.001 -0.31 -0.30 <0.001
BMI (kg/m2) -0.34 -0.44 <0.001 -0.36 -0.30 <0.001
WC (cm) -0.36 -0.45 <0.001 -0.42 -0.31 <0.001
WHR -0.11 -0.14 <0.001 -0.23 -0.13 <0.001
Trunk fat (%) -0.35 -0.37 <0.001 -0.46 -0.33 <0.001
Android fat (%) -0.34 -0.37 <0.001 -0.47 -0.35 <0.001
Gynoid fat (%) -0.30 -0.31 <0.001 -0.35 -0.29 <0.001
Total body fat (%) -0.36 -0.38 <0.001 -0.44 -0.33 <0.001
Total lean (%) 0.36 0.38 <0.001 0.44 0.33 <0.001
Betaine intake Female (n = 2232) Male (n = 822)
(mg/kg/day) r2 r
’2 pfor r’3 r2 r
’2 pfor r’3
Weight (kg) -0.23 -0.24 <0.001 -0.24 -0.20 <0.001
BMI (kg/m2) -0.24 -0.25 <0.001 -0.28 -0.22 <0.001
WC (cm) -0.24 -0.24 <0.001 -0.29 -0.21 <0.001
WHR -0.09 -0.09 <0.001 -0.22 -0.17 <0.001
Trunk fat (%) -0.26 -0.23 <0.001 -0.35 -0.26 <0.001
Android fat (%) -0.25 -0.23 <0.001 -0.34 -0.25 <0.001
Gynoid fat (%) -0.20 -0.16 <0.001 -0.23 -0.15 <0.001
Total body fat (%) -0.26 -0.23 <0.001 -0.34 -0.24 <0.001
Total lean (%) 0.26 0.22 <0.001 0.34 0.25 <0.001
1
Partial correlations between dietary choline, betaine (mg/kg/day) intakes and obesity related indexes were controlling for age, total calorie intake, physical activity level. BMI, body mass index; WC, waist circumference; WHR, waist-to-hip ratio.
2
r: correlation coefficient; r’: partial correlation coefficient.
3
Statistical significance was set to p<0.05.
expressed in mg/kg/day were significantly lower as adiposity status increased. Compared to the normal weight female and male groups, dietary choline intake (mg/kg/day) was significantly lower by 21.4%, 35.8%, 27.6%, and 44.2% in female overweight, female obese, male overweight and male obese groups, respectively. In addition, dietary betaine intake (mg/kg/day) was similarly lower by 22.8%, 36.0%, 21.6%, and 46.6% in female overweight, female obese, male overweight and male obese groups, respectively, compared to normal weight female and male groups. However, there is no significant difference among the three groups when dietary cho-line and betaine intakes were expressed as mg/day.
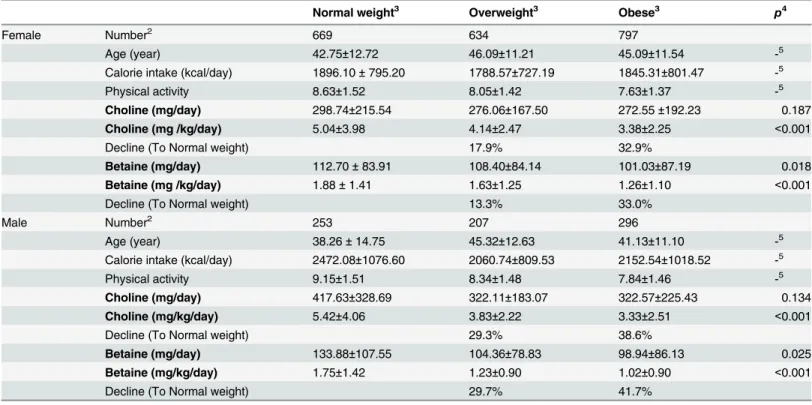
When subjects were divided by %BF, as shown inTable 4andS1 Fig, similar significant rela-tionship was found among these three adiposity groups as seen in BMI groups. Compared to normal weight female and male groups, dietary choline intake (mg/kg/day) was significantly lower by 17.9%, 32.9%, 29.3%, and 38.6% in female overweight, female obese, male overweight and male obese groups, respectively. Correspondingly dietary betaine intake (mg/kg/day) was significantly lower by 13.3%, 33.0%, 29.7%, and 41.7% in female overweight, female obese, male overweight and male obese groups, respectively, compared to normal weight groups. Fur-thermore, betaine intake expressed as mg/day was also significantly lower with the increase of %BF in both female and male subjects (p<0.05) but significant difference was not found for choline.
Table 3. Comparison of body composition and dietary choline, betaine intakes in different obesity status defined by BMI1.
Normal weight3 Overweight3 Obese3 p4
Female Number2 1021 731 447
Age (year) 41.44±13.05 45.39±11.94 46.64±11.02 -5
Calorie intake (kcal/day) 1889.94±790.16 1830.36±753.61 1882.86±914.92 -5
Physical activity 8.51±1.55 8.05±1.44 7.55±1.43 -5
Choline (mg/day) 298.85±221.11 281.24±169.26 289.19±224.96 0.815
Choline (mg/kg/day) 5.05±3.87 3.97±2.46 3.24±2.41 <0.001
Decline (To Normal weight) 21.4% 35.8%
Betaine (mg/day) 112.27±87.19 103.72±84.28 107.34±93.88 0.219
Betaine (mg/kg/day) 1.89±1.50 1.46±1.20 1.21±1.05 <0.001
Decline (To Normal weight) 22.8% 36.0% <0.001
Male Number2 241 357 222
Age (year) 35.71±15.25 42.07±13.53 43.86±11.71 -5
Calorie intake (kcal/day) 2512.09±1056.22 2212.11±920.05 2106.55±1038.91 -5
Physical activity 9.09±1.48 8.44±1.62 8.14±1.62 -5
Choline (mg/day) 422.85±326.87 358.08±267.35 341.49±268.27 0.818
Choline (mg /kg/day) 5.84±4.42 4.23±3.18 3.26±2.47 <0.001
Decline (To Normal weight) 27.6% 44.2%
Betaine (mg/day) 126.48±97.24 117.12±103.36 97.26±82.29 0.135
Betaine (mg/kg/day) 1.76±1.37 1.38±1.32 0.94±0.81 <0.001
Decline (To Normal weight) 21.6% 46.6%
1
All values are mean±SDs. BMI, body mass index; WC, waist circumference; WHR, waist-to-hip rate. 2
Sample size of study group.
3
The following subdivision is used as normal-weight (18.5–24.9 kg/m2), overweight (25.0–29.9 kg/m2), obese class (30.0 kg/m2) according to criteria of the WHO.
4
Significant differences between intervention groups. Data were assessed with ANCOVA controlling for age, total caloric intake, physical activity level. Statistical significance was set to p<0.05.
5
As controlling factor, their differences were not analyzed.
Comparison of body composition in different dietary choline and betaine
intakes groups
Subjects were divided into tertiles (low, medium, or high) according to dietary choline and betaine intakes (mg/kg/day). As shown in Tables5,6andS2 Fig, a significant‘dose-dependent’
declining in weight, BMI, WC, WHR, %TF, %AF, %GF and %BF was found with the increase of dietary choline and betaine intakes in both females and males after controlling for age, total calorie intake, and physical activity. %LM presented a significantly‘dose dependent’increasing trend. Compared to low dietary choline intake group, female subjects of high dietary intake group had significantly lower weight, BMI, WC, WHR (-11.85 kg, -4.24 kg/m2, -11.79 cm, -0.02), and %TF, %AF, %GF, %BF(-7.59%, -8.89%, -4.65%, -6.75%) but higher %LM (6.30%). Male subjects of high dietary choline intake group had significantly lower weight (-11.19 kg), BMI (-3.87 kg/m2), WC (-12.82 cm), WHR (-0.03), %TF (-10.56%), %AF (-12.66%), %GF (-5.94%), %BF (-8.35%), but higher %LM (8.25%) compared with low choline intake group. While, the average differences of obesity measures between high and low dietary betaine intake (mg/kg/day) groups were -7.42 kg (weight), -2.77 kg/m2(BMI), -7.31 cm (WC), -0.02 (WHR), -6.19% (%TF), -6.24% (%AF), -3.13 (%GF), -4.55% (%BF), 4.00% (%LM) in females, and -8.60 kg (weight), -3.01 kg/m2(BMI), -8.81 cm (WC), -0.03 (WHR), -7.77% (%TF), -8.92% (%AF), -4.19% (%GF), -6.19% (%BF), 6.19 (%LM) in males.
Table 4. Composition of body composition and dietary choline, betaine intakes in different obesity status defined by BF%1.
Normal weight3 Overweight3 Obese3 p4
Female Number2 669 634 797
Age (year) 42.75±12.72 46.09±11.21 45.09±11.54 -5
Calorie intake (kcal/day) 1896.10±795.20 1788.57±727.19 1845.31±801.47 -5
Physical activity 8.63±1.52 8.05±1.42 7.63±1.37 -5
Choline (mg/day) 298.74±215.54 276.06±167.50 272.55±192.23 0.187
Choline (mg /kg/day) 5.04±3.98 4.14±2.47 3.38±2.25 <0.001
Decline (To Normal weight) 17.9% 32.9%
Betaine (mg/day) 112.70±83.91 108.40±84.14 101.03±87.19 0.018
Betaine (mg /kg/day) 1.88±1.41 1.63±1.25 1.26±1.10 <0.001
Decline (To Normal weight) 13.3% 33.0%
Male Number2 253 207 296
Age (year) 38.26±14.75 45.32±12.63 41.13±11.10 -5
Calorie intake (kcal/day) 2472.08±1076.60 2060.74±809.53 2152.54±1018.52 -5
Physical activity 9.15±1.51 8.34±1.48 7.84±1.46 -5
Choline (mg/day) 417.63±328.69 322.11±183.07 322.57±225.43 0.134
Choline (mg/kg/day) 5.42±4.06 3.83±2.22 3.33±2.51 <0.001
Decline (To Normal weight) 29.3% 38.6%
Betaine (mg/day) 133.88±107.55 104.36±78.83 98.94±86.13 0.025
Betaine (mg/kg/day) 1.75±1.42 1.23±0.90 1.02±0.90 <0.001
Decline (To Normal weight) 29.7% 41.7%
1
All values are mean±SDs. BMI, body mass index; WC, waist circumference; WHR, waist-to-hip rate. 2
Sample size of study group.
3
Subgroups were created by percent of body fat according to the age and gender specific criteria recommended by Bray.
4
Significant differences between intervention groups. Data were assessed with ANCOVA controlling for age, total calorie intake and physical activity level. Statistical significance was set to p<0.05.
5
As controlling factor, their differences were not analyzed.
Discussion
To the best of our knowledge, this is the first large cross-sectional study specifically designed to investigate the association between dietary choline, betaine intakes and DXA-derived body composition. We found significant associations of higher dietary choline and betaine intakes
Table 5. Comparison of obesity indexes according to dietary choline (mg/kg/day) intake1.
Choline (mg/kg/day) Low2 Medium2 High2 p3
Female Number 744 744 744
Age (year) 44.56±11.48 44.37±11.95 42.16±13.77 -4
Weight (kg) 75.95±16.39 68.93±12.30 64.10±10.58 <0.001
BMI (kg/m2) 28.59±5.74 26.15±4.67 24.35±4.02 <0.001
WC (cm) 96.03±15.02 89.49±12.80 84.24±11.31 <0.001
WHR 0.90±0.07 0.89±0.07 0.88±0.06 <0.001
Trunk fat (%) 42.31±7.94 38.89±8.32 34.72±9.10 <0.001
Android fat (%) 47.72±9.38 43.79±10.00 38.83±11.14 <0.001
Gynoid fat (%) 46.67±6.37 45.01±6.30 42.02±6.69 <0.001
Total body fat (%) 40.59±7.08 37.61±7.17 33.84±7.87 <0.001
Total lean (%) 56.00±6.72 58.76±6.89 62.30±7.66 <0.001
Calorie intake (kcal/day) 1346.45±476.78 1826.96±538.96 2435.87±935.54 -4
Physical activity 7.77±1.46 8.07±1.46 8.64±1.56 -4
Choline (mg/day) 162.82±50.16 251.21±50.02 463.21±288.89 <0.001
Choline (mg/kg/day) 2.17±0.55 3.66±0.44 7.30±4.69 <0.001
(0.36~2.94) (2.95~4.51) (4.52~51.27)
Betaine (mg/day) 68.70±59.41 107.95±75.97 148.46±102.77 <0.001
Betaine (mg/kg/day) 0.92±0.75 1.579±1.06 2.35±1.67 <0.001
Male Number 274 274 274
Age (year) 45.11±12.61 41.66±12.90 34.81±14.42 -4
Weight (kg) 92.07±16.42 86.87±14.56 80.88±13.30 <0.001
BMI (kg/m2) 29.66±4.89 27.71±4.28 25.79±3.73 <0.001
WC (cm) 103.49±12.50 97.84±11.65 90.67±11.53 <0.001
WHR 0.99±0.05 0.98±0.05 0.96±0.06 0.002
Trunk fat (%) 34.99±7.34 30.80±8.14 24.43±10.31 <0.001
Android fat (%) 41.81±8.60 36.38±9.64 29.15±12.60 <0.001
Gynoid fat (%) 31.32±7.14 28.48±6.73 25.38±8.35 <0.001
Total body fat (%) 29.07±6.67 25.38±6.72 20.72±8.30 <0.001
Total lean (%) 67.11±7.20 70.74±6.43 75.36±8.12 <0.001
Calorie intake (kcal/day) 1606.82±553.64 2170.41±616.33 3117.72±1.22 -4
Physical activity 7.90±1.50 8.54±1.44 9.20±1.68 -4
Choline (mg/day) 185.84±54.77 308.54±64.53 622.54±374.07 <0.001
Choline (mg/kg/day) 2.04±0.53 3.56±0.48 7.73±4.51 <0.001
(0.51~2.77) (2.77~4.49) (4.49~35.90)
Betaine (mg/day) 73.98±63.15 110.24±73.23 160.29±122.86 <0.001
Betaine (mg/kg/day) 0.82±0.72 1.29±0.87 2.01±1.56 <0.001
1
All values are mean±SDs. BMI, body mass index; WC, waist circumference; WHR, waist-to-hip ratio. 2
The subjects were divided to low, medium and high choline intake groups based on mg/kg/day.
3
Significant differences between intervention groups. Data were assessed with ANCOVA controlling for age, total caloric intake, physical activity level. Statistical significance was set to p<0.05.
4
As controlling factor, their differences were not analyzed.
with better body composition profile (lower %BF, higher %LM). Furthermore, the inverse cor-relation of dietary choline intake with obesity measures was stronger than that of betaine.
Association study is relatively easy to do but hard to do well, especially in large population based study. The first challenge is the accurate measurement of physiological and biological
Table 6. Comparison of obesity indexes according to dietary betaine (mg/kg/day) intake1.
Betaine (mg/kg/day) Low2 Medium2 High2 p3
Female Number 744 744 744
Age (year) 44.10±11.75 43.36±12.60 43.61±13.04 -4
Weight (kg) 73.78±15.76 68.72±13.29 66.36±11.92 <0.001
BMI (kg/m2) 27.91±5.56 25.97±4.88 25.14±4.53 <0.001
WC (cm) 94.08±14.86 88.78±13.28 86.77±12.52 <0.001
WHR 0.90±0.07 0.89±0.07 0.88±0.06 0.004
Trunk fat (%) 41.47±8.16 38.14±8.84 36.28±9.24 <0.001
Android fat (%) 46.90±9.59 42.72±10.70 40.66±11.14 <0.001
Gynoid fat (%) 46.28±6.25 44.24±6.62 43.15±6.92 <0.001
Total body fat (%) 39.83±7.21 36.91±7.67 35.28±8.06 <0.001
Total lean (%) 56.80±6.79 59.42±7.29 60.80±7.66 <0.001
Calorie intake (kcal/day) 1558.28±714.21 1871.16±815.45 2189.17±789.94 -4
Physical activity 7.85±1.54 8.17±1.47 8.67±l.53 -4
Choline (mg/d) 230.22±177.08 294.10±221.97 353.87±218.41 <0.001
Choline (mg/kg/day) 3.27±2.99 4.38±3.32 5.49±3.73 <0.001
Betaine (mg/d) 37.13±18.49 86.93±23.64 201.37±89.07 <0.001
Betaine (mg/kg/day) 0.51±0.23 1.27±0.25 3.08±1.39 <0.001
(0.03~0.88) (0.89~1.77) (1.78~12.73).
Male Number 274 274 274
Age (year) 43.15±13.40 39.47±13.76 39.02±14.49 -4
Weight (kg) 90.95±17.09 86.61±14.34 82.35±13.71 <0.001
BMI (kg/m2) 29.19±4.89 27.82±4.36 26.18±4.05 <0.001
WC (cm) 101.54±13.45 97.78±11.71 92.73±12.32 <0.001
WHR 0.99±0.06 0.98±0.05 0.96±0.06 <0.001
Trunk fat (%) 33.51±8.82 31.08±8.11 25.74±10.40 <0.001
Android fat (%) 39.69±10.28 36.98±9,81 30.77±12.76 <0.001
Gynoid fat (%) 29.98±7.58 29.48±6.79 25.79±8.32 <0.001
Total body fat (%) 27.79±7.72 25.86±6.78 21.60±8.32 <0.001
Total lean (%) 68.30±8.15 70.36±6.50 74.49±8.06 <0.001
Calorie intake (kcal/day) 1867.65±860.72 2242.66±925.86 2724.76±1.03 -4
Physical activity 8.17±1.61 8.39±1.54 9.05±1.60 -4
Choline (mg/day) 282.73±218.72 352.91±234.20 466.45±324.37 <0.001
Choline (mg/kg/day) 3.19±2.45 4.15±2.79 5.77±4.10 <0.001
Betaine (mg/day) 38.74±19.13 88.10±20.28 217.06±101.67 <0.001
Betaine (mg/kg/day) 0.43±0.19 1.02±0.19 2.67±1.28 <0.001
(0.03~0.73) (0.74~1.43) (1.44~10.99)
1
All values are mean±SDs. BMI, body mass index; WC, waist circumference; WHR, waist-to-hip ratio. 2
The subjects were divided to low, medium and high choline intake groups based on mg/kg/day.
3
Significant differences between intervention groups. Data were assessed with ANCOVA controlling for age, total caloric intake, physical activity level. Statistical significance was set to p<0.05.
4
As controlling factor, their differences were not analyzed.
markers because sophisticated equipment is required, and long period of time is needed to recruit large number of subjects. In the present study, body composition in all subjects was measured using the same DXA system by certified technicians over 12 years. DXA produces accurate measurement of adipose tissue in the body with a low margin of error and is consid-ered to be one of the most reliable measurements of adiposity [33]. The second challenge lies in the identification and measurements of numerous confounding factors that can potentially affect the relationship of the major factors under investigation. In most studies, unfortunately, information on these confounding factors is largely unavailable [43,44]. There is no doubt that age is a primary important factor that affects the development of obesity [45]. Total dietary cal-orie intake is a critical factor in maintaining energy balance [46]. In addition, physical activity level is likely the most important non-dietary factor that can influence energy consumed, amount of choline and betaine intakes and ultimately body composition [46,47]. In the present study, all of these confounding factors have been properly adjusted. The beneficial effect of die-tary choline and betaine intakes on obesity was demonstrated in every obesity measurement in both women and men independent of these factors. Other confounding factors, menopause, smoking, medication and alcohol consumption were taken into consideration as well. Meno-pause is an important factor related to changes in body composition as menoMeno-pause is usually accompanied by dramatic changes in sex hormones that can predispose women to weight gain [48]. We found that the associations between dietary choline, betaine intakes and body compo-sition are equally profound in both pre- and post-menopausal women (S1 Table). Smoking sta-tus, medication use and alcohol consumption are potentially important covariates known to affect appetite and body weight regulation [49–51]. After separating subjects according to these covariates, the beneficial association remained significant (S2–S4Tables).
suggesting that relationship between dietary choline and betaine with obesity might differ from that with serum levels.
To date, a few small interventional studies have examined the effect of betaine supplementa-tion on body fat but no study is available on the effect of choline supplementasupplementa-tion in humans. A significant decrease in fat mass and percent body fat was observed among 11 male partici-pants received a periodical training program [28]. However, the positive effect may have been due to the greater physical activity levels of participants. Two other studies failed to replicate the results [29,30]. Animal studies have provided the main evidence of the beneficial effect of dietary choline and betaine on body fat and muscle. Choline or betaine supplementation on the growth performance and carcass characteristics of gilts, other pigs, meat ducks, chickens and mice were well examined [20–26]. These studies have generally indicated that choline and betaine supplementation can promote growth and reduce fat deposition in various animals. Our findings have filled the knowledge gap of the relationship between dietary choline, betaine intakes and body composition in humans. The effect of dietary choline might be more com-plex. Jacobset alfound that a choline-deficient diet decreased fat mass in mice with high fat diet or genetic defect induced obesity [54,55]. Another study showed that high fat feeding led to weight gain in choline-replete mice, whereas choline deficiency did not affect body or adi-pose depot weights [56]. However, these animal experiments were performed under extreme condition: choline depletion which virtually does not exist in general human population.
The exact mechanisms by which choline and betaine improve body composition are unclear, while several mechanisms have been suggested. It has been postulated that choline and betaine supplementation could promote fatty acidβ-oxidation in pigs and humans by enhanc-ing muscle carnitine accretion and thereby increase carnitine palmitoyl transferase I-mediated free fat acid translocation into the mitochondria [57–61]. Choline can also be metabolized to betaine and plays a role in altering body composition. The betaine-related methylation of homocysteine to methionine may reduce the availability of substrate (acetyl-coenzyme A) for fatty acid synthesis [60]. Betaine supplementation could decrease the capacity for fatty acid and triglyceride synthesis by decreasing the activity of acetyl-CoA carboxylase, fatty acid synthase and malic enzyme and their mRNA expression in abdominal adipose tissue [61,62]. Betaine may also reduce uptake of triglycerides from circulating lipoproteins by decreasing the mRNA expression of lipoprotein lipase [62]. Dietary betaine in pigs mobilized fat degradation in adipose tissue by increasing hormone sensitive lipase activity [63]. Betaine supplementation may promote protein synthesis by stimulating growth hormone secretion and improving insu-lin and IGF-1 receptor signainsu-ling [64–66]. Accumulation of betaine in cells resulting in increased sarcoplasmic osmolality may also contribute to the increase in muscle mass [67,68].
when consuming choline or betaine-rich foods and unknown or poorly measured factors could not be completely ruled out.
Conclusions
In conclusion, the present study provides solid evidence for the first time, in the large New-foundland population, that higher dietary choline and betaine intakes were associated with a more favorable body composition (lower body fat and higher lean body mass) in both women and men. In addition, this favorable association was independent of age, gender, total calorie intake, physical activity level, menopausal status, smoking status, medication use, and alcohol consumption. The beneficial correlation for choline seems better than betaine.
Supporting Information
S1 Fig. Variations of dietary choline, betaine intakes (mg/kg/day) in different obesity sta-tus.A. variations of dietary choline intake (mg/kg/day) in different obesity status grouped based on BMI criteria; B. variations of dietary betaine intake (mg/kg/day) in different obesity status grouped based on BMI criteria; C. variations of dietary choline intake (mg/kg/day) in different obesity status grouped based on %BF recommended by Bray; D. variations of dietary betaine intake (mg/kg/day) in different obesity status grouped based on %BF recommended by Bray;p<0.01 compared with normal weight group, ##p<0.01 compared with overweight
group. (TIF)
S2 Fig. Variations of total percent body fat and lean mass among subjects with low, medium and high dietary choline and betaine intakes (mg/kg/day).A. variations of total body fat according to dietary choline intake; B. variations of total lean mass according to die-tary choline intake; C. variations of total body fat according to diedie-tary betaine intake; D. varia-tions of total lean mass according to dietary betaine intake.
p<0.01 compared with low dietary choline or betaine intakes; ##p<0.01 compared with medium dietary choline or beta-ine intakes.
(TIF)
S1 Table. Partial correlations between dietary choline, betaine intakes (mg/kg/day) and body composition variables in females based on menopausal status.
(DOC)
S2 Table. Partial correlations between dietary choline, betaine intakes (mg/kg/day) and body composition variables for Newfoundland population based on medication use.
(DOC)
S3 Table. Partial correlations between dietary choline, betaine intakes (mg/kg/day) and body composition variables for Newfoundland population based on smoking status.
(DOC)
S4 Table. Partial correlations between dietary choline, betaine intakes (mg/kg/day) and body composition variables for Newfoundland population based on alcohol status.
(DOC)
S5 Table. Correlations between dietary choline and betaine intakes (mg/day) with body composition.
Acknowledgments
We would like to thank all of the volunteers who participated in this present study. We also wish to thank Hongwei Zhang and our research collaborators.
Author Contributions
Conceived and designed the experiments: GS XG. Performed the experiments: XG. Analyzed the data: XG. Contributed reagents/materials/analysis tools: XG YW YY. Wrote the paper: XG YW ER PP WG GS.
References
1. Calle EE, Kaaks R. Overweight, obesity and cancer: epidemiological evidence and proposed mecha-nisms. Nat Rev Cancer. 2004; 4: 579–591. PMID:15286738
2. Kopelman PG. Obesity as a medical problem. Nature. 2000; 404: 635–643. PMID:10766250
3. Ng M, Fleming T, Robinson M, Thomson B, Graetz N, Margono C, et al. Global, regional, and national prevalence of overweight and obesity in children and adults during 1980–2013: a systematic analysis for the Global Burden of Disease Study 2013. The Lancet. 2014; 384: 766–781.
4. Morris MJ, Beilharz JE, Maniam J, Reichelt AC, Westbrook RF. Why is obesity such a problem in the 21st century? The intersection of palatable food, cues and reward pathways, stress, and cognition. Neurosci Biobehav Rev. 2014 Dec 10. doi:10.1016/j.neubiorev.2014.12.002
5. Schoeller DA, Buchholz AC. Energetics of obesity and weight control: does diet composition matter? J Am Diet Assoc. 2005; 105: S24–28. PMID:15867892
6. Hu FB. Diet, nutrition, and obesity. Obesity Epidemiology. Oxford University Press: New York 2008: 275–300.
7. García OP, Long KZ, Rosado JL. Impact of micronutrient deficiencies on obesity. Nutr Rev. 2009; 67: 559–572. doi:10.1111/j.1753-4887.2009.00228.xPMID:19785688
8. García OP, Ronquillo D, del Carmen Caamaño M, Martínez G, Camacho M, López V, et al. Zinc, iron and vitamins A, C and E are associated with obesity, inflammation, lipid profile and insulin resistance in Mexican school-aged children. Nutrients. 2013; 5: 5012–5030. doi:10.3390/nu5125012PMID: 24335710
9. Nagata C, Wada K, Tamura T, Konishi K, Kawachi T, Tsuji M, et al. Choline and Betaine Intakes Are Not Associated with Cardiovascular Disease Mortality Risk in Japanese Men and Women. The Journal of nutrition. 2015; 145: 1787–1792. doi:10.3945/jn.114.209296PMID:26063062
10. Vennemann FBC, Ioannidou S, Valsta LM, Dumas C, Marga C, Mensink GBM, et al. Dietary intake and food sources of choline in European populations. Brit J Nutr. 2015; 114: 2046–2055. doi:10.1017/ S0007114515003700PMID:26423357
11. Wallace T C, Fulgoni V L III. Assessment of Total Choline Intakes in the United States. J Am Coll Nutr. 2016; 35: 108–112. doi:10.1080/07315724.2015.1080127PMID:26886842
12. Ueland PM. Choline and betaine in health and disease. J Inherit Metab Dis. 2011; 34: 3–15. doi:10. 1007/s10545-010-9088-4PMID:20446114
13. Zeisel SH, Da Costa KA. Choline: an essential nutrient for public health. Nutrition reviews 2009; 67:615–623. doi:10.1111/j.1753-4887.2009.00246.xPMID:19906248
14. Penry J, Manore M. Choline: an important micronutirent for maximal endurance-exercise performance? Int J Sport Nutr Exerc Metab. 2008; 18: 191–203. PMID:18458362
15. Leermakers ETM, Moreira EM, Kiefte-de Jong JC, et al. Effects of choline on health across the life course: a systematic review. Nutr Rev. 2015; 73: 500–522. doi:10.1093/nutrit/nuv010PMID:26108618
16. Craig SA. Betaine in human nutrition. Am J Clin Nutr 2004; 80:539–549. PMID:15321791
17. Buchman AL, Dubin MD, Moukarzel AA, Jenden DJ, Roch M, Rice KM, et al. Choline deficiency: a cause of hepatic steatosis during parenteral nutrition that can be reversed with intravenous choline sup-plementation. Hepatology. 1995; 22: 1399–1403. PMID:7590654
18. Rajaie S, Esmaillzadeh A. Dietary choline and betaine intakes and risk of cardiovascular diseases: review of epidemiological evidence. ARYA atherosclerosis. 2011; 7: 78. PMID:22577451
20. Hongu N, Sachan DS. Caffeine, carnitine and choline supplementation of rats decreases body fat and serum leptin concentration as does exercise. J Nutr. 2000; 130: 152–157. PMID:10720162
21. Siljander-Rasi H, Peuranen S, Tiihonen K. Effect of equimolar dietary betaine and choline addition on performance, carcass quality and physiological parameters of pigs. J Anim Sci, 2003; 76: 55–62.
22. Daily JW, Hongu N, Mynatt RL, Sachan DS. Choline supplementation increases tissue concentrations of carnitine and lowers body fat in guinea pigs. J Nutr Biochem 1998; 9: 464–70.
23. Saunderson CL, Mackinlay J. Changes in body-weight, composition and hepatic enzyme activities in response to dietary methionine, betaine and choline levels in growing chicks. Br J Nutr. 1990; 63: 339– 49. PMID:1692235
24. Hassan RA, Attia YA, El-Ganzory EH. Growth, carcass quality and serum constituents of slow growing chicks as affected by betaine addition to diets containing 1. Different levels of choline. Int. J. Poult. Sci. 2005; 4: 840–850.
25. Pollmann DS, Danielson DM, Peo ER. Effects of microbial feed additives on performance of starter and growing-finishing pigs. J Anim Sci. 1980; 51: 577–581.
26. Lever M, Slow S. The clinical significance of betaine, an osmolyte with a key role in methyl group metabolism. Clin Biochem. 2010; 43:732–744. doi:10.1016/j.clinbiochem.2010.03.009PMID: 20346934
27. Chen YM, Liu Y, Liu YH, Wang X, Guan K, Zhu HI. Higher serum concentrations of betaine rather than choline is associated with better profiles of DXA-derived body fat and fat distribution in Chinese adults. Int J Obes. 2015; 39: 465–471.
28. Cholewa JM, Wyszczelska-Rokiel M, Glowacki R, Jakubowski H, Matthews T, Wood R, et al. Effects of betaine on body composition, performance, and homocysteine thiolactone. J Int Soc Sports Nutr. 2013; 10: 39. doi:10.1186/1550-2783-10-39PMID:23967897
29. Schwab U, Torronen A, Toppinen L, Alfthan G, Saarinen M, Aro A, et al. Betaine supplementation decreases plasma homocysteine concentrations but does not affect body weight, body composition, or resting energy expenditure in human subjects. Am J Clin Nutr. 2002; 76: 961–967. PMID:12399266
30. Favero S, Roschel H, Artioli G, Ugrinowitsch C, Tricoli V, Costa A, et al. Creatine but not betaine sup-plementation increases muscle phosphorylcreatine content and strength performance. Amino Acids. 2012; 42: 2299–2305. doi:10.1007/s00726-011-0972-5PMID:21744011
31. Sun G, French CR, Martin GR, Younghusband B, Green RC, Xie YG, et al. Comparison of multifre-quency bioelectrical impedance analysis with dual-energy X-ray absorptiometry for assessment of per-centage body fat in a large, healthy population. Am J Clin Nutr. 2005; 81:74–78. PMID:15640463
32. Sun G, Vasdev S, Martin G, Gadag V, Zhang HW. Altered calcium homeostasis is correlated with abnormalities of fasting serum glucose, insulin resistance andβ-cell function in the Newfoundland pop-ulation. Diabetes. 2005; 54: 3336–3339. PMID:16249463
33. Kennedy AP, Shea JL, Sun G. Comparison of the classification of obesity by BMI vs. dual-energy X-ray absorptiometry in the newfoundland population. Obesity. 2009; 17: 2094–2099. doi:10.1038/oby.2009. 101PMID:19360011
34. Shea JL, King MT, Yi Y, Gulliver W, Sun G. Body fat percentage is associated with cardiometabolic dys-regulation in BMI-defined normal weight subjects. Nutr Metab Cardiovasc Dis. 2012; 22:741–747. doi: 10.1016/j.numecd.2010.11.009PMID:21215604
35. Fontaine-Bisson B, Thorburn J, Gregory A, Zhang H and Sun G. Melanin-concentrating hormone receptor 1 polymorphisms are associated with components of energy balance in the Newfoundland CODING study. Am J Clin Nutr. 2014; 99:384–391. doi:10.3945/ajcn.113.073387PMID:24305679
36. Baecke JA, Burema J, Frijters JE. A short questionnaire for the measurement of habitual physical activ-ity in epidemiological studies. Am J Clin Nutr. 1982; 36:936–942. PMID:7137077
37. Willett WC, Sampson L, Stampfer MJ, Rosner B, Bain C, Witschi J, Hennekens CH, Speizer FE. Repro-ducibility and validity of a semiquantitative food frequency questionnaire. Am J Epidemiol. 1985; 122: 51–65. PMID:4014201
38. Subar AF, Thompson FE, Kipnis V, Midthune D, Hurwitz P, McNutt S, et al. Comparative validation of the Block, Willett, and National Cancer Institute food frequency questionnaires: the Eating at America’s Table Study. Am J Epidemiol. 2001; 154:1089–1099. PMID:11744511
39. Cahill F, Shahidi M, Shea J, Wadden D, Gulliver W, Randell E, et al. High Dietary magnesium intake is associated with low insulin resistance in the Newfoundland population. PLoS One. 2013, 8:e58278. doi:10.1371/journal.pone.0058278PMID:23472169
40. Pedram P, Sun G. Hormonal and Dietary Characteristics in Obese Human Subjects with and without Food Addiction. Nutrients. 2014; 7: 223–238. doi:10.3390/nu7010223PMID:25558907
42. Bray GA. Contemporary Diagnosis and Management of Obesity and the Metabolic Syndrome. 3rd edn. Handbooks in Health Care: Newtown, PA, 2003.
43. Pocock SJ, Collier TJ, Dandreo KJ, Stavola BL, Goldman MB, Kalish LA, Kasten LE, McCormack VA. Issues in the reporting of epidemiological studies: a survey of recent practice. BmJ, 2004; 329: 883. PMID:15469946
44. Mann CJ. Observational research methods. Research design II: cohort, cross sectional, and case-con-trol studies. Emergency Medicine Journal. 2003; 20: 54–60. PMID:12533370
45. Jackson AS, Stanforth PR, Gagnon J, Rankinen T, Leon AS, Rao DC, et al. The effect of sex, age and race on estimating percentage body fat from body mass index: The Heritage Family Study. International journal of obesity and related metabolic disorders: journal of the International Association for the Study of Obesity. 2002; 26: 789–96.
46. Klesges RC, Klesges LM, Haddock CK, Eck LH. A longitudinal analysis of the impact of dietary intake and physical activity on weight change in adults. Am J Clin Nutr. 1992; 55: 818–822. PMID:1550064
47. Westerterp KR, Goran MI. Relationship between physical activity related energy expenditure and body composition: a gender difference. International journal of obesity 1997; 21:184–188. PMID:9080256
48. Lovejoy JC. The influence of sex hormones on obesity across the female life span. J Womens Health. 1998; 7:1247–1256. PMID:9929857
49. Slattery ML, McDonald A, Bild DE, Caan BJ, Hilner JE, Jacobs DR, et al. Associations of body fat and its distribution with dietary intake, physical activity, alcohol, and smoking in blacks and whites. Am J Clin Nut. 1992; 55: 943–949.
50. Cheskin LJ, Bartlett SJ, Zayas R, Twilley CH, Allison DB, Contoreggi C. Prescription medications: a modifiable contributor to obesity. South Med J. 1999; 92: 898–904. PMID:10498166
51. Suter PM, Tremblay A. Is alcohol consumption a risk factor for weight gain and obesity?. Crit Rev Clin Lab Sci. 2005; 42:197–227. PMID:16047538
52. Hamlin JC, Pauly M, Melnyk S, Pavliv O, Starrett W, Crook TA, et al. Dietary intake and plasma levels of choline and betaine in children with autism spectrum disorders. Autism research and treatment 2013. doi:10.1155/2013/578429
53. Food and Nutrition Board, Institute of Medicine. Dietary Reference Intakes: Thiamin, Riboflavin, Niacin, Vitamin B-6,Vitamin B-12, Pantothenic Acid, Biotin, and Choline. National Academy of Sciences. Washington, DC: Food and Nutrition Board, Institute of Medicine National Academic Press; 1998:390– 422.
54. Wu G, Zhang L, Li T, Lopaschuk G, Vance DE, Jacobs RL. Choline deficiency attenuates body weight gain and improves glucose tolerance in ob/ob mice. Journal of obesity, 2012. doi:10.1155/2012/ 319172
55. Jacobs RL, Zhao Y, Koonen DPY, Sletten T, Su B, Lingrell S, et al. Impaired de novo choline synthesis explains why phosphatidylethanolamine N-methyltransferase-deficient mice are protected from diet-induced obesity. J Biol Chem. 2010; 285:22403–22413. doi:10.1074/jbc.M110.108514PMID: 20452975
56. Raubenheimer PJ, Nyirenda MJ, Walker BR. A choline-deficient diet exacerbates fatty liver but attenu-ates insulin resistance and glucose intolerance in mice fed a high-fat diet. Diabetes. 2006; 55:2015– 2020. PMID:16804070
57. Feng J, Xu ZR. Effect of betaine on muscle, liver and serum amino acid composition in finishing swine. J Zhejiang UnivAgric Life Sci. 2001; 27:107–110.
58. Harmeyer J. The physiological role of L-carnitine. Lohman Information. 2002; 27:15–21.
59. Daily JW, Sachan DS. Choline supplementation alters carnitine homeostasis in humans and guinea pigs. J. Nutr. 1995; 125:1938–1944. PMID:7616311
60. Lawrence BV, Schinckel AP, Adeola O, Cera K. Impact of betaine on pig finishing performance and car-cass composition. J Anim Sci. 2002; 80: 475–482. PMID:11881932
61. Huang QC, Xu ZR, Han XY, Li WF. Effect of dietary betaine supplementation on lipogenic enzyme activities and fatty acid synthase mRNA expression in finishing pigs. Anim Feed Sci Technol. 2008; 140:365–375.
62. Xing J, Kang L, Jiang Y. Effect of dietary betaine supplementation on lipogenesis gene expression and CpG methylation of lipoprotein lipase gene in broilers. Mol Biol Rep. 2011; 38:1975–1981. doi:10. 1007/s11033-010-0319-4PMID:20845073
63. Huang QC, Xu ZR, Han XY, Li WF. Changes in hormones, growth factor and lipid metabolism infinish-ing pigs fed betaine. Livest Sci. 2006; 105:78–85.
(GSK-3) and p70 S6K phosphorylation. Journal of molecular endocrinology. 2005; 34:119–126. PMID: 15691882
65. Huang QC, Xu ZR, Han XY, Li WF. Effect of betaine on growth hormone pulsatile secretion and serum metabolites in finishing pigs. J Anim Physiol An N. 2007; 91: 85–90.
66. Apicella JM, Lee EC, Bailey BL, Saenz C, Anderson JM, Craig SAS, et al. Betaine supplementation enhances anabolic endocrine and Akt signaling in response to acute bouts of exercise. Eur J Appl Phy-siol. 2013; 113: 793–802. doi:10.1007/s00421-012-2492-8PMID:22976217
67. Slow S, Lever M, Chambers ST, GEORGE PM. Plasma dependent and independent accumulation of betaine in male and female rat tissues. Physiol Res. 2009; 58:403. PMID:18637704
68. Stoll B, Gerok W, Lang F, Häussinger D. Liver cell volume and protein synthesis. Biochem J. 1992; 287:217–222. PMID:1329728
69. Fontaine-Bisson B, Wolever TM, Connelly PW, Corey PN, El-Sohemy A. NF-kappaB—94Ins/Del ATTG polymorphism modifies the association between dietary polyunsaturated fatty acids and HDL-cholesterol in two distinct populations. Atherosclerosis. 2009; 204: 465–470. doi:10.1016/j. atherosclerosis.2008.10.037PMID:19070859
70. Paradis AM, Godin G, Lemieux S, Pérusse L, Vohl MC. Eating behaviours of non-obese individuals with and without familial history of obesity. Br J Nutr. 2009; 101:1103–1109. doi:10.1017/
S0007114508055645PMID:18782460
71. Eny KM, Wolever TM, Fontaine-Bisson B, El-Sohemy A. Genetic variant in the glucose transporter type 2 is associated with higher intakes of sugars in two distinct populations. Physiol Genomics. 2008; 33:355–360. doi:10.1152/physiolgenomics.00148.2007PMID:18349384