Effects of supplementary choline on quail meat and fatty liver
Süleyman Ercüment Önel1*, Şana Sungur2, Mikail Baylan3 1 Mustafa Kemal University, Samandağ Vocational School, Department of Plant and Animal Production, Hatay, Turkey. 2 Mustafa Kemal University, Science and Letters Faculty, Department of Chemistry, Hatay, Turkey.
3 Çukurova University, Faculty of Agriculture, Department of Animal Science, Adana, Turkey.
ABSTRACT - The objective of this study was to investigate the effects of supplementary choline on amount of choline passing to quail meat and reduction of fat deposition in liver. A hundred and thirty-six one-day-old Japanese quails were divided into eight equal groups of 17 quails each. The experiment was designed based on completely randomized design in two controls and six treatment groups: high stocking density, basal diet, control group (HSD; control 1); normal stocking density, basal diet, control group (NSD; control 2); HSD, basal diet + 900 mg kg−1 choline (A); NSD, basal diet + 900 mg kg−1 choline (B); HSD,
basal diet + 1800 mg kg−1 choline (C); NSD, basal diet + 1800 mg kg−1 choline (D); HSD, basal diet + 3600 mg kg−1 choline (E);
and NSD, basal diet + 3600 mg kg−1 choline (F).Feeds and water were supplied ad libitum. Continuous light was provided.
Quails were kept in cages of 50 × 100 cm in size. The choline content of quail meat increased with increasing amount of added choline to feed. The highest choline content (439.2 and 561.2 mg kg−1) in quail meat was detected in E and F groups which fed
the 3600 mg kg−1 choline supplemented diet. The total lipid content of liver in E and F groups was reduced by 42% compared
with the control groups. We recommend the use of supplementary choline that can improve the amount of choline passing to quail meat and reduction of fat deposition in liver.
Key Words: choline, Japanese quail, UV-Vis spectrophotometer © 2017 Sociedade Brasileira de Zootecnia
ISSN 1806-9290 www.sbz.org.br
R. Bras. Zootec., 46(8):645-651, 2017
Received: March 22, 2017 Accepted: June 7, 2017
*Corresponding author: [email protected] http://dx.doi.org/10.1590/S1806-92902017000800003
How to cite: Önel, S. E.; Sungur, Ş. and Baylan, M. 2017. Effects of supplementary choline on quail meat and fatty liver. Revista Brasileira de Zootecnia 46(8):645-651.
Copyright © 2017 Sociedade Brasileira de Zootecnia. This is an Open Access article distributed under the terms of the Creative Commons Attribution License (http://creativecommons.org/licenses/by/4.0/), which permits unrestricted use, distribution, and reproduction in any medium, provided the original work is properly cited.
Introduction
Choline, which is usually related to vitamins, is a water-soluble micronutrient. Sometimes it is classified among the vitamin B group and defined as a naturally occurring compound. However, occasionally, it is not related to vitamins and is considered as an important nutrient due to its nutritional value. Choline has received great importance in the last years because it prevents liver fattening, supports brain development, and is crucial in the neural conduction. Choline has an essential role in the synthesis of the phospholipids and beta-lipoproteins. It enables the transportation and burning of fats, which are also related to its preventive effect in fatty liver. In experimental animals, choline insufficiency caused liver fattening and loss of hepatocytes, atherosclerosis and heart
diseases, growth and bone development anomalies, and impairment in kidney functions (Phillips, 2012).
The effect of choline on the brain development has been confirmed with recent studies. The infants, who received sufficient choline supply during the intrauterine period and in the first years of their life, have a better memory development, especially regarding the term and focusing memories (Zeisel, 2006). There are studies reporting that sufficient choline supplementation during the intrauterine period activates the long-term learning-memory information originating from the hippocampus. Laboratory studies have shown that normal development in the memory region cannot be achieved in rats fed inadequate choline amount (Mellott et al., 2007; Ueland, 2011). Therefore, sufficient choline supplementation in the intrauterine period and in the first two years of life is crucial. It has been reported that the progression of the senile memory losses and Alzheimer’s disease could be regressed with nutrition rich in choline (Zeisel, 2004).
between choline metabolism and cancer (Nakagami et al., 1999; Xu et al., 2008; Iorio et al., 2010).
Fatty liver syndrome is a metabolic disorder (without any relation to infection) and is mostly encountered in poultry, especially in hens bred in cages. As these animals cannot move enough to burn the calories they take, they are more affected by this syndrome. As a result of the liver injury caused by this syndrome and bleeding, egg yield is substantially decreased. Bleeding occurs mostly during egg laying. During the pushing for egg laying, the liver, which has already become rather brittle, easily tears. If the tears occur on large blood vessels, sudden death as a result of bleeding may emerge. The economic loss due to the decrease in egg yield along with the animal deaths is an important problem to focus on. Choline has a considerable potential regarding the control of the liver fattening. The addition of herbal and lipotropic supplements to the feed decreases the adverse metabolic consequences of the high-calorie diet in poultry, as these additives decrease the fat accumulation in the liver (Wen et al., 2014; Khosravinia et al., 2015). Therefore, L-carnitine, gemfibrozil, vitamin E, and vitamin B12 are added to the feed to decrease the liver fattening in poultry (Farrokhyan et al., 2014).
In the literature, many studies have revealed that growth performance, feed efficiency, and some blood parameters of poultry could be influenced by dietary supplementation of commercially available herbal and synthetic choline-containing compounds or lipotropic feed additives (Ebrahimnezhad et al., 2011; Fouladi et al., 2011; Alagawany et al., 2015). However, in the literature, there is no previous research related to quail meat rich in choline. The objective of this study was to investigate the effects of supplementary choline on the amount of choline passing to quail meat and reduction of fat deposition in liver.
Material and Methods
One hundred thirty-six one-day-old Japanese quails
(Coturnix coturnix japonica) were divided into eight
groups with 17 quails per group. Each group was randomly assigned. All of the quails were weighted individually at the time of placement in the cages and average body weights did not differ. Feeds and water were supplied
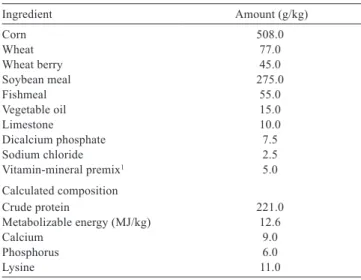
ad libitum. Continuous light was provided. The quails were kept in cages of 50 × 100 cm in size with a normal stocking density (quail/160 cm2) and high stocking density (quail/90 cm2). The quails in control groups were given a basal diet. The quails in other groups were given the same basal diet supplemented with choline at 900 mg kg−1, 1800 mg kg−1, or 3600 mg kg−1 (Table 1).
The groups were as follows: high stocking density, basal diet, control group (HSD - control 1); normal stocking density, basal diet, control group (NSD - control 2); HSD, basal diet + 900 mg kg−1 choline (A); NSD, basal diet + 900 mg kg−1 choline (B); HSD, basal diet + 1800 mg kg−1 choline (C); NSD, basal diet + 1800 mg kg−1 choline (D); HSD, basal diet + 3600 mg kg−1 choline (E); and NSD, basal diet + 3600 mg kg−1 choline (F).
Body weight development, body weight gain, and feed intake of quails in different groups were recorded weekly. At the end of the fifth week, four quails (two males and two females) from each group were randomly selected and slaughtered. The liver of each quail was removed. Both liver tissues and meat samples were kept at −18 °C until analysis.
All reagents used were of analytical-reagent grade and had a purity of at least 99.5%. Calibration standards were prepared in the range of 5.0-250 mg L−1. The correlation coefficient of linear function was 0.9971. The calibration curve was created from six calibration standards.
The work was conducted in accordance with ethical standards and approved by the Ethic Committee on Animal Use, certified by case number 2015/04/3.
Five grams of the sample were mixed with 30 mL 1.0 M HCl in a 100-mL conical flask. The flask was placed into water bath at 70 °C for 3 h and shaken occasionally. After cooling at ambient temperature, pH value was adjusted to 3.5-4.0 with 50% NaOH. The mixture was filtrated and filtrate was collected after discarding the first 5-10 mL. Three milliliters of the filtrate was mixed with 3 mL of chromogenic reagent (75-100 units phospholipase D,
Ingredient Amount (g/kg)
Corn 508.0
Wheat 77.0
Wheat berry 45.0
Soybean meal 275.0
Fishmeal 55.0
Vegetable oil 15.0
Limestone 10.0
Dicalcium phosphate 7.5
Sodium chloride 2.5
Vitamin-mineral premix1 5.0
Calculated composition
Crude protein 221.0
Metabolizable energy (MJ/kg) 12.6
Calcium 9.0
Phosphorus 6.0
Lysine 11.0
1 The premix provided the following, per kilogram of diet: retinyl acetate, 1.8 mg;
cholecalciferol, 0.025 mg; α-tocopherol acetate, 1.25 mg; menadione sodium bisulfate, 1.1 mg; thiamine, 1.1 mg; riboflavin, 4.4 mg; niacin, 35 mg; Ca-pantothenate, 10 mg; prodoxine, 2.2 mg; folic acid, 0.55 mg; cyanocobalamin, 0.02 mg; manganese, 74 mg; zinc, 45 mg; copper, 4 mg; iron, 12.5 mg; iodine, 0.3 mg; selenium, 0.15 mg.
100-120 units choline oxidase, 250-280 units peroxidase, 15 mg 4-aminoantipyrine, and 50 mg phenol was dissolved and filled to 100 mL with 0.05 M Trizma buffer). The mixture was placed into water bath at 37±2 °C for 15 min. After cooling at room temperature, the absorbance of solution was measured at 505 nm against water by UV/Vis spectrophotometer. Choline concentration in samples was determined as choline hydroxide (mg/100 g) by the following equation (Woollard and Indyk, 2000):
,
in which A = net absorbance of sample; S = slope of standard graph; V = volume in mL of hydrolysates; W = weight in grams of sample; 100 = conversion to 100-g basis; and 1000 = conversion of µg to mg.
The total lipid content of liver tissue was determined according to the Folch et al. (1957) method. Liver samples were grounded and homogenized. Two grams of homogenized sample were blended for 2 min with chloroform-methanol mixture (2:1; v/v) in proportion of 10 mL of solvent mixture per gram of tissue in a blender. The slurry was filtered. After adding 8 mL of 0.4% CaCl2 solution to the filtrate, the content was well mixed. After phase separation, the upper layer (methanol and water) of the solution was removed by siphoning so as not to contaminate the chloroform layer. The chloroform in organic phase was evaporated for 10 min at 60 °C. After cooling at room temperature, lipid was weighted. Lipid content (%) was calculated from the weight of the dried lipids (g of lipid/g of liver × 100).
All analyses were performed with SPSS version 22.0 for Windows (Chicago, IL, USA) and P<0.05 was considered as statistically significant. Data was expressed as the mean ± standard deviation (SD). Data were analyzed with variance (ANOVA) and then with Bonferroni’s post hoc test. As the null hypothesis was rejected, two groups were compared with non-parametric Mann-Whitney U test for independent groups.
Results
There was no statistical difference between the control groups 1 and 2 and groups A and B regarding dietary choline supplementation on body weight development of quails (Table 2). However, there were significant differences (P<0.001) between the groups C and D and groups E and F. It was found that the quails reared in high stocking density gained more weight than those in normal stocking density only in groups C and E. There was no effect of the dietary choline supplementation on body weight development of quails.
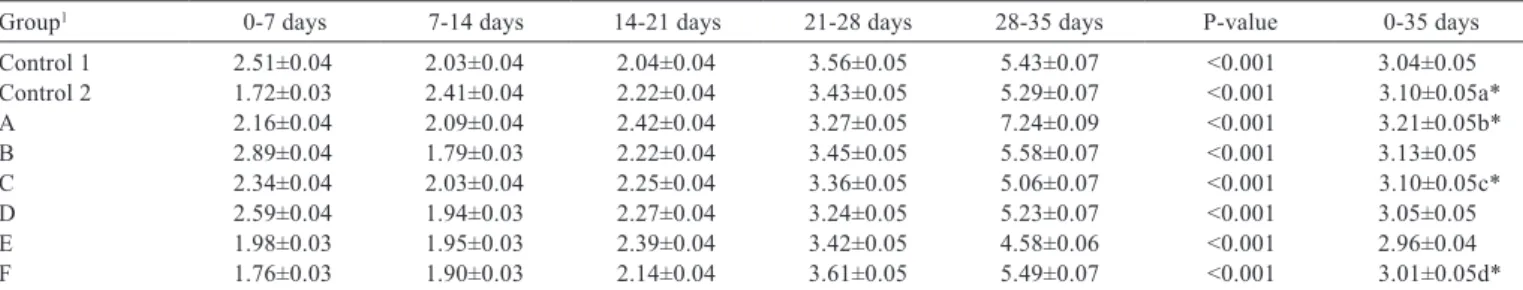
There was no statistical difference between control groups for feed intake (Table 3). When the results obtained on feed intake were evaluated statistically, it was found that there were significant differences (P<0.001) between the groups (A and B; C and D; E and F). In the quails reared in high stocking density, a higher feed intake was observed. From the statistical analyzes of feed conversion ratios, it was observed that there were significant differences (P<0.001) between the groups (control 1 and control 2; A and B; C and D; E and F) (Table 4). There was no effect of the stocking density on feed conversion ratios. From the data, it can be concluded that the dietary choline supplementation does not have any effect on both feed intake and feed conversion ratio.
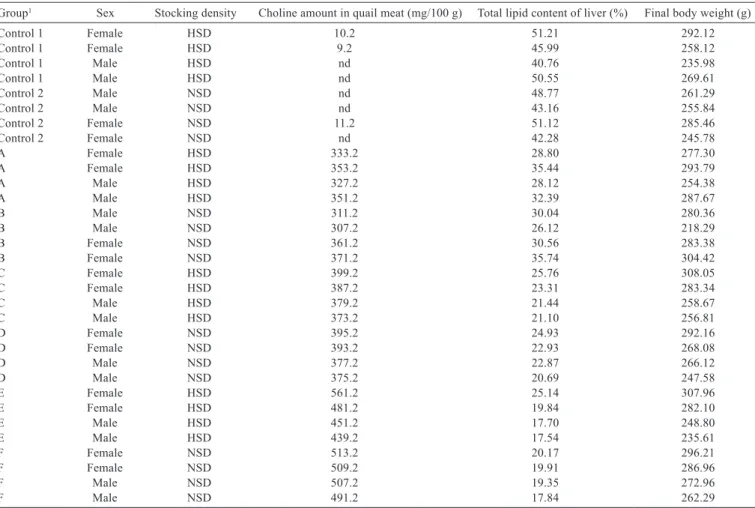
The effect of the dietary choline supplementation at different levels (900, 1800, 3600 mg kg−1) on choline content of quail meat was investigated. The choline content of quail meat was increased statistically in groups fed the choline-supplemented feed compared with the control groups (Table 5). The choline contents in quail meat were determined to be between 307.2 and 371.2 mg kg−1 in groups A and B which fed 900 mg kg−1 choline-supplemented diet, 373.2 and 399.2 mg kg−1 in groups C and D which fed 1800 mg kg−1 choline-supplemented diet, 439.2 and 561.2 mg kg−1 in groups E and F which fed 3600 mg kg−1 choline-supplemented diet. The highest choline content
Group1 0-7 days 7-14 days 14-21 days 21-28 days 28-35 days 0-35 days
Control 1 27.28±0.10 54.43±0.18 72.71±0.28 57.39±0.20 46.63±0.14 258.32±1.60
Control 2 23.65±0.09 49.82±0.16 70.24±0.27 59.21±0.22 49.88±0.16 252.80±1.58
A 28.12±0.10 55.53±0.18 70.93±0.27 68.40±0.26 35.52±0.11 258.50±1.60
B 27.49±0.10 53.72±0.17 69.82±0.27 59.88±0.22 49.66±0.16 260.58±1.64
C 28.18±0.10 56.67±0.19 72.19±0.28 66.73±0.25 51.36±0.16 275.14±1.72c*
D 26.19±0.10 53.99±0.17 68.62±0.26 60.82±0.22 51.86±0.16 261.49±1.65
E 29.05±0.11 55.15±0.18 69.64±0.27 60.98±0.22 58.23±0.21 273.06±1.70d*
F 27.90±0.10 53.03±0.17 67.36±0.25 57.25±0.20 47.63±0.15 253.17±1.58
Table 2 - Effect of the dietary choline supplementation on body weight development of quails
HSD - high stoking density; NSD - normal stocking density.
1 Control group 1: HSD, basal diet; Control group 2: NSD, basal diet; A: HSD, basal diet + 900 mg kg−1 choline; B: NSD, basal diet + 900 mg kg−1 choline; C: HSD, basal diet +
1800 mg kg−1 choline; D: NSD, basal diet + 1800 mg kg−1 choline; E: HSD, basal diet + 3600 mg kg−1 choline; F: NSD, basal diet + 3600 mg kg−1 choline.
in quail meat was detected in E and F groups which fed 3600 mg kg−1 choline-supplemented diet. The choline content of quail meat increased with increasing amount of added choline to feed (Figure 1). There was no influence of stocking density on the choline content of quail meat. When the results were statistically evaluated, it was found that there were significant differences (P<0.001) between the groups (control 1 and A; control 1 and C; control 1 and E; A and C; A and E; C and E; control 2 and B; control 2 and D; control 2 and F; B and D; B and F; D and F).
The total lipid content of liver tissue was decreased statistically in groups fed the choline-supplemented feed compared with the control groups (Table 5). The total lipid contents of liver tissues were determined to be between 42.28% and 51.21% in control groups; 26.12% and 35.74% in groups A and B, which fed 900 mg kg−1 choline-supplemented diet; 20.69% and 25.76% in groups C and D, which fed 1800 mg kg−1 choline-supplemented diet; and 17.84% and 25.14%in groups E and F, which fed 3600 mg kg−1 choline-supplemented diet. The total lipid content of liver tissue decreased with increasing amount of added choline to feed (Figure 2). There was no influence of stocking density on the total lipid content of liver tissue. When the results obtained were evaluated statistically, it
was found that there were significant differences (P<0.001) between the groups (control 1 and A; control 1 and C; control 1 and E; A and C; A and E; C and E; control 2 and B; control 2 and D; control 2 and F; B and D; B and F; D and F).
Discussion
The concentration of supplemental choline had no beneficial effect on performance, body weight gain, feed
Group1 0-7 days 7-14 days 14-21 days 21-28 days 28-35 days P-value 0-35 days
Control 1 68.60±0.24 110.55±0.50 148.76±0.72 204.22±1.06 253.35±1.64 <0.001 785.49±2.68
Control 2 40.65±0.14 120.02±0.54 155.74±0.80 203.07±1.06 263.78±1.66 <0.001 783.27±2.68
A 60.64±0.22 116.01±0.51 171.81±0.94 223.62±1.10 257.31±1.64 <0.001 829.40±2.86
B 79.53±0.27 95.97±0.38 155.12±0.80 206.73±1.07 277.28±1.68 <0.001 814.64±2.84b*
C 66.02±0.24 115.34±0.53 162.77±0.86 224.35±1.10 259.64±1.65 <0.001 828.13±2.86
D 67.96±0.25 104.58±0.48 155.53±0.80 197.22±1.08 271.49±1.67 <0.001 796.79±2.68c*
E 57.60±0.18 107.79±0.50 166.51±0.86 208.65±1.07 266.95±1.66 <0.001 807.50±2.84
F 49.18±0.15 100.66±0.46 144.31±0.70 206.76±1.07 261.38±1.65 <0.001 762.30±2.66d*
Table 3 - Feed intakes of different experimental groups (gram)
HSD - high stoking density; NSD - normal stocking density.
1 Control group 1: HSD, basal diet; Control group 2: NSD, basal diet; A: HSD, basal diet + 900 mg kg−1 choline; B: NSD, basal diet + 900 mg kg−1 choline; C: HSD, basal diet +
1800 mg kg−1 choline; D: NSD, basal diet + 1800 mg kg−1 choline; E: HSD, basal diet + 3600 mg kg−1 choline; F: NSD, basal diet + 3600 mg kg−1 choline.
a: Control groups 1 and 2; b: groups A and B; c: groups C and D; d: groups E and F. * <0.001.
Group1 0-7 days 7-14 days 14-21 days 21-28 days 28-35 days P-value 0-35 days
Control 1 2.51±0.04 2.03±0.04 2.04±0.04 3.56±0.05 5.43±0.07 <0.001 3.04±0.05
Control 2 1.72±0.03 2.41±0.04 2.22±0.04 3.43±0.05 5.29±0.07 <0.001 3.10±0.05a*
A 2.16±0.04 2.09±0.04 2.42±0.04 3.27±0.05 7.24±0.09 <0.001 3.21±0.05b*
B 2.89±0.04 1.79±0.03 2.22±0.04 3.45±0.05 5.58±0.07 <0.001 3.13±0.05
C 2.34±0.04 2.03±0.04 2.25±0.04 3.36±0.05 5.06±0.07 <0.001 3.10±0.05c*
D 2.59±0.04 1.94±0.03 2.27±0.04 3.24±0.05 5.23±0.07 <0.001 3.05±0.05
E 1.98±0.03 1.95±0.03 2.39±0.04 3.42±0.05 4.58±0.06 <0.001 2.96±0.04
F 1.76±0.03 1.90±0.03 2.14±0.04 3.61±0.05 5.49±0.07 <0.001 3.01±0.05d*
Table 4 - Feed conversion ratios of different experimental groups (FI/ADG)
FI - feed intake; ADG - average daily gain; HSD - high stoking density; NSD - normal stocking density.
1 Control group 1: HSD, basal diet; Control group 2: NSD, basal diet; A: HSD, basal diet + 900 mg kg−1 choline; B: NSD, basal diet + 900 mg kg−1 choline; C: HSD, basal diet +
1800 mg kg−1 choline; D: NSD, basal diet + 1800 mg kg−1 choline; E: HSD, basal diet + 3600 mg kg−1 choline; F: NSD, basal diet + 3600 mg kg−1 choline.
a: Control groups 1 and 2; b: groups A and B; c: groups C and D; d: groups E and F.
* <0.001.
intake, and feed conversion ratio values of quails compared with the control groups. The increase in body weight gain and feed intake of poultry has been found by many researchers after the addition of dietary choline (Hassan et al., 2005; Alagawany et al., 2015). On the contrary, Rafeeq et al. (2011) and Ebrahimnezhad et al. (2011) reported that dietary choline at different inclusion levels had no significant effect on body weight gain and feed intake in poultry.
Results of numerous papers clearly indicate negative effects of high stocking densities not only on production performances and parameters of quality, but also on parameters considered reliable indicators of poultry health and welfare (Guardia et al., 2011; El-Gogary and Azzam, 2014). However, in this study, stocking density did not have a significant effect on quail performance, body weight gain, feed intake, and feed conversion ratio values.
In this study, quail meat enriched in choline, which is an extremely beneficial substance for health, was obtained. Choline has a crucial importance in respect to the brain development in children and the development
of the longevity functions (Zeisel, 2006). In cases of choline insufficiency, diseases such as liver fattening, renal impairment, and even cancer may emerge (Garrow, 2007). Studies have shown that problems in liver, kidneys, and pancreas and disorders of memory and growth might be encountered in chronic choline insufficiency (Phillips, 2012).
Group1 Sex Stocking density Choline amount in quail meat (mg/100 g) Total lipid content of liver (%) Final body weight (g)
Control 1 Female HSD 10.2 51.21 292.12
Control 1 Female HSD 9.2 45.99 258.12
Control 1 Male HSD nd 40.76 235.98
Control 1 Male HSD nd 50.55 269.61
Control 2 Male NSD nd 48.77 261.29
Control 2 Male NSD nd 43.16 255.84
Control 2 Female NSD 11.2 51.12 285.46
Control 2 Female NSD nd 42.28 245.78
A Female HSD 333.2 28.80 277.30
A Female HSD 353.2 35.44 293.79
A Male HSD 327.2 28.12 254.38
A Male HSD 351.2 32.39 287.67
B Male NSD 311.2 30.04 280.36
B Male NSD 307.2 26.12 218.29
B Female NSD 361.2 30.56 283.38
B Female NSD 371.2 35.74 304.42
C Female HSD 399.2 25.76 308.05
C Female HSD 387.2 23.31 283.34
C Male HSD 379.2 21.44 258.67
C Male HSD 373.2 21.10 256.81
D Female NSD 395.2 24.93 292.16
D Female NSD 393.2 22.93 268.08
D Male NSD 377.2 22.87 266.12
D Male NSD 375.2 20.69 247.58
E Female HSD 561.2 25.14 307.96
E Female HSD 481.2 19.84 282.10
E Male HSD 451.2 17.70 248.80
E Male HSD 439.2 17.54 235.61
F Female NSD 513.2 20.17 296.21
F Female NSD 509.2 19.91 286.96
F Male NSD 507.2 19.35 272.96
F Male NSD 491.2 17.84 262.29
Table 5 - Amount of choline in quail meat and total lipid content of liver of quails
nd - not detected; HSD - high stocking density; NSD - normal stocking density.
1 Control group 1: HSD, basal diet; Control group 2: NSD, basal diet; A: HSD, basal diet + 900 mg kg−1 choline; B: NSD, basal diet + 900 mg kg−1 choline; C: HSD, basal diet +
1800 mg kg−1 choline; D: NSD, basal diet + 1800 mg kg−1 choline; E: HSD, basal diet + 3600 mg kg−1 choline; F: NSD, basal diet + 3600 mg kg−1 choline.
During this study, quail meat rich in choline, which is very beneficial considering healthy nutrition, was obtained, thus allowing people to take advantage of it. In the literature, there is no previous research related to quail meat rich in choline. The biggest advantage of this study is that it is the first study in the literature on the enrichment of quail meat with choline.
Fatty liver syndrome is one of the most common causes of mortality in poultry. The disease is characterized by sudden death of poultry, resulting from liver rupture and internal bleeding. The onset of fatty liver syndrome in poultry is influenced by several nutritional, metabolic, environmental, genetic, and hormonal factors. However, it is most strongly believed to be linked with nutrition, as 97% of the affected birds were obese (Rozenboim et al., 2016). In this study, fatty liver was minimized in quails. The results obtained showed that choline has an important potential in the control of fatty liver. Choline can be referred to as a lipotropic agent due to its function of acting on fat metabolism by hastening removal or decreasing deposition of fat in liver. The nearest study to our study in the literature was that by Fouladi et al. (2011). They reported that choline supplement in levels of 500 mg kg−1 and 1000 mg kg−1 significantly decreased the cholesterol and triglyceride contents. Furthermore, they noted that the choline supplement prevented the fatty liver syndrome. In our study, the total lipid content of liver was reduced by 42% in E and F groups which fed 3600 mg/kg choline-supplemented diet compared with the control groups.
Conclusions
We recommend the use of supplementary choline that can improve the amount of choline passing to quail meat and reduction of fat deposition in liver.
Acknowledgments
This research (13541) was supported by the Scientific Research Projects Coordination Unit of Mustafa Kemal University.
References
Alagawany, M.; El-Hindawy, M.; Attia, A.; Farag, M. and El-Hack, M. A. 2015. Influence of dietary choline levels on growth performance and carcass characteristics of growing Japanese quail. Advances in Animal and Veterinary Sciences 3:109-115. Ebrahimnezhad, Y.; Tajaddini, M. H.; Ahmadzadeh, A. R.; Aghdam
Shahryar, H. and Ghiasi Galekandi, J. 2011. The effect of additional
choline supplement and its effect on Japanese quails (Coturnix coturnix japonica) performance and visceral organs weight in corn and Iranian soybean meal based diet. Annals of Biological Research 2:573-577.
El-Gogary, M. R. and Azzam, M. M. 2014. Effects of dietary tryptophan levels and stocking density during the growing-finishing phase on broiler performance and immunity. Asian Journal of Animal and Veterinary Advances 9:568-577.
Farrokhyan, P.; Bouyeh, M.; Lartey, F. M. and Seidavi, A. 2014. The effects of dietary L-carnitine and gemfibrozil on performance, carcass characteristics, cholesterol and triglycerides in broiler chicks. Avian Biology Research 7:160-166.
Folch, J.; Lees, M. and Sloane-Stanley, G. H. 1957. A simple method for the isolation and purification of total lipids from animal tissues. The Journal of Biological Chemistry 226:497-509.
Fouladi, P.; Salamat Doust, N.; Ramin, A.; Aghdam Shahriar, A. and Abolfazl, H. A. 2011. Effect of choline chloride supplement on liver’s and blood’s cholesterol and triglyceride contents in Japanese quail. Annals of Biological Research 2:472-477. Garrow, T. A. 2007. Handbook of vitamins: Choline. 4th edition.
CRC Press, New York. p.459-487.
Guardia, S.; Konsak, B.; Combes, S.; Levenez, F.; Cauquil, L.; Guillot, J. F.; Moreau-Vauzelle, C.; Lessire, M.; Juin, H. and Gabriel, I. 2011. Effects of stocking density on the growth performance and digestive microbiota of broiler chickens. Poultry Science 90:1878-1889. Hassan, R. A.; Attia, Y. A. and El-Ganzory, E. H. 2005. Growth,
carcass quality and serum constituents of slow growing chicks as affected by betaine addition to diets containing 1. different levels of choline. International Journal of Poultry Science 4:840-850. Iorio, E.; Ricci, A.; Bagnoli, M.; Pisanu, M. E.; Castellano, G.; Di Vito,
M.; Venturini, E.; Glunde, K.; Bhujwalla, Z. M.; Mezzanzanica, D.; Canevari, S. and Podo, F. 2010. Activation of phosphatidylcholine cycle enzymes in human epithelial ovarian cancer cells. Cancer Research 70:2126-2135.
Khosravinia, H.; Chethen, P. S.; Umakantha, B. and Nourmohammadi, R. 2015. Effects of lipotropic products on productive performance, liver lipid and enzymes activity in broiler chickens. Poultry Science Journal 3:113-120.
Mellott, T. J.; Follettie, M. T.; Diesl, V.; Hill, A. A.; Lopez-Coviella I. and Blusztajn, J. K. 2007. Prenatal choline availability modulates hippocampal and cerebral cortical gene expression. FASEB Journal 21:1311-1323.
Nakagami, K.; Uchida, T.; Ohwada, S.; Koibuchi, Y.; Suda, Y.; Sekine, T. and Morishita, Y. 1999. Increased choline kinase activity and elevated phosphocholine levels in human colon cancer. Japanese Journal of Cancer Research 90:419-424.
Phillips, M. M. 2012. Analytical approaches to determination of total choline in foods and dietary supplements. Analytical and Bioanalytical Chemistry 403:2103-2112.
Rafeeq, M.; Pasha, T. N.; Rashid, N.; Hilal, B. and Shahzad, I. 2011. Effect of supplementation of methionine, betaine and choline on the performance of broiler chicken in early life fed methionine deficient ration. The Journal of Animal and Plant Sciences 21:778-780.
Rozenboim, I.; Mahato, J.; Cohen, N. A. and Tirosh, O. 2016. Low protein and high-energy diet: a possible natural cause of fatty liver hemorrhagic syndrome in caged White Leghorn laying hens. Poultry Science 95:612-621.
Ueland, P. M. 2011. Choline and betaine in health and disease. Journal of Inherited Metabolic Disease 34:3-15.
Wen, Z. G.; Tang, J.; Hou, S. S.; Guo, Y. M.; Huang, W. and Xie, M. 2014. Choline requirements of White Pekin ducks from hatch to 21 days of age. Poultry Science 93:1-6.
Woollard, D. C. and Indyk, H. E. 2000. Determination of choline in milk and infant formulas by enzymatic analysis: collaborative study. Journal of AOAC International 83:131-138.
Zeisel, S. H. 2004. Nutritional importance of choline for brain development. The Journal of the American College of Nutrition 23:621-626.