Epigenetic Reprogramming of the Type III Interferon
Response Potentiates Antiviral Activity and Suppresses
Tumor Growth
Siyuan Ding1,2, William Khoury-Hanold3, Akiko Iwasaki3,4, Michael D. Robek1*
1Department of Pathology, Yale University School of Medicine, New Haven, Connecticut, United States of America,2Microbiology Graduate Program, Yale University School of Medicine, New Haven, Connecticut, United States of America,3Department of Immunobiology, Yale University School of Medicine, New Haven, Connecticut, United States of America,4Howard Hughes Medical Institute, Yale University School of Medicine, New Haven, Connecticut, United States of America
Abstract
Type III interferon (IFN-l) exhibits potent antiviral activity similar to IFN-a/b, but in contrast to the ubiquitous expression of the IFN-a/breceptor, the IFN-lreceptor is restricted to cells of epithelial origin. Despite the importance of IFN-lin tissue-specific antiviral immunity, the molecular mechanisms responsible for this confined receptor expression remain elusive. Here, we demonstrate that the histone deacetylase (HDAC) repression machinery mediates transcriptional silencing of the unique IFN-l receptor subunit (IFNLR1) in a cell-type-specific manner. Importantly, HDAC inhibitors elevate receptor expression and restore sensitivity to IFN-l in previously nonresponsive cells, thereby enhancing protection against viral pathogens. In addition, blocking HDAC activity renders nonresponsive cell types susceptible to the pro-apoptotic activity of IFN-l, revealing the combination of HDAC inhibitors and IFN-l to be a potential antitumor strategy. These results demonstrate that the type III IFN response may be therapeutically harnessed by epigenetic rewiring of the IFN-lreceptor expression program.
Citation:Ding S, Khoury-Hanold W, Iwasaki A, Robek MD (2014) Epigenetic Reprogramming of the Type III Interferon Response Potentiates Antiviral Activity and Suppresses Tumor Growth. PLoS Biol 12(1): e1001758. doi:10.1371/journal.pbio.1001758
Academic Editor:Hidde L. Ploegh, Whitehead Institute, United States of America
ReceivedSeptember 26, 2013;AcceptedNovember 19, 2013;PublishedJanuary 7, 2014
Copyright:ß2014 Ding et al. This is an open-access article distributed under the terms of the Creative Commons Attribution License, which permits unrestricted use, distribution, and reproduction in any medium, provided the original author and source are credited.
Funding:This work was funded by a grant from the Dana Foundation Neuroimmunology Program (to M.D.R.), NIH Public Health Service grant AI054359 (to A.I.), and NIDDK P30 DK34989 - Silvio O. Conte Digestive Diseases Research Core Centers. S.D. was supported in part by a fellowship from the China Scholarship Council. W.K.H. was supported in part by NIH Predoctoral Virology Training grant T32 AI055403. The funders had no role in study design, data collection and analysis, decision to publish, or preparation of the manuscript.
Competing Interests:The authors have declared that no competing interests exist.
Abbreviations:CNS, central nervous system; DNMT, DNA methyltransferase; HAT, histone acetyltransferase; HCMV, human cytomegalovirus; HDAC, histone deacetylase; HSV, herpes simplex virus; IFN, interferon; ISG, interferon-stimulated gene; PHH, primary human hepatocyte; TF, transcription factor; VSV, vesicular stomatitis virus.
* E-mail: [email protected]
Introduction
Interferons (IFNs) constitute an indispensable part of the innate immune response. Type I IFNs protect against viral infections, whereas type II IFN is essential for host defense against bacterial and parasitic pathogens. More recently, a new class of cytokines collectively known as the type III IFNs has been identified [1,2]. In humans, the type III IFN family consists of IFN-l1,l2, and l3 (encoded by IFNL1, IFNL2, and IFNL3). Similar to type I IFNs, IFN-ls are induced upon virus infection, activate IFN-stimulated gene (ISG) expression, and display broad-spectrum antiviral activity [3–5]. Recent studies have demonstrated a critical role of IFN-l in protection against viral infection at epithelial and mucosal surfaces including the lung and gut [6–8]. In addition, single nucleotide polymorphisms in IFNL3 are strongly associated with viral clearance in patients with chronic hepatitis C virus infection [9–12], highlighting the importance of this cytokine family in the intrahepatic immune response. Despite its significance, how IFN-l activity is regulated remains unresolved.
In contrast to the ubiquitously expressed IFN-a/breceptor, the IFN-lreceptor is composed of the unique achain (encoded by
IFNLR1) and the IL-10 receptorbchain (encoded byIL10RB), and is restricted to epithelial cells and hepatocytes. We and others have previously reported that IFNLR1 but not IL10RB is differentially expressed in various cell types [13–16]. IFNLR1 mRNA expression is high in the lung, gut, and liver, and low in other tissues including the brain and most immune cell types, consistent with the observation that IFN-lprimarily protects the epithelium but not the central nervous system (CNS) from virus infection [7,15]. Despite the pivotal role of IFN-lin tissue-specific immune responses, nothing is known about the molecular mechanisms that underlie its distinctive receptor expression pattern.
Results
IFN-l Receptor Expression Is Inversely Correlated with
IFNLR1Promoter Methylation
Contrary to the broad expression of IL10RB, IFNLR1 is predominantly expressed in cells of epithelial origin. A high level of IFNLR1 mRNA is found in primary human hepatocytes (PHHs), whereas little is detected in primary human astrocytes and neurons [14]. We also observed hypersensitivity to IFN-l in liver hepatocyte-derived cell lines such as Huh7 and HepG2, in contrast to low responsiveness in brain glia-derived cell lines such as U87 and U373 [14]. To determine the mechanism underlying the cell-type-specific expression pattern, we first investigated the role of epigenetic modifications in this process. Cpgplot analysis of the23000 to+1000 genomic DNA region relative to the putative IFNLR1 promoter transcription start site (TSS) identified two adjacent CpG islands (Figure S1A). In the mammalian genome, DNA methylation occurs on the cytosine residues within CpG dinucleotides via the action of DNA methyltransferases (DNMTs). CpG islands are frequently subject to methylation for tissue-specific gene regulation [17]. Therefore, we examined IFNLR1 promoter methylation in Huh7 and U87 cells using McrBC, an endonuclease that specifically cleaves DNA containing methylcyt-osine in a GTP-dependent manner. We found that the IFNLR1 promoter was more methylated in U87 cells than Huh7 cells (Figure 1A). To further quantitatively characterize the DNA methylation status, we performed bisulfite conversion sequencing. The IFNLR1 promoter in Huh7 and HepG2 cells exhibited hypomethylation in contrast to hypermethylation at both CpG islands in U87 and U373 cells (Figure 1B–C), revealing a strong correlation between the DNA methylation pattern and IFNLR1 expression level. Consistently, we also found low levels of DNA methylation in the IFNLR1 promoter in PHHs (Figure S1B–C). We then asked whether the reversal of methylation would enhance
IFNLR1 expression. U87 cells were cultured in the presence of 5-aza-29-deoxycytidine (5azadC), a nucleoside analogue that potent-ly inhibits DNMT activity. Despite significant reduction of DNA methylation in theIFNLR1promoter in 5azadC-treated U87 cells (Figure S1D–E), there was only a marginal increase in IFNLR1 mRNA (Figure 1D), suggesting DNA demethylation alone was insufficient to reactivate transcription.
Histone Deacetylases Mediate IFN-lReceptor Silencing in Nonresponsive Cells
In addition to DNA methylation, histone posttranslational modifications including acetylation and methylation also influence chromatin structure and gene expression. Closed chromatin configuration, characteristic of histone H3 trimethyl lysine 9 (H3K9me3) and lysine 27 (H3K27me3), is linked to transcriptional repression. In contrast, acetylation of histone H3 and H4 is associated with active promoters. Strikingly, revealed by chroma-tin immunoprecipitation (ChIP) using anti-acetylated H3 (AcH3) or control immunoglobulin G (IgG) antibodies, the histone acetylation levels within theIFNLR1promoter were considerably higher in Huh7 than U87 cells (Figure 2A). RNA Polymerase II (RNA Pol II), a core component of the transcription complex, was also significantly enriched at theIFNLR1promoter in Huh7 cells compared to U87 cells (Figure 2B). Conversely, enrichment of H3K27me3 was only observed in U87 cells, but not Huh7 cells (Figure 2C). These data collectively demonstrate that theIFNLR1 promoter chromatin structure is relaxed in Huh7 cells in contrast to a more condensed state in U87 cells. Another hallmark of constitutive heterochromatin, H3K9me3, was negative in both cell types (Figure S2A). Importantly, theIFNLR1 promoter was also hypoacetylated in primary human astrocytes (Figure S2B), which like U87 and U373 cells, displays low levels of IFN-l receptor expression [14].
Since histone acetylation is controlled by the balance of histone acetyltransferases (HATs) and deacetylases (HDACs), we next asked whether blocking HDAC function would reactivate IFN-l receptor expression in nonresponsive cells. Consistent with a previous report [18], SAHA and MS-275 increased global H3 acetylation (Figure S2C). IFNLR1 expression was significantly up-regulated in U87 cells when nonspecific HDAC inhibitors such as SAHA, Trichostatin A, and sodium butyrate were used together with 5azadC (Figures 2D and S2D). Importantly, MS-275, a specific inhibitor of HDAC1, also increased IFN-l receptor expression (Figure 2D). Knockdown of HDAC1 using small interfering RNA (siRNA) further confirmed its role in IFNLR1 silencing (Figure S2E–F). In addition, functional disruption of HDAC2/3 activity by apicidin suggests the involvement for other class I HDACs in the repression machinery as well (Figure S2D). In contrast, IFNLR1 expression was not altered by tubacin, which targets HDAC6, or nicotinamide, a pan-inhibitor for class III HDACs (Figures 2D and S2D). Of note, IFNLR1 expression was also markedly up-regulated in primary astrocytes post-5azadC and -MS-275 treatment (Figure 2E). IL10RB expression was not affected by any of these treatments (Figure 2E), and no increase in IFNLR1 expression was observed in inhibitor-treated Huh7 and A549 cells, both of which have naturally high IFN-l receptor levels (Figure S2G–H).
To further test whether HDAC-mediated IFNLR1 silencing is a unique mechanism in the brain, we applied inhibitors to a variety of IFN-l-insensitive cell types. Receptor expression was also up-regulated in Jurkat, BNL, and NIH3T3 cells (Figure S2I–K), suggesting a common repressive mechanism that is not tissue- or species-specific. IFNLR1 expression was also markedly increased in primary human CD4+
T cells following the inhibitor treatment Author Summary
Interferons (IFNs) are important cytokines that protect the host from a broad spectrum of pathogens. IFN-l, the most recently identified IFN, exhibits potent antiviral activity similar to IFN-a/b. In contrast to the ubiquitous presence of the IFN-a/b receptor, however, the expression of the IFN-lreceptor is restricted to epithelial cells and hepato-cytes and absent from immune cells and brain cells. The molecular mechanism responsible for this tissue-specific IFN-lreceptor expression has been elusive. In this study, we demonstrate that histone acetylation mediates chro-matin relaxation and transcriptional activation of IFN-l receptor expression in a cell-type-specific manner. When IFN-l nonresponsive cells—those that don’t normally express the IFN-l receptor—are treated with inhibitors that block histone deacetylase (HDAC) function, these cells express elevated levels of the IFN-l receptor and gain sensitivity to IFN-l. Importantly, rewiring the receptor expression program in this manner via use of HDAC inhibitors can protect formerly IFN-l-insensitive cells, including primary human astrocytes, from both DNA and RNA virus infection. Additionally, treatment with HDAC inhibitors can also render previously nonresponsive cell types susceptible to the antitumor activity of IFN-l, thereby inducing apoptosis in glioblastoma cells. This work suggests that a combination of small-molecule HDAC inhibitors and IFN-l could be a potential antiviral and anticancer strategy.
Figure 1.IFNLR1promoter methylation negatively correlates with IFN-lresponsiveness.(A) Huh7 and U87 genomic DNA was digested withMcrBCin the presence or absence of GTP and used as template for nested PCR with primers specific for theIFNLR1promoter. (B) Huh7, HepG2, U87, and U373 genomic DNA was subject to bisulfite conversion sequencing. Each circle represents one CpG dinucleotide, with filled circles indicating methylated motifs and open circles nonmethylated motifs. Each row represents an individual clone of the population. Lower numbers indicate relative distance to the TSS. (C) Quantification of the methylation status on both CpG islands in (B). (D) U87 cells were cultured in the presence of vehicle control DMSO, 3mM, or 10mM 5azadC for 72 h. IFNLR1 and IL10RB expression was examined by RT-qPCR. In all panels, data represent the mean and standard error of the mean (SEM) of at least three experiments.
doi:10.1371/journal.pbio.1001758.g001
(Figure S2L). Taken together, these results indicate that IFNLR1 expression is epigenetically silenced via HDAC-mediated repres-sion in nonresponsive cell types.
NF-Y, an Activating TF, Differentially Binds to theIFNLR1
Promoter
To identify the key TFs that regulate IFNLR1 expression, we performed electrophoretic mobility shift assays (EMSAs) using the 2500 to 2401 region of the IFNLR1 promoter. Based on bioinformatics prediction, this region was likely to contain binding sites for a number of TFs with important regulatory functions (Figure S3A). Specific TF binding was observed in the2434 to2 401 segment, but not the other areas of this region (Figure S3B). Further mutagenesis revealed that the TF binding motif was located within the2430,2421 sequences (Figure S3C).In silico
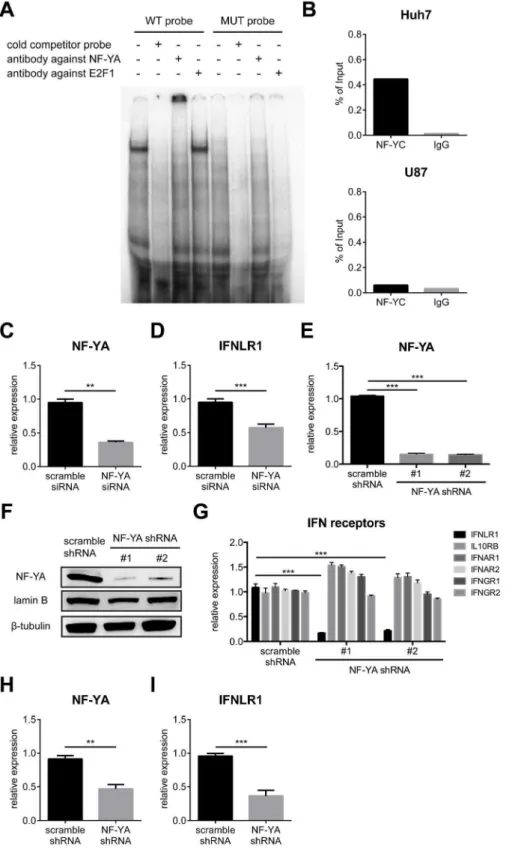
analysis of the sequence predicts the binding of several candidates including NF-Y and the E2F family proteins (Figure S3A). Antibody supershift confirmed a specific interaction of NF-Y but not E2F1 within this region (Figure 3A). NF-Y is a heterotrimeric TF composed of three subunits. While NF-YA interacts with the sequence specific CCAAT motif, NF-YB and NF-YC directly contact DNA through histone-fold domains [19]. Each base of the
CCAAT motif is essential for NF-Y binding, with immediate flanking sequences on both ends also being critical [20]. NF-YA interaction with the IFNLR1 promoter was verified by the complete loss of binding following mutation of the CCAAT binding site (Figure 3A). We further validated that YB and NF-YC also interacted with the promoter sequence (Figure S4A). In contrast, we did not observe a supershift with another member of the E2F family proteins, E2F4 (Figure S4A). To explore the role of NF-Y inIFNLR1transcription, we examined the expression of all three subunits. Surprisingly, none of NF-YA, NF-YB, and NF-YC were discrepantly expressed on both the mRNA and protein levels (Figure S4C–D), implying that NF-Y acts through mechanisms other than differential expression. Although the NF-Y binding site is located within CpG island I, the interaction was independent of DNA methylation (Figure S4B).
Interestingly, ChIP analysis indicated that NF-Y was preferen-tially bound to theIFNLR1promoter in Huh7 cells but not U87 cells, suggesting it to be an activating TF (Figure 3B). To test this hypothesis, NF-Y was silenced using a pool of mixed individual siRNAs. Consistent with our prediction, accompanied with reduced NF-YA expression following siRNA transfection (Figure 3C), IFN-l receptor expression in Huh7 cells was Figure 2. IFNLR1 expression is silenced via HDAC-mediated repression and reactivated by 5azadC and MS-275 treatment.(A–C) ChIP analysis was performed on theIFNLR1promoter in Huh7 and U87 cells with AcH3, RNA Pol II, H3K27me3, and control IgG antibodies. (D) U87 cells were cultured with DMSO or 10mM 5azadC for 72 h. For the latter, 2mM SAHA, 1mM MS-275, or 2mM tubacin were added in the last 24 h. IFNLR1 and IL10RB expression was determined by RT-qPCR. (E) Primary astrocytes were cultured in the presence of DMSO or 10mM 5azadC (72 h) and 1mM MS-275 (24 h), and stimulated with PBS, 100 ng/ml IFN-l1, or 500 U/ml IFN-afor 24 h. IFNLR1 and IL10RB expression was measured by RT-qPCR. In all panels, data represent the mean and SEM of at least three experiments.
doi:10.1371/journal.pbio.1001758.g002
Figure 3. NF-Y binds to theIFNLR1promoter sequence and positively regulates IFN-lreceptor expression.(A) Gel mobility shift assay was performed using the wild-type (WT) probe (the2434,2401 region of theIFNLR1promoter) and the mutant (MUT) probe (CCAAT motif
substituted with AACCG), incubated with U87 cell nuclear extracts, poly (dA:dT), 100-fold excess of cold probe, and the indicated antibodies. (B) ChIP analysis was performed on theIFNLR1promoter in Huh7 and U87 cells with NF-YC and control IgG antibodies. (C–D) NF-YA and IFNLR1 expression was examined by RT-qPCR in Huh7 cells transfected with scrambled or NF-YA-specific siRNAs. (E, G) Expression of NF-YA and receptor subunits of type I, II, and III IFNs was examined by RT-qPCR in Huh7 cells stably expressing scrambled or NF-YA-specific shRNAs. (F) Lysates from Huh7 stable cell lines were harvested and used for WB using the indicated antibodies. Lamin B serves as loading control for nuclear proteins. (H–I) NF-YA and IFNLR1 expression was measured by RT-qPCR in PHHs infected with lentiviruses encoding scrambled or NF-YA-specific shRNAs. In all panels, data represent the mean and SEM of at least three experiments.
doi:10.1371/journal.pbio.1001758.g003
significantly down-regulated (Figure 3D). Conversely, NF-YA knockdown did not affect IFNLR1 expression in low-expressing U87 cells (Figure S4E–F). In addition to transient depletion, we also generated two stable NF-YA-silenced Huh7 cell lines using lentivirus-delivered short hairpin RNA (shRNA) specifically targeting NF-YA. We verified the specificity of the knockdown (Figure 3E–F) and found pronounced selective down-regulation of IFNLR1, but not IL10RB or type I/II IFN receptor expression (Figure 3G). In contrast, IFNLR1 expression was not altered in low-expressing U373 cells with stable NF-YA knockdown (Figure S4G–H). Importantly, transduction of primary hepatocytes with lentivirus delivering NF-YA-specific shRNA resulted in a simul-taneous reduction in both NF-YA and IFNLR1 levels (Figure 3H– I), confirming NF-Y as an activating TF driving IFNLR1 expression in IFN-l-responsive cells.
Small-Molecule Inhibitors RelaxIFNLR1Promoter
Chromatin and Increase NF-Y Binding
To further investigate the molecular mechanism by which HDAC inhibition enhances IFNLR1 expression, we examined IFNLR1 promoter chromatin by surveying enrichment of acety-lated histones and TFs in inhibitor-treated U87 cells. In contrast to the lack of active transcription signatures prior to treatment (Figure 2A–B), levels of AcH3 and RNA Pol II were substantially
elevated (Figure 4A–B). Interestingly, although the expression of NF-Y subunits was not increased by the inhibitors (Figure S5A–B), NF-Y binding affinity to the IFNLR1 promoter was markedly augmented in U87 cells (Figure 4C), suggesting that the chromatin configuration was reshaped to permit access of activatingtrans -acting factors such as NF-Y.
Up-Regulated IFN-l Receptor Expression Restores Sensitivity to IFN-land Potentiates Antiviral Activity
To assess the physiological relevance of pharmacologically enhanced receptor expression, we stimulated U87 cells with IFN-l in the presence or absence of DNMT and HDAC inhibitors, and measured downstream signaling, gene expression, and antiviral activity. IFN-lsignaling was more potently activated in inhibitor-primed U87 cells, revealed by increased STAT1 tyrosine phosphorylation (Figure 4D) and ISG expression (Figures 4E and S5C–E). Importantly, we also observed higher levels of phosphorylated STAT1 and elevated MX1 expression in inhib-itor-treated astrocytes in response to IFN-l(Figures S5F and 4F), whereas IFN-a induced comparable MX1 levels (Figure 4F), implying 5azadC and MS-275 did not affect IFN-a/b receptor expression. To determine if increased ISG induction reinforces antiviral activity, U87 cells were cultured with or without inhibitors, exposed to IFN-lor IFN-b, and infected with vesicular Figure 4. 5azadC and MS-275 openIFNLR1promoter chromatin and increase IFN-lsensitivity in nonresponsive cells.(A–C) ChIP analysis was performed on theIFNLR1promoter in 5azadC and MS-275-treated U87 cells with AcH3, RNA Pol II, NF-YC, and control IgG antibodies. (D) U87 cells were preincubated with DMSO or small-molecule inhibitors and stimulated with or without 10 ng/ml or 100 ng/ml of IFN-l1/2/3 for 6 h. Lysates were used for WB using the indicated antibodies. (E–F) MX1 expression was measured by RT-qPCR in U87 cells and primary astrocytes following the indicated treatment. In all panels, data represent the mean and SEM of at least three experiments.
doi:10.1371/journal.pbio.1001758.g004
stomatitis virus (VSV) expressing GFP. IFN-bcompletely blocked VSV infection, whereas IFN-l exclusively protected inhibitor-treated U87 cells from VSV (Figure 5A–B). Even at the lowest concentration, IFN-lcounteracted the cytopathic effect (CPE) of VSV infection in inhibitor-treated U87 cells, whereas MS-275 alone did not confer protection (Figure 5C). Furthermore, virus titer from infected U87 cells was decreased in the presence of inhibitors and IFN-l(Figure 5D).
We next extended our study to primary human astrocytes. Reprogramming the IFNLR1 promoter sensitized astrocytes to IFN-land protected against VSV infection at all MOIs (Figure S6A–C). We further tested the antiviral activity to herpes simplex virus–1 (HSV-1), a clinically important DNA virus that establishes latent infection in the CNS. Without inhibitors, astrocytes were efficiently infected by HSV-1, even in the presence of IFN-l, suggesting that chromatin remodeling is required for IFN-l signaling in astrocytes (Figure 6A–B). Notably, we observed less viral gene expression and stronger ISG induction in inhibitor-primed, IFN-l stimulated astrocytes (Figure 6C–E). We also assessed the efficacy against another neurotropic DNA virus, human cytomegalovirus (HCMV). Consistently, IFN-l reduced HCMV-GFP infection at all MOIs in inhibitor-treated astrocytes (Figure S7A–C). These results collectively demonstrate that
up-regulated IFNLR1 expression in brain cells by inhibitor treatment sensitizes them to IFN-lsignaling and protects against both DNA and RNA virus infections.
MS-275 and IFN-lCooperatively Induce Apoptosis and Suppress Glioblastoma Proliferation
In addition to their antiviral functions, type I IFNs are also recognized for their antiproliferative activity, with IFN-a being used clinically in the treatment of multiple myeloma and metastatic melanoma [21]. The antitumor activity of IFN-lhas also been established in multiple cancer models [22–24]. However, the potential clinical application of IFN-lis limited by its restricted receptor distribution. We therefore explored whether IFNLR1 up-regulation by HDAC inhibitors renders cancer cells sensitive to the antitumor properties of IFN-l. In accordance with our hypothesis, combined treatment of U87 glioblastoma cells with MS-275 and IFN-l inhibited growth in culture over a 4-d time course, while IFN-l alone had minimal effects on proliferation (Figure 7A–B). Of note, the combination did not substantially affect the proliferation of primary astrocytes (Figure S8A), likely due to selective effects exerted by MS-275 on rapidly replicating tumor cells. We also employed a three-dimensional spheroid culture system to mimic physiological conditions of tumor growth. Figure 5. IFN-lprotects U87 cells from VSV infection in the presence of small-molecule inhibitors.(A) U87 cells were treated with DMSO or inhibitors, stimulated with 100 ng/ml IFN-l1 or 500 U/ml IFN-bfor 24 h, and infected with VSV-GFP (MOI = 0.1) for 16 h. GFP expression was monitored by fluorescence microscopy (representative images are shown; 406magnification). (B) Lysates from infected U87 cells following the indicated treatment were used for WB using indicated antibodies. G, glycoprotein; N, nucleoprotein; P, phosphoprotein; M, matrix protein. (C) Cytolytic effects were measured in U87 cells following the indicated treatment and infection with VSV (MOI = 1) for 24 h. Viable cells were stained with crystal violet. (D) VSV titers in infected U87 cells were determined by a standard plaque assay. In all panels, data represent the mean and SEM of at least three experiments.
doi:10.1371/journal.pbio.1001758.g005
Consistently, the combined treatment reduced both the size and number of U87 spheroid formation (Figure 7C–E). WST-1 assay in the 3D culture also revealed reduced glioblastoma proliferation following the combination treatment (Figure 7F).
Many factors may contribute to cancer cell growth inhibition, including senescence, cell cycle arrest, dampened survival signal-ing, or increased apoptosis. Senescence-associatedb-galactosidase (SA-b-gal) activity was comparable in all treatment groups, suggesting that the proliferation defect we observed was indepen-dent of senescence (Figure S8B–C). Both mammalian target of rapamycin (mTOR) and NF-kB signaling are linked with cell growth and commonly deregulated in cancers, but no disruption in these pathways was detected following treatment (Figure S8D). Intriguingly, propidium iodide staining revealed an increase in the sub-G1 cell cycle population, indicative of apoptotic cells, in U87 cells with the combined treatment (Figure 7G). Consistently, we found an elevated frequency of Annexin V+ cells in combined compared to single treatment, further verifying an affirmative role of apoptosis in growth inhibition (Figure 7H). Stronger activation
of the intrinsic cell death pathway, represented by caspases 3 and 9 cleavage, correlated with the increased level of apoptosis with the combined treatment (Figure S8D). In addition to U87 glioblasto-ma, we extended our study to mouse B16 melanoglioblasto-ma, a cancer cell type that responds to mouse IFN-l (Figure S8E). As expected, either MS-275 or IFN-lalone led to cell growth inhibition, but the combination again had the greatest effect (Figure S8F). In conclusion, we demonstrate that mechanistically, enhanced receptor expression renders cancer cells susceptible to the pro-apoptotic activity of IFN-land thus restricts tumor cell expansion.
Discussion
A central question to IFN-l regulation is how the restricted distribution of its receptor is achieved. Here, we dissected the role of epigenetic modifications and TFs in determining the tissue-specificity of IFN-l receptor expression. We identified HDAC-mediated closed chromatin conformation as the major silencing mechanism of IFNLR1 expression in IFN-l-insensitive cells. In Figure 6. IFN-lprotects primary astrocytes from HSV-1 infection in the presence of small-molecule inhibitors.(A) Primary human astrocytes were treated with DMSO or inhibitors, stimulated with 100 ng/ml IFN-l1 or 500 U/ml IFN-bfor 24 h, and infected with HSV-1-GFP (MOI = 1). At 12 h postinfection, GFP expression was analyzed by flow cytometry. (B) Quantification of the percentage of GFP positive cells and mean fluorescence intensity (MFI) in (A). (C) Expression of HSV-1 genes, including ICP27 (immediate early), UL30 (early), VP16 (leaky-late), and UL36 (true-late), was measured by RT-qPCR. (D) Expression of MX1 and ISG15 was measured by RT-qPCR. (E) Lysates from infected astrocytes were used for WB using indicated antibodies. In all panels, data represent the mean and SEM of at least three experiments.
doi:10.1371/journal.pbio.1001758.g006
addition, we demonstrated that the IFNLR1 promoter is exclu-sively accessible for the transcription activator NF-Y in IFN-l -responsive cells. Remarkably, 5azadC and MS-275 up-regulate IFN-l receptor expression and restore IFN-l sensitivity in previously nonresponsive cell types (Figure 8). Taken together, these findings establish the mechanism underlying the tissue-specific
regulation of the IFN-lresponse and lay the foundation for the future translational use of the cytokine.
The brain is a partially immune privileged site and protected from most virus infections by effective peripheral clearance and multilayer physical barriers. Unfortunately, some neurotropic viruses includinga- andb-herpesviruses, represented by HSV-1 Figure 7. Combination of MS-275 and IFN-linhibits cancer proliferation by elevated rate of apoptosis.(A) U87 cells were cultured in the presence of DMSO, 1mM MS-275 alone, 100 ng/ml IFN-l1 alone, or both for the course of 4 d. Cell numbers were manually determined by hemacytometer counting at the indicated time points. (B, F) Cell proliferation of U87 cells or U87 spheroids in 3D culture with indicated treatment were performed using the WST-1 assay, which measures active cellular metabolism. (C) U87 spheroid formation in 3D culture was photographed at day 14 in culture (representative images are shown; 2006magnification). (D–E) Quantification of the relative sizes and numbers of U87 spheroids in (C). (G) Cell cycle analysis was performed in U87 cells with indicated treatment using propidium iodide staining. Numbers in the histogram show fractions (percent) of sub-G1, N, 2N, and polyploidy from left to right. (H) U87 cells with indicated treatment were stained with Annexin V-FITC and 7-AAD. Numbers indicate the percentage of FITC-positive cells (upper left quadrant). FITC, fluorescein isothiocyanate; 7-AAD, 7-Aminoactinomycin. In all panels, data represent the mean and SEM of at least three experiments.
doi:10.1371/journal.pbio.1001758.g007
and HCMV, can still breach the defense and infect neurons and astrocytes. Using 5azadC and MS-275, which epigenetically rewire the IFNLR1 expression program in primary astrocytes, we demonstrated that the type III IFN response can be remodeled to protect against both DNA and RNA viruses. Notably, MS-275 is capable of penetrating the blood–brain barrier [25], and therefore has the potential to be used clinically in this respect.
Cancer has traditionally been viewed as a disease driven by the accumulation of genetic mutations. Lately, important roles for epigenetic abnormalities in cancer have come to light [26]. However, current cancer therapies still have limited effectiveness and serious side effects. Novel regimens are being tested, including immunotherapy targeting PD-1 and CTLA-4 [27,28], oncolytic viruses [29], and HDAC inhibitors such as SAHA and MS-275 [30,31]. Although these new therapies have proven therapeutic efficacy in a number of malignancies, better approaches are still urgently needed. MS-275 is currently in clinical trials for refractory and relapsed acute leukemia and advanced lymphoma [30]. Nevertheless, the application of HDAC inhibitors may be limited by the presence of HDAC mutations in certain cancers [32].
The clinical use of IFN-l has a unique advantage over traditional IFN-atherapy, which is accompanied by toxicity due to the ubiquitously expressed IFN-a/b receptor. In addition to induction of apoptosis and cell cycle arrest by HDAC inhibitors
[33], IFN-lexhibits potent pro-apoptotic activity, thereby limiting the proliferation of HDAC inhibitor-resistant tumors. Further-more, the combination is also superior to IFN-l alone due to effectiveness in cancers previously insensitive to IFN-l, including glioblastoma, which is known for its complexity and ability to develop resistance to single agent therapy [34]. This approach will need to be evaluated in a clinically relevantin vivomodel system, and would be an important area for future study. In conclusion, our study elucidates the molecular mechanisms underlying the tissue specificity of IFN-lreceptor expression and provides a basis for the future development of antiviral and anticancer therapies.
Materials and Methods
Cells and Reagents
Huh7, HepG2, U87, U373, A549, 293T, BHK-21, B16, BNL, and NIH3T3 cells were maintained in high glucose DMEM supplemented with 10% heat-inactivated FBS, 100 U/ml penicil-lin, 100mg/ml streptomycin, 2 mM L-glutamine, 1 mM sodium pyruvate, 16 MEM nonessential amino acids, and 10 mM HEPES (Invitrogen). Jurkat cells were cultured in complete RPMI 1640 medium. Cryopreserved PHHs from HIV, HBV, and HCV-free donors were purchased from BD Biosciences. Fresh PHHs were also obtained from the Cellular and Molecular Physiology core facility of the Yale Liver Center. Primary human astrocytes and HCMV-GFP were kindly provided by Dr. Anthony van den Pol (Yale University). Primary human T lymphocytes were originally obtained from the New York Blood Bank, and the CD4+
population was purified and kindly provided by Dr. Walther Mothes (Yale University). CD4+
T cells were cultured in complete RPMI 1640 medium supplemented with 100 U/ml IL-2 and 100 ng/ml IL-7 and stimulated with 10mg/ml PHA every 72 h. Cells were treated with recombinant human IFN-a2a, IFN-b, human IFN-l1, IFN-l2, IFN-l3 (R&D Systems), murine IFN-l2 (PeproTech), or universal type I IFN (hIFN-aA/D) (PBL Interferon Source). DNMT inhibitor 5azadC and HDAC inhibitors SAHA, TSA, sodium butyrate, MS-275, apicidin, tubacin, and nicotinamide were purchased from Selleckchem.
RNA Isolation, Reverse Transcription, and Real-Time Quantitative PCR (RT-qPCR)
Total RNA was harvested and extracted using RNeasy Mini Kit (Qiagen) according to the manufacturer’s instructions. RNA was converted to cDNA using High Capacity cDNA Reverse Transcription Kit (Applied Biosystems). qPCR was performed using the 7500 Real Time PCR system (Applied Biosystems) with each reaction composed of cDNA reverse-transcribed from 50 ng of total RNA, 12.5ml of Power SYBR Green master mix (Applied Biosystems), and 200 nM both forward and reverse primers in a total volume of 25ml. For the detection of human IFNLR1 and IL10RB, the following TaqMan Gene Expression Assay primers and probe mixes were used instead of SYBR Green master mix: IFNLR1(Hs00417120_m1) andIL10RB(Hs00175123_m1). qPCR was performed using the following program: an initial incubation at 50uC for 2 min, a denaturation step at 95uC for 10 min, and 50 cycles consisting of 30 s at 95uC followed by 1 min at 60uC. Relative levels of gene expression were analyzed by ABI SDS v1.2.3 software (Applied Biosystems) with normalization to the constitutively expressed GAPDH using the DDCt method. The primers used for qPCR are listed in Table S1. The specificity of primers was verified by dissociation curve analysis, and the expected amplicon size of amplified products was visualized by 1.5% agarose gel electrophoresis.
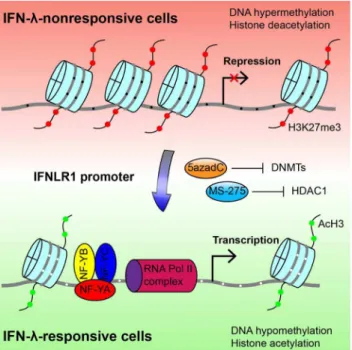
Figure 8. Molecular mechanism of differential IFNLR1 expres-sion.Epigenetic silencing is the major mechanism that restricts IFNLR1 expression in IFN-lnonresponsive cell types. In the low-expressing cells (red background), the IFNLR1 promoter is repressed through DNA hypermethylation, histone hypoacetylation, and loss of affinity for TFs and RNA Polymerase II complexes. In contrast, theIFNLR1promoter is associated with DNA hypomethylation, histone acetylation, and binding of activating TF (represented by trimeric NF-Y) and RNA Polymerase II in high-expressing cells (green background). Importantly, sensitivity to IFN-lcan be regained by blocking DNMT and HDAC activities with 5azadC and MS-275, which epigenetically reconfigure the promoter chromatin structure. Gray line,IFNLR1promoter DNA; red filled circles, H3K27 trimethylation; green filled circles, histone H3 acetylation; black filled circle, methylated CpG dinucleotides; white filled circle, unmethy-lated CpG dinucleotides.
doi:10.1371/journal.pbio.1001758.g008
siRNA Transfection
Huh7 cells were seeded into 24-well plates and transfected with ON-TARGET plus SMARTpool siRNA against NF-YA (Thermo Scientific) or scrambled siRNA (Ambion) using DharmaFECT4 (Dharmacon). U87 cells were seeded into 24-well plates and transfected with FlexiTube siRNA against HDAC1 (Qiagen) or scrambled siRNA using DharmaFECT1. RNA was extracted from transfected cells 72 h later, and gene expression was determined by RT-qPCR.
shRNA Transduction
HEK293T cells in six-well plates were transfected with pGIPZ lentiviral shRNA plasmid against NF-YA (Open Biosystems), Gag/Pol, and VSV-G packaging plasmids using Fugene 6 (Promega). Supernatants were harvested 48 h posttransfection and filtered through a 0.22mm filter (Millipore). Huh7 or U373 cells were transduced with lentiviruses in the presence of polybrene (8mg/ml). After 48 h, transduced cells were subject to puromycin selection (1mg/ml) for 14 d. Stable NF-YA knockdown cells were maintained in low puromycin (400 ng/ml) medium.
McrBC Cleavage Assay
A total of 1mg of genomic DNA from Huh7 and U87 cells was digested with 10 units of McrBC (NEB) with or without 1 mM GTP in 50ml reaction buffered with NEB buffer 2 at 37uC overnight. Digested DNA was purified with phenol/chloroform extraction followed by ethanol precipitation and subjected to PCR amplification using two pairs of nested PCR primers (see Table S1). PCR products were visualized by 1% agarose gel electropho-resis.
Bisulfite Conversion Sequencing
Genomic DNA was extracted from Huh7, HepG2, U87, and U373 cells using phenol/chloroform extraction. Bisulfite conver-sion reactions were performed using EpiTect Bisulfite Kit (Qiagen) according to the manufacturer’s instructions. The modified DNA was used as template for nested PCR with two sets of primers for both CpG islands in the IFNLR1 promoter. Hot-start PCR was performed using GoTaq polymerase (Pro-mega) at 95uC for 5 min, followed by a first-round amplification using 40 cycles of 95uC for 30 s, 45uC for 40 s, and 72uC for 1 min. The conditions for the second amplification were the same as those for the first round of PCR. The PCR products were electrophoresed in 2% agarose gels and visualized with ethidium bromide. Bands of expected sizes were excised, and the DNA was extracted using a Wizard SV Gel and PCR clean-up system (Promega). The purified DNA was cloned into pGEM-T vector (Promega). At least 20 clones were selected for each CpG island per cell type and sequenced by the Keck DNA Sequencing Facility (Yale University). The primers used in the nested PCR are listed in Table S1.
ChIP
Huh7, U87 cells, and primary astrocytes were grown to 90% confluency on 10 cm cell culture dishes. After crosslinking at RT for 10 min with 1% formaldehyde, glycine was added to a final concentration of 0.125 M. The cells were washed three times with ice-cold PBS and scraped into PBS containing 1 mM PMSF. Cells were lysed with ChIP lysis buffer (140 mM NaCl, 1 mM EDTA, 0.25% Triton X-100, 10% glycerol, 0.5% NP-40 in 50 mM HEPES-KOH, pH 7.5) and subsequently with nuclei lysis buffer (100 mM NaCl, 1 mM EDTA, 0.5 mM EGTA, 0.1% sodium deoxycholate in 10 mM Tris-HCl, pH 8.0). The chromatin lysate
was sonicated in 4uC water-bath using Bioruptor Standard for 15 min. Supernatants were collected from sonicated chromatin by centrifugation at 4uC at 13,200 rpm for 20 min. Before ChIP, chromatin was incubated with sheared salmon sperm DNA for pre-clearing. ChIP-grade antibodies against acetylated histone H3, RNA Polymerase II, H3K27me3, H3K9me3 (Millipore), and NF-YC (Santa Cruz) were incubated with precleared protein A/G magnetic beads (Pierce) at 4uC overnight. Antibody/beads complexes were mixed with precleared chromatin at 4uC overnight. ChIP complexes were washed in order with high-salt, low-salt, LiCl wash buffers, and TE water. Bound DNA was released by reversing the crosslinking and subject to qPCR analysis. The primers used for qPCR reactions are listed in Table S1.
EMSA
Gel shift assays were performed using radiolabeled EMSA probes with dialyzed nuclear extracts from U87 cells. Cells grown to 90% confluency from 10 cm cell culture dishes were harvested in hypotonic buffer (10 mM KCl, 10 mM HEPES, 1.5 mM MgCl2, 0.5 mM DTT, 1 mM PMSF, 5mg/ml leupeptin), homogenized with a type B Dounce homogenizer, and further lysed in nuclear lysis buffer (0.42 M NaCl, 20 mM HEPES, 1.5 mM MgCl2, 0.2 mM EDTA, 25% glycerol, 1 mM DTT, 2 mM PMSF, 5mg/ml leupeptin). Nuclear extracts were dialyzed against 16binding buffer (20 mM HEPES, 50 mM KCl, 1 mM b-ME, 10% glycerol, 0.5 mM DTT, 1 mM PMSF) at 4uC overnight. EMSA probes were generated by annealing two strands of oligonucleotides from sequences in the IFNLR1 promoter. Probes were end-labeled witha-32P-dCTP using Klenow reaction from Random Primed DNA Labeling Kit (Roche). For each EMSA reaction, 50,000 cpm probe was incubated with 10ml of 26binding buffer, 1ml of poly (dA:dT), 5mg of nuclear protein in a 20ml reaction with or without 100-fold excess of cold competitor probe, and antibodies against NF-YA, NF-YB, NF-YC, E2F1, and E2F4. Protein–DNA complexes were separated by 6% native polyacrylamide gels in low-ionic strength buffer system. Gels were dried at 80uC for 1 h and exposed to Maximum Resolution film (Kodak) at280uC for 3 d. The sequences of oligonucleotides used in this study are listed in Table S1.
In VitroMethylation
EMSA probe was methylated in vitro with methyltransferase M.SssI (NEB) and S-adenosylmethionine (SAM) as the methyl donor. A total of 5mg of probe was incubated with 40 units of
M.SssI and 1ml of SAM (32 mM stock concentration) in 150ml reaction buffered with NEB buffer 2 at 37uC overnight. The next day the reaction was supplemented with an additional 1ml of SAM and further incubated for 2 h. Methylated probe was isolated by phenol/chloroform extrac-tion and ethanol precipitaextrac-tion. Complete CpG methylaextrac-tion was verified by digestion with the methylation-sensitive restriction enzyme HpaII (NEB).
Histone Extraction
U87 cells were treated with HDAC inhibitors, harvested in high salt lysis buffer (320 mM NaCl, 0.1 mM EDTA, 0.5% NP-40 in 50 mM Tris-HCl, pH 7.6), and incubated on ice for 10 min. After concentrifugation at 13,200 rpm for 10 min at 4uC, supernatants were lysed in 16SDS loading buffer (2% SDS, 100 mM DTT, 0.1% bromophenol blue, 10% glycerol in 50 mM Tris-HCl, pH 6.8). Lysates were sonicated for 15 min, heated at 95uC for 10 min, and used in Western blotting (WB).
WB
U87 cells were washed with ice-cold PBS before lysis in RIPA buffer (150 mM sodium chloride, 1.0% Triton X-100, 0.5% sodium deoxycholate, 0.1% SDS, 50 mM Tris, pH 8.0). Cells were scraped off from six-well plates and agitated at 4uC for 10 min. After centrifugation at 12,000 rpm at 4uC for 20 min, supernatants were mixed at 1:1 ratio with 26Laemmli buffer. Protein lysates were heated at 95uC for 5 min, separated by 10% Mini-PROTEAN gels (Bio-Rad), transferred onto 0.45mm nitrocellulose membranes, and probed with antibodies against p-STAT1 (Y701), total p-STAT1, NF-kB p65, Akt, total Akt, p-mTOR, total p-mTOR, PKR (Cell Signaling), VSV, GFP, NF-YA, NF-YB, NF-YC, p-p70 S6 kinase, total p70 S6 kinase, PI3K, p21, Rb, caspase-3, caspase-9, XIAP, survivin,b-tubulin (Santa Cruz), acetylated H3 (Millipore), and total histone H3 (Abcam). Secondary incubation was performed with anti-goat, anti-rabbit, or anti-mouse IgG HRP-linked antibodies (Cell Signaling). Proteins were visualized using HyGlo chemiluminescent HRP antibody detection reagent (Denville Scientific Inc.) and a Fuji LAS-3000 cooled CCD camera (FUJIFILM).
CPE Assay
U87 cells in 24-well plates were treated with DMSO or 5azadC plus MS-275 as previously described, stimulated with 10, 30, or 100 ng/ml IFN-lor 500 U/ml IFN-bfor 24 h, and infected with wild-type VSV at MOI = 1. At 24 h postinfection, cells were fixed with 2% paraformaldehyde (PFA) at RT for 10 min, washed with PBS, and stained with crystal violet (0.5% in 25% methanol) at RT for 10 min.
Plaque Assay
Drug-treated U87 cells were stimulated with IFN-l or IFN-b before VSV infection. Supernatants were harvested 24 h postin-fection and diluted to 10, 102, 103, 104, 105, 106, and 107 fold. Diluted viruses were transferred onto BHK-21 cells for a 30 min infection at 37uC. Viruses were then removed and replaced by 1% methylcellulose. Virus titers were determined 2 d later by quantification of GFP-positive cells.
Cell Proliferation/Viability Assay
Inhibitor-treated cells in 96-well plates were incubated with 100ml of complete medium containing 10ml of WST-1 (Roche) and incubated at 37uC for 0.5 h. Absorbance was measured at 440 nm by the basic endpoint protocol using a SpectraMAX 190 microplate reader (Molecular Devices). Wells containing reagent alone were used as blank control for background subtraction. Data were analyzed by SoftMax Pro 4.7.1 (Molecular Devices).
Three-Dimensional Spheroid Culture
AlgiMatrix 3D Culture System (Invitrogen) was used for constituting artificial bioscaffold to facilitate the formation of U87 spheroids in three dimensions. U87 cells were seeded into AlgiMatrix six-well plates and grown to form spheroids for 2 wk following the manufacturer’s instructions. After MS-275 or IFN-l treatment, images were acquired in the bright field and cells were harvested for WST-1 assay. CellProfiler 2.0 software (http://www. cellprofiler.org/) was used for image processing to detect and quantify individual spheroids.
Flow Cytometry
MS-275 or IFN-l-treated U87 cells in six-well plates were trypsinized and stained with propidium iodide (Fisher) or Annexin V-FITC plus 7-AAD (BioLegend). Stained cells were washed with
PBS, and fluorescence was measured with a 13-color Stratedigm S1000Ex flow cytometry platform. Laser light scatter was used to gate out dead or dying cells. For HSV-1 and VSV experiments, infected astrocytes were fixed with PFA, stained for live/dead cells (BioLegend), and examined using the Stratedigm flow cytometer for GFP expression. Data were analyzed with FlowJo Software v8.8.7 (TreeStar).
Senescence-Associatedb-Galactosidase Activity Assay MS-275 or IFN-l-treated U87 cells in six-well plates were fixed with 1 ml of 0.2% glutaraldehyde for 15 min at RT, washed twice with PBS, and incubated with staining solution (5 mM potassium ferrocyanide, 5 mM potassium ferricyanide, 2 mM MgCl2, 1 mg/ ml X-gal). Cells were incubated in dark at 37uC for 16 h. Images at 2006 magnification were acquired and analyzed with CellProfiler 2.0.
HSV-1 Infection
Primary astrocytes were cultured in the presence of DMSO or 5azadC and MS-275 as previously described, stimulated with 100 ng/ml IFN-lor 500 U/ml IFN-bfor 24 h, and infected with HSV-1-GFP at MOI = 1 at 37uC for 1 h. Cells were harvested 12 h postinfection for flow cytometry or RT-qPCR analysis.
Statistical Analysis
The results are shown as means6SEM. Statistical significance was determined by Student’s t test using Prism 6 (GraphPad Software). Significant differences are indicated on figures (*p# 0.05; **p#0.01; ***p#0.001).
Supporting Information
Figure S1 Two putative CpG islands are located in close proximity to the TSS in theIFNLR1gene locus.(A) CpG
islands in the IFNLR1 promoter were identified with EMBOSS Cpgplot (European Bioinformatics Institute) using the default settings. Lower numbers indicate relative distance to the TSS. (B) Genomic DNA was isolated from PHHs and used for bisulfite conversion sequencing. Each circle represents one CpG dinucle-otide, with filled circles indicating methylated motifs and open circles nonmethylated motifs. Each row represents an individual clone of the population. Lower numbers indicate relative distance to the TSS. (C) Quantification of the methylation status of both CpG islands in (B). (D) U87 cells were cultured in the presence of 3mM 5azadC for 72 h. Genomic DNA was isolated and used for bisulfite conversion sequencing. (E) Quantification of the methyl-ation status on CpG island II in (D).
(TIF)
examined by RT-qPCR. (G–L) Huh7 (human liver hepatoma), A549 (human lung adenocarcinoma), Jurkat (human T lympho-ma), BNL (mouse hepatocellular carcinolympho-ma), NIH3T3 (mouse embryonic fibroblast), and primary human CD4+
T cells were cultured in the presence of DMSO or 10mM 5azadC for 72 h. A total of 1mM MS-275 was added to 5azadC-treated cells in the last 24 h. IFNLR1 expression was determined by RT-qPCR. In all panels, data represent the mean and SEM of at least three experiments.
(TIF)
Figure S3 The 2434 to 2401 region of the IFNLR1 promoter interacts withtrans-acting factors.(A)
Bioinfor-matics prediction of TF binding sites was performed using the TRANSFAC v10.2 database. TFs with potential binding capacity were annotated with putative binding matrix indicated as stretches of colored bars. Box highlights NF-Y and E2F family proteins. Lower numbers indicate relative distance to the TSS. (B) Gel mobility shift assay was performed using three 32P-radiolabeled DNA probes that covered the2500,2401 region of theIFNLR1
promoter, incubated with U87 cell nuclear extracts, poly (dA:dT), and excessive cold competitor probe. (C) Gel mobility shift assay was performed using the2434,2401 mutant probes in which
adjacent five nucleotides were converted to consecutive adenines, as is illustrated with red crosses on solid black lines (see detailed sequence information in Table S1).
(TIF)
Figure S4 NF-Y is ubiquitously expressed, and its knockdown in nonresponsive cells does not affect IFN-l receptor expression. (A–B) Gel mobility shift assay was performed using the wild-type (WT) probe (the 2434,2401
region of theIFNLR1promoter) and the methylated (ME) probe (WT probe after M.SssI treatment), which were incubated with poly (dA:dT), U87 cell nuclear extracts, excessive cold competitor probe, and indicated antibodies. (C–D) Expression of YA, NF-YB, and NF-YC in different cell types was measured by RT-qPCR and WB with indicated antibodies. (E–F) NF-YA and IFNLR1 expression was determined by RT-qPCR in U87 cells transfected with scrambled or NF-YA-specific siRNAs. (G–H) NF-YA and IFNLR1 expression was measured by RT-qPCR in U373 cells stably expressing scrambled or NF-YA-specific shRNAs. In all panels, data represent the mean and SEM of at least three experiments.
(TIF)
Figure S5 Small-molecule inhibitors increase IFN-l sensitivity in U87 cells without affecting NF-Y expres-sion. (A) Expression of NF-YA, NF-YB, and NF-YC was determined by RT-qPCR in U87 cells post-DNMT and -HDAC inhibitor treatment. (B) Lysates from U87 cells with indicated treatment were used for WB using indicated antibodies. (C–E) U87 cells were treated with or without 5azadC and MS-275, and stimulated in the presence or absence of 100 ng/ml IFN-l1 for 24 h. Expression of representative ISGs, such as IFI27 (P27), CXCL10 (IP-10), and ISG15 (G1P2), was determined by RT-qPCR. (F) Primary astrocytes were preincubated with DMSO or small-molecule inhibitors and stimulated with or without 100 ng/
ml of IFN-l1 for 6 h. Lysates were used for WB using the indicated antibodies. In all panels, data represent the mean and SEM of at least three experiments.
(TIF)
Figure S6 Inhibitor-primed astrocytes are protected from VSV infection by IFN-l.(A–C) Primary astrocytes were treated with or without 5azadC and MS-275, stimulated with 100 ng/ml IFN-lor 500 U/ml IFN-bfor 24 h, and infected with VSV-GFP at MOI = 1, 0.1, or 0.01. At 24 h postinfection, cells were harvested, fixed, and examined for GFP expression by flow cytometry.
(TIF)
Figure S7 Inhibitor-primed astrocytes are protected from HCMV infection by IFN-l. (A–C) Primary astrocytes were treated with or without 5azadC and MS-275, stimulated with 100 ng/ml IFN-lor 500 U/ml IFN-bfor 24 h, and infected with HCMV-GFP at MOI = 10, 1, or 0.1. At 48 h postinfection, GFP expression was determined by RT-qPCR.
(TIF)
Figure S8 Suppression of tumor growth is independent of cellular senescence and mediated via apoptotic pathways.(A, F) Cell proliferation of primary human astrocytes or mouse B16 melanoma cells with indicated treatment were performed using WST-1 assay, which measures active cellular metabolism. (B) U87 cells were cultured in the presence of DMSO, 1mM MS-275, 100 ng/ml IFN-l1, or both for 4 d. Cytochemical staining for SA-b-gal activity was monitored by inverted microscopy (representative images are shown; 2006 magnifica-tion). (C) Percentage of SA-b-gal positive cells in (B) was quantified with CellProfiler (Broad Institute). (D) Lysates from U87 cells with indicated treatment were used for WB using indicated antibodies. (E) B16 cells were treated with 10 ng/ml murine IFN-l2 or 10 U/ ml universal type I IFN for 24 h and MX1 expression was measured by RT-qPCR. In all panels, data represent the mean and SEM of at least three experiments.
(TIF)
Table S1 Oligonucleotides used for PCR, RT-qPCR, and EMSA experiments. For EMSA probes, underlining indicates sites of mutation.
(DOCX)
Acknowledgments
We thank Drs. Robert Means and Qin Yan for discussions and critical comments on the manuscript; Dr. Narendra Wajapeyee for technical assistance; and Drs. Anthony van den Pol, John Rose, Guido Wollmann, Justin Paglino, Walther Mothes, and Luis Agosto for reagents and technical assistance.
Author Contributions
The author(s) have made the following declarations about their contributions: Conceived and designed the experiments: SD WKH AI MDR. Performed the experiments: SD WKH. Analyzed the data: SD WKH AI MDR. Contributed reagents/materials/analysis tools: AI. Wrote the paper: SD MDR.
References
1. Kotenko SV, Gallagher G, Baurin VV, Lewis-Antes A, Shen M, et al. (2003) IFN-lambdas mediate antiviral protection through a distinct class II cytokine receptor complex. Nat Immunol 4: 69–77.
2. Sheppard P, Kindsvogel W, Xu W, Henderson K, Schlutsmeyer S, et al. (2003) IL-28, IL-29 and their class II cytokine receptor IL-28R. Nat Immunol 4: 63–68.
3. Ank N, West H, Bartholdy C, Eriksson K, Thomsen AR, et al. (2006) Lambda interferon (IFN-lambda), a type III IFN, is induced by viruses and IFNs and displays potent antiviral activity against select virus infections in vivo. J Virol 80: 4501–4509.
signal transduction and gene regulation kinetics. Gastroenterology 131: 1887– 1898.
5. Robek MD, Boyd BS, Chisari FV (2005) Lambda interferon inhibits hepatitis B and C virus replication. J Virol 79: 3851–3854.
6. Mordstein M, Kochs G, Dumoutier L, Renauld JC, Paludan SR, et al. (2008) Interferon-lambda contributes to innate immunity of mice against influenza A virus but not against hepatotropic viruses. PLoS Pathog 4: e1000151. doi: 10.1371/journal.ppat.1000151
7. Mordstein M, Neugebauer E, Ditt V, Jessen B, Rieger T, et al. (2010) Lambda interferon renders epithelial cells of the respiratory and gastrointestinal tracts resistant to viral infections. J Virol 84: 5670–5677.
8. Pott J, Mahlakoiv T, Mordstein M, Duerr CU, Michiels T, et al. (2011) IFN-lambda determines the intestinal epithelial antiviral host defense. Proc Natl Acad Sci U S A 108: 7944–7949.
9. Ge D, Fellay J, Thompson AJ, Simon JS, Shianna KV, et al. (2009) Genetic variation in IL28B predicts hepatitis C treatment-induced viral clearance. Nature 461: 399–401.
10. Suppiah V, Moldovan M, Ahlenstiel G, Berg T, Weltman M, et al. (2009) IL28B is associated with response to chronic hepatitis C interferon-alpha and ribavirin therapy. Nat Genet 41: 1100–1104.
11. Tanaka Y, Nishida N, Sugiyama M, Kurosaki M, Matsuura K, et al. (2009) Genome-wide association of IL28B with response to pegylated interferon-alpha and ribavirin therapy for chronic hepatitis C. Nat Genet 41: 1105–1109. 12. Thomas DL, Thio CL, Martin MP, Qi Y, Ge D, et al. (2009) Genetic variation
in IL28B and spontaneous clearance of hepatitis C virus. Nature 461: 798–801. 13. Doyle SE, Schreckhise H, Khuu-Duong K, Henderson K, Rosler R, et al. (2006) Interleukin-29 uses a type 1 interferon-like program to promote antiviral responses in human hepatocytes. Hepatology 44: 896–906.
14. Pagliaccetti NE, Robek MD (2010) Interferon-lambda in the immune response to hepatitis B virus and hepatitis C virus. J Interferon Cytokine Res 30: 585–590. 15. Sommereyns C, Paul S, Staeheli P, Michiels T (2008) IFN-lambda (IFN-lambda) is expressed in a tissue-dependent fashion and primarily acts on epithelial cells in vivo. PLoS Pathog 4: e1000017. doi: 10.1371/journal.ppat.1000017 16. Witte K, Gruetz G, Volk HD, Looman AC, Asadullah K, et al. (2009) Despite
IFN-lambda receptor expression, blood immune cells, but not keratinocytes or melanocytes, have an impaired response to type III interferons: implications for therapeutic applications of these cytokines. Genes Immun 10: 702–714. 17. Jones PA (2012) Functions of DNA methylation: islands, start sites, gene bodies
and beyond. Nat Rev Genet 13: 484–492.
18. Glaser KB, Staver MJ, Waring JF, Stender J, Ulrich RG, et al. (2003) Gene expression profiling of multiple histone deacetylase (HDAC) inhibitors: defining a common gene set produced by HDAC inhibition in T24 and MDA carcinoma cell lines. Mol Cancer Ther 2: 151–163.
19. Nardini M, Gnesutta N, Donati G, Gatta R, Forni C, et al. (2013) Sequence-specific transcription factor NF-Y displays histone-like DNA binding and H2B-like ubiquitination. Cell 152: 132–143.
20. Kim CG, Sheffery M (1990) Physical characterization of the purified CCAAT transcription factor, alpha-CP1. J Biol Chem 265: 13362–13369.
21. Belardelli F, Ferrantini M, Proietti E, Kirkwood JM (2002) Interferon-alpha in tumor immunity and immunotherapy. Cytokine Growth Factor Rev 13: 119– 134.
22. Lasfar A, Lewis-Antes A, Smirnov SV, Anantha S, Abushahba W, et al. (2006) Characterization of the mouse lambda ligand-receptor system: IFN-lambdas exhibit antitumor activity against B16 melanoma. Cancer Res 66: 4468–4477.
23. Numasaki M, Tagawa M, Iwata F, Suzuki T, Nakamura A, et al. (2007) IL-28 elicits antitumor responses against murine fibrosarcoma. J Immunol 178: 5086– 5098.
24. Sato A, Ohtsuki M, Hata M, Kobayashi E, Murakami T (2006) Antitumor activity of IFN-lambda in murine tumor models. J Immunol 176: 7686–7694. 25. Simonini MV, Camargo LM, Dong E, Maloku E, Veldic M, et al. (2006) The
benzamide MS-275 is a potent, long-lasting brain region-selective inhibitor of histone deacetylases. Proc Natl Acad Sci U S A 103: 1587–1592.
26. Baylin SB, Jones PA (2011) A decade of exploring the cancer epigenome— biological and translational implications. Nat Rev Cancer 11: 726–734. 27. Kwek SS, Dao V, Roy R, Hou Y, Alajajian D, et al. (2012) Diversity of
antigen-specific responses induced in vivo with CTLA-4 blockade in prostate cancer patients. J Immunol 189: 3759–3766.
28. Topalian SL, Hodi FS, Brahmer JR, Gettinger SN, Smith DC, et al. (2012) Safety, activity, and immune correlates of anti-PD-1 antibody in cancer. N Engl J Med 366: 2443–2454.
29. Parato KA, Senger D, Forsyth PA, Bell JC (2005) Recent progress in the battle between oncolytic viruses and tumours. Nat Rev Cancer 5: 965–976. 30. Gojo I, Jiemjit A, Trepel JB, Sparreboom A, Figg WD, et al. (2007) Phase 1 and
pharmacologic study of MS-275, a histone deacetylase inhibitor, in adults with refractory and relapsed acute leukemias. Blood 109: 2781–2790.
31. Mann BS, Johnson JR, Cohen MH, Justice R, Pazdur R (2007) FDA approval summary: vorinostat for treatment of advanced primary cutaneous T-cell lymphoma. Oncologist 12: 1247–1252.
32. Smith KT, Workman JL (2009) Histone deacetylase inhibitors: anticancer compounds. Int J Biochem Cell Biol 41: 21–25.
33. Glozak MA, Seto E (2007) Histone deacetylases and cancer. Oncogene 26: 5420–5432.
34. Minniti G, Muni R, Lanzetta G, Marchetti P, Enrici RM (2009) Chemotherapy for glioblastoma: current treatment and future perspectives for cytotoxic and targeted agents. Anticancer Res 29: 5171–5184.