Working
Paper
334
Performance-Based compensation vs.
guaranteed compensation: Contractual
incentives and performance
Klenio Barbosa
André Bucione
André Portela Souza
CMICRO - Nº19
– • •
Os artigos dos Textos para Discussão da Escola de Economia de São Paulo da Fundação Getulio Vargas são de inteira responsabilidade dos autores e não refletem necessariamente a opinião da
FGV-EESP. É permitida a reprodução total ou parcial dos artigos, desde que creditada a fonte.
Performance-Based Compensation vs. Guaranteed
Compensation: Contractual Incentives and Performance
∗
Klenio Barbosa
†André Bucione
‡André Portela Souza
§December 16, 2013
Abstract
Top management from retail banks must delegate authority to lower-level managers to operate branches and service centers. Doing so, they must navigate through conflicts of interest, asymmetric information and limited monitoring in designing compensation plans for such agents. Pursuant to this delegation, the banks adopt a system of performance targets and incentives to align the interests of senior management and unit managers. This paper evaluates the causal relationship between performance-based salaries and managers’ effective performance. We use a fixed effects estimator to analyze an unbalanced panel of data from one of the largest Brazilian retail banks during the period from January 2007 to June 2009. The results indicate that agents with guaranteed variable salary contracts demonstrate inferior performance compared with agents who have performance-based compensation packages. We conclude that there is a moral hazard that can be observed in the behavior of agents who are subject to guaranteed variable salary contracts.
Keywords: Contract and Incentives; Moral Hazard; Retail Bank Industry; Manager’s Performance; Panel Data Analysis.
JEL classification: D23; G3; J3.
∗The authors thank an anonymous referee and the editor of Economia Aplicada journal for comments and
suggestions. André Bucione gratefully acknowledges SIEMENS for the financial support. Only the authors are responsible for the opinions expressed in this article. The usual disclaimer applies.
1
Introduction
Typically, the top management of retail banks must delegate authority to lower-level managers to supervise bank activities outside headquarters. A 2009 Febraban study (Barbosa, 2009),
for example, shows that there were 19,142 retail bank branches in Brazil that covered the entire national territory and directly employed more than 431,000 people. Operations of such magnitude would not be viable if senior management did not delegate authority to production unit managers.
However, according to the literature on organization theory, there are potential conflicts of interest between senior management and the managers of production units (e.g., bank branches) that arise due to information asymmetry between the parties and because it is impossible for senior management to thoroughly monitor all the managers’ activities (Milgrom
and Roberts, 1992). In this environment, a bank’s top management must decide how much authority to delegate to lower management levels and adopt an incentives scheme to induce managers to take actions that are aligned with the goals of senior management.
A typical problem of asymmetric information that permeates the relationship between top
management and production unit managers is the hidden action problem or moral hazard. In a moral hazard environment, senior management cannot control the actions of the managers of production units because those actions are not observable by upper management or by a third party. As a result, senior management cannot write an effective employment contract
based on the actions of production unit managers because the actions of such managers are not contractible (because they cannot be observed). This type of moral hazard raises a conflict of interest between senior management and production unit managers because the
decisions/actions of the latter affect bank earnings and other performance measures and cannot be controlled by the former (Laffont and Martimort, 2001, Chapter 4).
In this context, senior management must design an incentive scheme that induces production unit managers to take actions that maximize the profits and value of the bank. As the literature
on the delegation of activities and the design of optimal contracts under moral hazard indicates,1
senior management can solve this problem by offering unit managers a performance-based remuneration scheme in which better performance leads to higher remuneration. A fixed salary scheme offers unit managers no incentive to conduct their activities to maximize the
value and profits of the bank, whereas a performance-based remuneration scheme allows senior management to align unit managers’ interests with the bank’s.
One possible way to test whether there is a moral hazard in the relationship between
1
senior management and production unit managers is to estimate the relationship between the sensitivity of the unit managers’ remuneration to their own effective performance. The theory
of contracts and asymmetric information predicts that the higher the sensitivity of a manager’s remuneration to his own performance, the better his performance will be.
The aim of this study is to empirically investigate whether such a theoretical prediction identifies a causal relationship between employment contracts with variable remuneration for
performance and the effective performance of banking unit managers in Brazil. Jensen and Murphy (1990) estimate the relationship between performance and remuneration (including salary, options, bonuses and other) for the CEOs of publicly held companies in the United States. However, to the best of our knowledge, our study is the first to examine this empirical
question for Brazilian companies and is also the first to empirically study the presence of the moral hazard as the same relates to the design of contracts between senior management and branch managers in a banking organization.
To estimate such a causal relationship, we use the database of a large national retail bank
in Brazil for the period from January 2007 to June 2009. We chose this retail bank because it provides us with a unique dataset. The database contains information about the performance of each manager (including percentage-based performance evaluations with respect to their overall performance goals), the type of remuneration (labor contract) for each production unit
manager and the sensitivity of these different remuneration schemes to performance. This information is critical to investigate the subject matter of this article.
In particular, this bank utilizes two compensation schemes with respect to its production unit managers: (i) performance-based remuneration and (ii) "guaranteed variable salary". A
manager with performance-based remuneration has his monthly and yearly income pegged to the degree of his achievement of certain performance indicators. Conversely, a manager with a guaranteed variable salary contract has his remuneration guaranteed by the bank, and this
remuneration may be higher if the manager satisfies certain performance indicators. In practice, a manager subject to a guaranteed variable salary is remunerated by the bank regardless of the manager’s effective performance. As noted previously, this type of salary scheme does not induce managers to perform their activities to maximize bank value and profits. Therefore,
managers should not perform as well when they are subject to a guaranteed variable salary contract than when they are subject to an employment contract based on performance-based remuneration.
Using a fixed effects estimator for an unbalanced panel, we estimate the causal effect of
of the managers. Consistent with moral hazard theory, we find that managers subject to a guaranteed variable salary contract underperformed compared with managers subject to
performance-based remuneration and, consequently, that performance-based remuneration induces better manager performance. Therefore, we conclude that we cannot rule out the moral hazard problem for the behavior of managers subject to a guaranteed variable salary contract.
Although this work is grounded in previously consolidated concepts and theories, its academic relevance is related to the scarcity of empirical work in this area, particularly in Brazil and in the retail banking industry. From a practical perspective, there is evidence that guaranteed variable salary contracts do not promote an efficient allocation of bank resources
because such contracts induce lower levels of manager performance.
The remainder of this article is organized as follows. Section 2 describes the relevant contractual relationships between the bank’s senior management and the banking unit managers, details the target scheme and the direct incentives system and presents the existing methods
for monitoring and control. This section also presents the different types of remuneration (contracts) at the retail bank under study. In particular, we describe the performance-based remuneration scheme and the guaranteed variable salary scheme and explain how these different contractual employment schemes affect the incentives of unit managers. Section 3 presents a
theoretical discussion about the possible effects and describes the theoretical basis that supports the empirical work; its main focus is to present the essential ideas of the principal-agent model while describing the moral hazard problem and to highlight the role of monitoring and the incentive mechanisms at work. Section 4 provides a description of the data and the sample
selection from this large national retail bank during the period from January 2007 to June 2009. Section 5 presents the methodology and results, describes the econometric tools used and interprets the coefficients. Section 6 presents some robustness tests. Section 7 concludes
and provides final thoughts on this study. Graphs and tables are found in the Appendix.
2
The bank’s organizational profile: delegation of
activ-ities and types of remuneration
The purpose of this section is to present the organizational profile of the bank analyzed in
2.1
Organizational structure of the bank
The retail bank analyzed in this article is organized with headquarters where the bank’s main corporate strategies are formulated and banking units (branches and service centers) across
Brazil.
Top executives and senior management of the bank work at headquarters and are responsible for setting and approving major decisions and general business practices, for monitoring managers who are responsible for the banking units (agents), deciding how much authority
to delegate such lower-level managers and determining which incentives scheme to adopt to induce such agents to fulfill the objectives established by senior management. In particular, senior management is responsible for designing the system of goals and remuneration schemes for banking unit managers.
Bank branches and service centers are run by unit managers who are considered the highest in the hierarchy of each such bank branch or service center. The unit managers have powers that enable them to manage, coordinate and supervise each production unit, and they are accountable only to a Regional Director. The unit manager is responsible for:
1. Verifying compliance with each office’s operational goals and quality indicators through
the agency platform and/or reports forwarded by the administrative section of the bank;
2. Ensuring that the bank’s rules and procedures are met to monitor and discharge, if necessary, the operations performed by other managers;
3. Evaluating the operational relationship between customers and managers of the branch;
4. Guiding the team in various campaigns and the sale of products and services to focus, for example, on targets defined as annual strategies of the bank;
5. Developing, where necessary, programs for conquest, activation and customer retention and to monitor the branches’ indicators of productivity and quality, which may include, for example, proposing a methodology to leverage a manager’s customer relationships;
6. Monitoring each unit’s employees and warning and/or punishing them when there is a violation of the electronic punch clock;
7. Analyzing the performance of each unit’s employees and acting as the responsible party for management, feedback, hiring and firing in the production unit; and
8. Motivating and guiding the team to achieve the goals and priorities established by the
The agents are coordinated, monitored and controlled by means of a system of targets described below.
2.2
Incentive schemes and types of remuneration
Banking unit managers are subject to one of two types of remuneration: (i) performance-based remuneration or (ii) "guaranteed variable salary". A manager with performance-performance-based remuneration has his monthly and yearly income pegged to his degree of achievement of certain pre-determined performance indicators. A manager with a guaranteed variable salary contract
has his variable remuneration guaranteed by the bank, although this remuneration may be somewhat higher if the manager achieves certain performance indicators.
Performance-Based Remuneration The performance-based remuneration incentive scheme
is based on a system of goals established by the bank’s senior management. Formally, the goals system is established by the bank’s Department of Planning and Goals using an econometric model that considers both forward- and backward-looking factors.
The system of targets encompasses various indicators, including net fund-raising, growth of
the customer base by segment, insurance, liability products, asset products, cards and customer satisfaction. The achievement of these indicators is measured by dividing the effective value calculated for each item by the established target value. For example, the manager of Y unit from Z branch had a net fund raising target of 1,000 BRL for Period 1. At the end of this period,
the bank verified effective net funds raised of 900 BRL. The achievement of this indicator by the manager from Y unit in Z branch was 90% for Period 1. In addition to calculating each individual indicator, a global achievement score is also calculated as the weighted average of the various indicators. The weight of each indicator-and the inclusion/exclusion of other
indicators-is established semi-annually by aligning the goal system with the strategy established by senior management. Both the indicators and their weights in the global achievement score are identical for all the agents in each period.
Another indicator that is observed and controlled separately is the absolute value of the
adjusted gross margin of the production unit, i.e., revenue minus adjusted costs for the branch or service center. The criterion for the adjustment is identical for all the branches in each period. The system of goals described above and the absolute value of the adjusted gross margin forms the basis for the system of direct incentives, and unit managers are monitored
As a premise of this study, we assume that the bundle of information used to establish these goals is complete and that the goals arising from the application of this methodology
contain an error with zero mean and standard deviation. With these premises and considering that the same system is applied to all agents without exception, we can affirm that the goals do not contain a bias that might compromise their achievement by agents and, consequently, the analysis of the causal relationship that is the subject of this work.
The unit managers’ incentive system provides for the payment of variable remuneration based on the results achieved in two ways: monthly and biannually. In the first case, a percentage of the absolute value of the adjusted gross margin is paid monthly, subject to certain restrictions related to internal rules and procedures, current legislation and compliance.
In the second case, a value that depends on the overall achievement of the performance indicators established in the target system is distributed biannually. In recent years, the share of variable compensation based on the results corresponded to approximately 50% of the total annual remuneration of the unit managers.
All banking unit managers are subject to this type of contract except for those managers who were transferred from one bank unit to another and who are under the guaranteed variable salary regime for a period of 12 months.
Guaranteed Variable Salary All the bank unit managers who are transferred to another unit are subject to guaranteed variable salary scheme for a period of 12 months.2
This type of contract ensures that managers who are transferred from one unit to another have a total monthly variable compensation that is at least equal to the average achieved by
the manager in the last 12 months, regardless of performance. This variable salary is assured to the manager for 12 months after a transfer. Specifically, during the twelve-month period following the transfer, the manager of the unit does not share in the risk of poor performance and receives at a minimum the manager’s average for the past twelve months obtained from
the direct incentives system in the monthly and biannual programs. In practice, this scheme indicates that the premium for sharing the risk of the bank’s results is embedded in the total remuneration of the agent. It is worth noting that even with this guaranteed variable salary contract, all the other means of coordination, control and monitoring of the unit managers
described above remain unchanged.
The transfer of unit managers from one production unit to another is an important management tool and is widely used by senior management. Through this practice, the bank
2
seeks to supplement unit managers’ training by placing the managers in competition with one another, changing the external environment in a particular region or simply injecting
motivation and creativity into the unit managers and the teams involved in the changes. All the unit managers transferred from one branch to another are subject to this type of contract, and the criteria for transfer is solely in the bank’s discretion.
Thus, a manager with a guaranteed variable salary contract has the value of his variable
remuneration guaranteed by the bank, and this remuneration may be higher if the manager achieves his performance indicators. In practice, managers subject to a guaranteed variable salary have a variable remuneration paid by the Bank regardless of their actual performance. As discussed in the introduction, this type of salary scheme does not induce managers to
perform their obligations to maximize the value and profits of the bank.
In this study, we assume that bank unit managers construct their expectation of variable remuneration in t+ 1 on the basis of their variable compensation effective in t plus a few more random effects; thus, we can say that the implicit contract raises the value expected by
agents in t about their variable remuneration in t+ 1 because the likelihood of a downside is eliminated regardless of whether the transfer has made the possibility of upside less certain. Therefore, these managers will demonstrate worse performance when they are subject to a guaranteed variable salary contract than when they are subject to a performance-based salary
scheme.
3
Theoretical discussion of the possible effects
Agency theory is the conceptual basis for this work. The problem appears as we analyze how the top managers at a retail bank (principals) establish contractual rules (incentives)
that induce unit managers (agents) to act in top management’s interest. The relationship between principal and agent therefore moderates our discussion, particularly with respect to the problem that arises from the inability of one side to observe the actions of other: the moral hazard.
The concept of moral hazard, whose manifestation occurs in both the markets for goods and services-and inside organizations-originated in the insurance market, where it was observed that people with insurance have the tendency to change their behavior by becoming less careful with the insured object, which generates greater costs to the insurer. However, it is not possible
moral hazard is a type of post-contractual opportunism that arises because a party chooses to deviate from the hired object for its own benefit at the expense of the other party and because
these actions cannot be completely observable.
In the case of employment relationships in an organization, the moral hazard can be found when employees do not work or do not perform their duties properly. Milgrom & Roberts (1992 - pg 179) quoted Frederick Taylor, author of "The Principles of Scientific Management"
(1929), to introduce the theme of moral hazard in labor relations: "(...)Hardly the competent worker can be found who does not devote a considerable amount of time to studying just how slowly he can work and still convince his employer that he is going at a good pace."
Thus, the moral hazard is sufficiently inherent in the environment of firms that they devote
considerable resources to mitigating it. Two basic conditions are necessary for the moral hazard: potential divergence of interests and costly monitoring or unobservable activity.
Thus, it is appropriate to discuss the role of monitoring in this context. The main purpose of monitoring is to increase the probability that an agent will be detected when he is deviating
from the principal’s interests for his own benefit, which implies that actions of interest are monitored to generate evidence that a contract is or is not being followed properly. For monitoring to be effective, an organization must establish penalties or bonuses that are linked to observed actions of interest.
Employment contracts are frequently used in response to the moral hazard problem. Companies typically offer incentives or performance contracts with the objective of increasing the level of employee dedication and ensuring the alignment of the goals of employees with those of the company. Following Varian (2003, pg. 730), we present a simple, formal idea of
the incentive system.
1. Let xbe the amount of effort that a unit manager spends, and y=f(x) is the quantity produced. For simplicity, we normalize the price to 1 so that y also reflects the financial value of the product. Let s(y) be the wages paid by the retail bank fory units produced. The bank then tries to maximizey−s(y).
2. Assuming that the cost of exerting effortx in the productive process is c(x) for the unit manager, the manager attempts to maximize his utility, given by s(y)−c(x), subject
to the participation constraint. The latter stems from the fact that the unit manager is only willing to work at the bank if the utility that he obtains from this job is at least as great as the utility he could obtain elsewhere. Denoting the utility that the worker could obtain (given the alternatives) asu∗, the participation constraint is given
3. Thus, the firm seeks to maximize its profit given the restrictions of participation of the unit manager, i.e.,
maxx f(x)−s(f(x))
s.t. s(f(x))−c(x)≥u∗
4. The optimal x – x∗ – is found when the marginal product (M P(x)) is equal to the
marginal cost (M C(x)), which determines the level of the unit manager’s effort that upper management wants to achieve to maximize his objective function. The question
becomes how to induce the unit manager to choose the level of effortx∗ by appropriately
designing s(y). To this end, s(y) must satisfy the incentive compatibility constraint, namely:
s(f(x∗))−c(x∗)≥s(f(x))−c(x), for all x.
5. If the firm chooses to establish this incentive through a bonus - k -, the salary structure is given by:
s(x) = wx+k,
in which the wage ratewis equal to the marginal product of the unit manager at pointx∗,
i.e., M P(x∗). The constant k is chosen only to ensure that the participation constraint
is met. Thus, the problem of maximizing the unit manager has the following format:
max
x wx+k−c(x),
and w must also match the M C because the optimal choice is M P(x∗) = w=M C(x∗),
exactly as desired by the bank.
Because the effort x is typically not observable, the bank follows the actions of interest
through the result y. However, y may vary depending on factors that do not depend solely on the effort and performance of unit managers. Other factors that are not controllable by the company or the unit manager may influence y, including macroeconomic factors, health issues, family concerns, traffic, etc. This problem of uncertainty about y affects the motivation of
unit managers because it is a measure of the risk in the salary structure.
max
x wy(x) +k−c(x) = u
∗(E(y))
in which E(y) is the risk premium embedded in the incentive compatibility constraint of the manager.
Applying these theoretical results to the context of this article, when a bank unit manager
is transferred to another unit, the uncertainty regarding the result y increases, and therefore the risk premium increases, which alters the incentive compatibility constraint. To maintain the change, the bank increases k during the next twelve periods by incorporating the average
wy of the twelve prior periods intok. Under a guaranteed variable wage contract, wwill only
be optimal – M P(x∗) =w=M C(x∗) – whenE[(y)|x∗] is greater than the average of y from
the twelve periods prior to the contract’s execution.
As described in the previous section, we take as a premise that the agent builds the expected value for y for the 12 subsequent periods for a guaranteed variable wage contract based on
the value of y for the previous 12 periods plus a random effect. Thus,w is not optimal under a guaranteed variable salary contract. In the following sections, we empirically evaluate the behavior of agents under these conditions.
4
Description of the data and sample Selection
The data were obtained from a large retail bank with a presence throughout Brazil. This database contains information on the performance of each manager (measured as a percentage of the achievement of their goals for overall performance), the type of remuneration (labor contract) that the manager of each production unit is subject to and how these different
remuneration schemes are adjusted for managers’ performance.
The period of analysis begins in January 2007 and ends in June 2009. The observations are monthly, by operating unit (bank branch) and agent (manager). With certain restrictions, pre-2007 data were available for analysis; however, the application of the system of incentives
was significantly different before 2007, which precludes the use of these data in this study. Thus, the analysis is focused on the period between January 2007 and June 2009, capturing the effects of 5 semesters and 30 productive periods.
The observational unit of our sample is the manager, about whom there is information on
contains information for approximately 1,018 branches, of which 13 appear in only one year, 95 in two years and the vast majority, 910, are observed in all three years under study.
The employment contracts between the managers and the bank are for an indeterminate period; however, either party can opt for closure at any time without great expense, subject only to applicable Brazilian labor law. Thus, because of the rotation of unit managers, the unit manager sample is larger than the sample of branches, although there are cases in which
a manager simultaneously manages more than one branch. The sample consists of a total of 1,260 unit managers, with 207 appearing in only one year, 279 in two years, and the vast majority, 774, are observed in all three years under study. Therefore, we have an unbalanced panel.
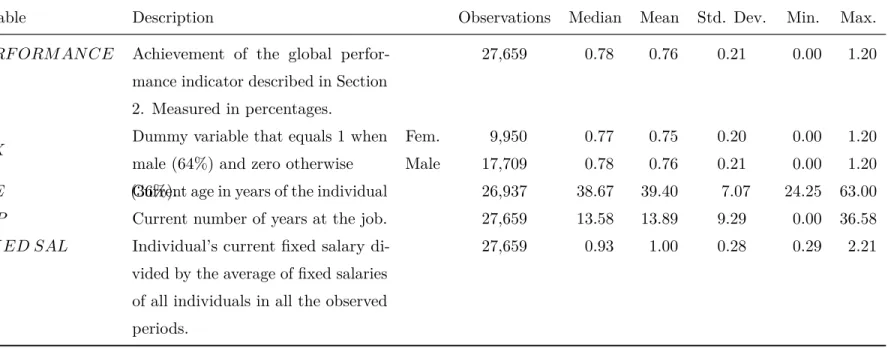
Because the purpose of this study is to identify and estimate a causal relationship between employment contracts with variable remuneration for performance and the effective performance of banking unit managers, two variables are crucial. The first of these is the performance of the unit manager that is represented by the level of achievement of the overall performance
indicator presented in Section 3 of this work. These observations are in percentages and range from 0% to 120%, which is the maximum value achieved by an agent during the 30 months observed. The descriptive statistics for this variable are listed in Table 1.
[Insert Table 1 here]
The other key variable is the type of contract that the manager is subject to. The variable
CON T RACT is a dummy that equals 1 when the person observed is subject to a guaranteed
variable salary contract, and zero otherwise. On average, 38% of the agents observed are subject to guaranteed variable salary contracts.
Certain observed individual control variables are added: gender, age, experience and fixed salary. Table 1 also describes how the control variables are represented and presents the median, mean, standard deviation and minimum and maximum values.
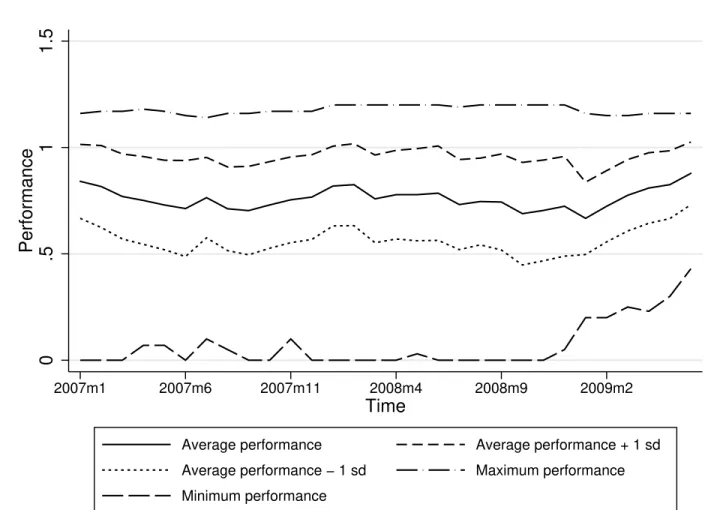
The control of a unit manager’s performance over time is measured by creating dummy
variables for year and month. Figure 1 shows the mean, standard deviation, and minimum and maximum performances of unit managers over the 30 months observed.
[Insert Figure 1 here]
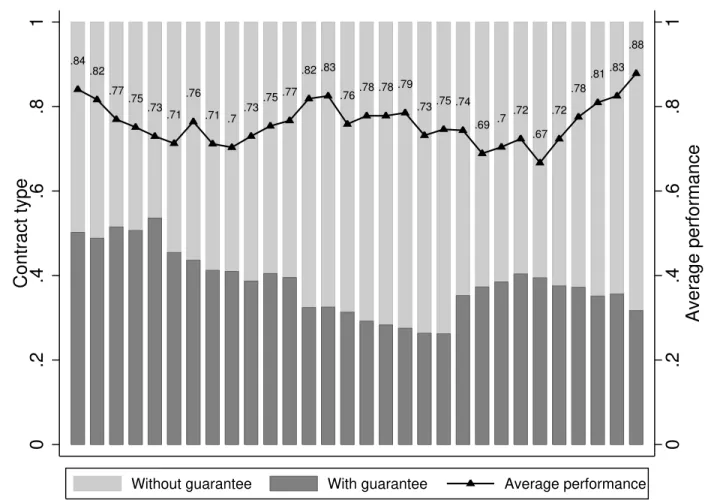
A variable identifying the agents subject to a guaranteed variable salary contract described
a manager is subject to a guaranteed variable salary contract. On average, 38% of the agents observed are subject to this type of contract over time.
Figure 2 shows the observed average performance goals over 30 months, the total number of observed unit managers and the fraction of those managers who were subject to guaranteed variable salary contracts.
[Insert Figure 2 here]
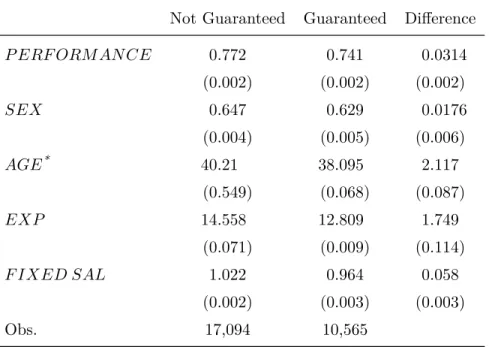
The average performance of the unit managers subject to a guaranteed variable salary contract is 0.741, which is 3.14 percentage points lower than the average unit manager not subject to this type of agreement. The minimum and maximum values of these groups are 0.0 and 1.2, respectively. Table 2 compares the groups with and without guaranteed variable
salary contracts and shows the differences between them:
[Insert Table 2 here]
Table 2 shows the differences among the groups with guaranteed variable salary contracts and variable salary contracts according to their performance. For all the variables, the hypothesis that the difference between the groups is zero is rejected.
The differences between the groups, mainly in the variable FIXED SAL, may be explained by recent acquisitions made by the bank in which these incorporated unit managers had higher fixed salaries than the average of the current group of managers.
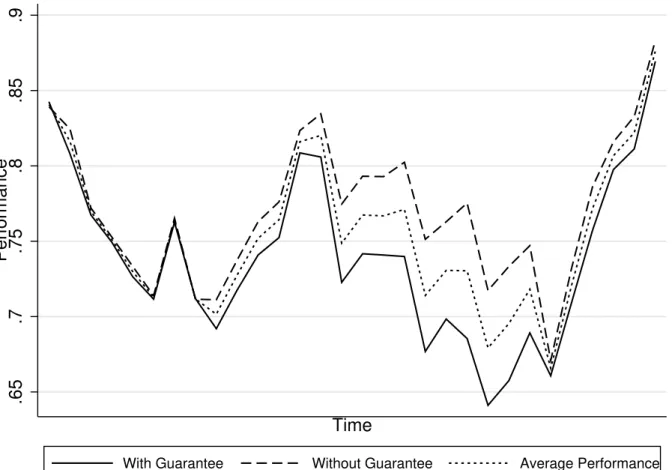
Figure 3 shows the average performance of the unit managers over time. The dotted line shows the average performance of all observations, the solid line shows the average performance of the unit managers subject to a guaranteed variable salary and the dashed line shows the average performance of the unit managers subject to performance-based pay. We note that
the solid line (with guarantee) is always below the dashed line.
[Insert Figure 3 here]
5
Methodology and results
To measure the causal effect of the guaranteed variable salary contract on unit manager performance, we first use a single cross section of the data and estimate the following equation
by OLS:
In the specification above, the parameter β0 is the constant, β1 captures the average effect
of having a guaranteed variable salary contract on performance and u is the random error. We
find a value of -0.031 for the coefficient of interest, β1, i.e., the unit manager’s performance
under a guaranteed variable salary contract is lower, on average, by 3.1 percentage points in relation to unit managers subject to performance-based remuneration. With a robust standard error of 0.003, the coefficient β1 is statistically significant at the 1% level. However,
the explanatory power of this model is weak, with an adjusted R2
of 0.01. The number of observations is 27,659.
We must be vigilant with respect to the fact that this estimator may contain an omission bias by disregarding important temporal information and information regarding the specific
features of the unit manager and the branch that might influence the variable of interest. It is important to remember that, as shown in Section 4, we reject the hypothesis that the difference between the groups with and without a guaranteed variable salary is statistically zero.
To circumvent this problem, we use a fixed effects estimator for unbalanced panel data
where the fixed effects for each unit manager and each branch are eliminated, thereby avoiding a likely omission bias resulting from omitting characteristics of the unit managers and the branches that are fixed over time. We also include the dummy variables of time (year and month) and other variables relevant to controlling unit managers presented above.
To this end, we estimate the equation below as a base model:
ln(P ERF ORM AN CE)iat=β0+β1CON T RACTiat+β2CARGGiat+
+δt+λa+νi+uiat,
in which the variable of interest is the natural log of P ERF ORM AN CEiat, described
in Section 4 for the unit manager i in branch a of period t; CON T RACTiat is described in
Section 4 and takes the value 1 if the unit manager i in branch a is subject to a "Guaranteed Variable Salary” contract in periodt; and CARGGiat contemplates several control variables
related to characteristics of unit manager iat branch aduring period t, as described in Section 4: GEN DERiat, EXPiat, EXP
2
iat, AGEiatandF IXED SALiat. δtis a time dummy (year and
month) and takes a value of 1 depending on the period of observation; the variables λa and νi
are dummies that capture the fixed effects of branch and the bank unit manager, respectively,
The parameter β1 captures the effect of a guaranteed variable salary contract on unit
managers’ performance. The results of the estimation of this parameter show, in percentage
points, how much the performance of unit managers subject to a guaranteed variable salary contract differs from the average performance of a manager subject to a performance-based contract.
To better analyze the results, we deploy the base model described above in 5 formats: Model 1 Takes into account manager characteristics and the
CON T RACT variable.
Model 2 In addition to the variables in Model 1, considers
a T IM E dummy for the year.
Model 3 In addition to the variables in Model 1, considers a T IM E dummy for the year and the month. Model 4 Considers all the variables from Model 3 and
in-cludes the fixed effects of the branch.
Model 5 Considers all of the variables from Model 3 and includes the fixed effects for both the unit manager and the branch.
The inclusion of the T IM E dummy variables (year) beginning in Model 2 and the T IM E dummy variables (year and month) from Model 3 onward aims to control for macroeconomic factors, i.e., to prevent macroeconomic movements from influencing the relationship between
the estimated performance of the unit manager and the existence of a guaranteed variable salary contract.
In Model 4, we introduce the fixed effects of the branch. This model is more robust from an econometric perspective because it controls for any possible bias caused by the omission of
characteristics of branches that are fixed over time. In Model 5, we add the fixed effects of the unit manager. In this model, we control for the specific features of the unit manager that are fixed over time.
Note that Model 5 is a differences-in-differences model in which the effect of the type of
remuneration on performance (parameter β1) is identified by comparing those managers who
changed their contracts over time with managers who have not changed their contracts over time.
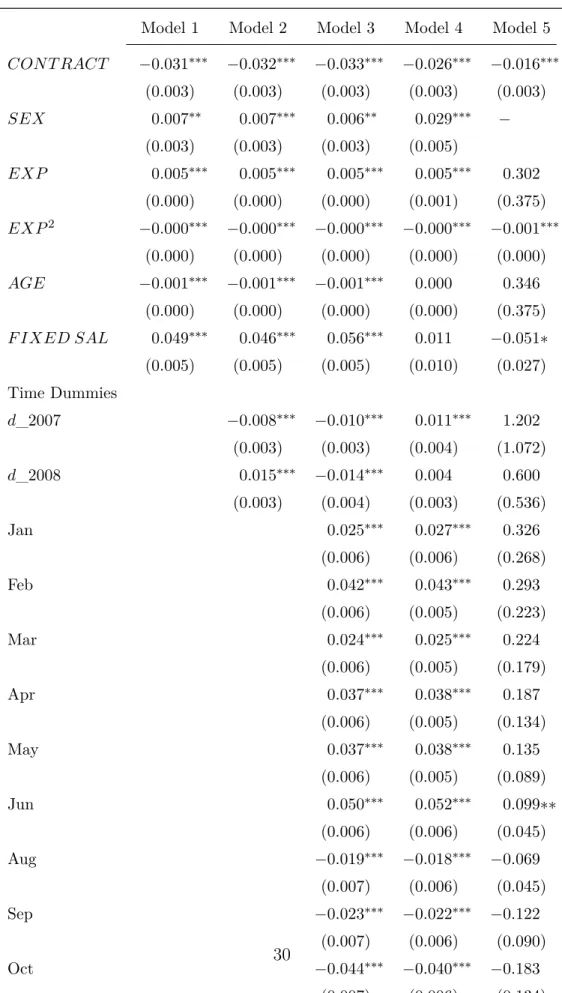
Table 3 presents the results of the regressions in the formats of the five models shown
above:
First, we note in Table 3 that the coefficient β1 is negative and statistically significant
in all the evaluated models. The results indicate that the performance of the unit manager
under a guaranteed variable salary contract is, depending on the model, between 3.3 and 1.6 percentage points lower than the performance of the unit managers subject to performance-based remuneration.
It is worth noting certain of the results for the unit manager control variables. The SEX
variable’s coefficient indicates that being a man results in superior performance of between 0.7 and 2.9 percentage points. The coefficients ofEXP andEXP2
corroborate the expectation of a positive sign and negative sign, respectively, which indicates decreasing marginal productivity as an individual’s experience increases.
The variableF IXED SAL confirms that as a unit manager’s fixed salary increases, the individual’s performance increases by a smaller proportion, i.e., an increase of 10% in the fixed salary of an individual results in an increase of approximately 1% in performance. It is notable that this variable loses statistical significance in the models controlled by fixed effects.
Analyzing the dummy variables for T IM E, we note that these variables are statistically significant in the models in which the fixed effects of the branch and the unit manager are missing. In Model 4, we introduce the fixed effects of the branch, and only the dummy variable T IM E d_2008 (equals 1 when year = 2008) loses statistical significance. However, in Model 5,
which includes the fixed effects of the unit managers, all the dummy variables for T IM E, for both year and month, lose statistical significance, which indicates that macroeconomic factors that were common to all the branches and individuals were no longer relevant to explain the performance of these managers when the performance is controlled by the specific features of
the unit manager and the branch that are fixed over time.
It is important to note that the degree of fit of the models evolves as we include more control variables, particularly when we include both fixed effects for the branches and for the
unit managers. The power of explanation goes from 0.01 in Model 1 to 0.16 in Model 5. Finally, we compare the results of the coefficient of interestβ1 between Model 4 (−0.026∗∗∗)
and Model 5 (−0.016∗∗∗). When we introduce the control by specific features of the unit
managers that are fixed over time, we find that the coefficient of interest has a variation of
greater than 1.0 percentage points. These results indicate that the behavior of unit manager (i) who is subject to a guaranteed variable salary contract is different from the behavior of the same unit manager i subject to a performance-based contract. This result indicates, in particular, that the moral hazard problem explains 1.6 percentage points of the performance
Model 5. Additionally, these results indicate that the behavior of two unit managers who are subject to the same guaranteed variable salary contract is different, which may indicate that
the problem of adverse selection explains 1.0 percentage points of the performance of unit managers who are subject to a guaranteed variable salary, i.e., the differential between the coefficients for β1 between Models 4 and 5.
6
Robustness Testing
The results from the previous section indicate that the performance of unit managers subject to performance compensation is superior to the performance of unit managers subject to a guaranteed variable salary contract. According to the theory described in Section 3, such an effect is triggered by the moral hazard in the relationship between senior management and
banking unit managers.
The estimate of the causal effect of the type of employment contract on the effective performance of managers can be biased if the manager’s performance is correlated with an unobserved feature of the manager (e.g., productivity), which in turn is correlated with the
remuneration contract allocated to that manager by senior management. In particular, if senior management decides to transfer managers who senior management expects will decline in productivity to other branches and, therefore, such managers receive remuneration through a guaranteed variable salary, then our estimate of the causal effect is overestimated. Those
managers with a tendency for declining productivity will likely demonstrate poor performance in the new unit to which they were transferred.
If the productivity of the managers is invariant through time, then the panel data estimator with manager fixed effects presented in the previous section in Model 5 fixes this problem and
therefore provides an unbiased estimate of the causal effect of the type of employment contract on managerial performance. It is notable that Model 5 estimates the relationship between the type of contract and manager performance while controlling for all the observable features of the manager, and it includes the fixed effects of both the branch and the manager. These
fixed effects can control for the time-invariant portion of productivity shocks.
However, if the productivity of managers varies over time, or if the productivity growth rate varies over time, then the fixed effect estimator from Model 5 may still be biased. In this case, we can only show that the Model 5 estimator is unbiased by trying to invalidate the
other possible explanations that might bias the estimator.
estimator in Model 5 biased: (i) allocation of different employment contracts by the productivity of managers and (ii) rules for hiring/firing of managers, contract allocation and productivity.
6.1
Allocation of contracts for senior management and managers’
productivity
Because the database in this article is observational and not experimental, the choice of the type of employment contract (guaranteed variable salary versus variable remuneration for performance) may be related to the productivity of the managers. As described above, if top
management decides to transfer managers who have a tendency toward declining productivity to other branches, which mean, therefore, that these managers are allocated a guaranteed variable salary contract, the fixed effects estimator might be biased. In this case, Model 5 will be overestimated if these managers demonstrate poor performance in their new unit in the
first 12 months, when they are subject to a guaranteed variable salary contract.
To check if there is evidence that senior management transfers managers who they expect to demonstrate declining productivity to other branches, we must investigate whether the probability of a manager receiving a guaranteed variable salary contract is positively related to
productivity and/or their performance at the bank. If there is evidence of such a relationship, then the fixed effect estimator of Model 5 may be biased.
To examine the relationship described above, we use a sub-sample of our database. This sub-sample contains information about all the managers who began their activities at the
bank (sample) under a variable remuneration for performance contract and stayed at the bank for more than one period. This sub-sample contains information about approximately 490 managers, 258 of whom had a pay-for-performance employment contract throughout the sample period, and 232 of whom began their activities at the bank with pay-for-performance
remuneration but later were subject to a guaranteed variable salary.
Using this sub-sample, we estimate the probability of a manager who entered the bank (sample) with a variable remuneration for performance contract to later go on to have a guaranteed variable salary contract in the future on the basis of their performance and their
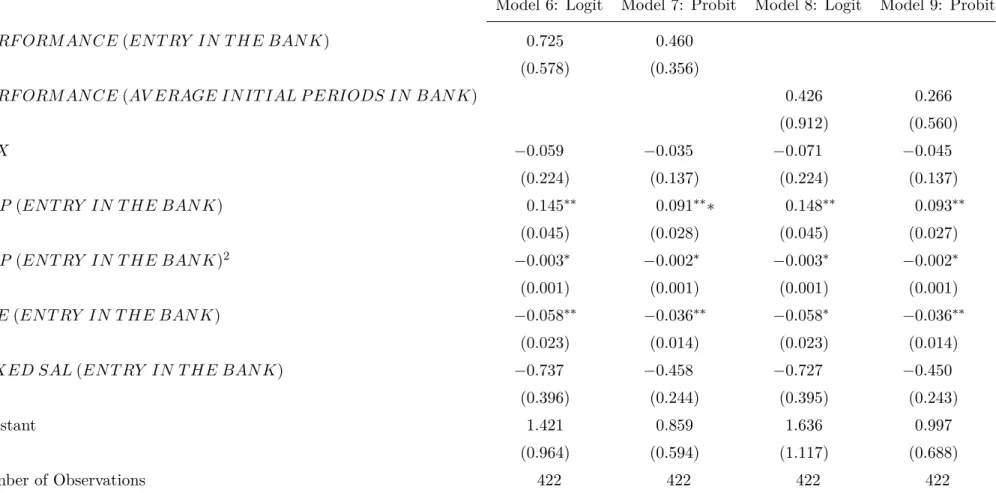
characteristics, such as gender, age, experience and fixed salary at the bank. Table 4 presents the results of these estimations.
[Insert Table 4 here]
Columns (1) and (2) of Table 4, Models 6 and 7, present the estimates of the impact of the
(EN T RY IN T HE BAN K), on the probability of the manager later having a guaranteed variable salary contract in the future using a probit and a logit model, respectively. In both
estimations, it can be observed that the performance of the manager does not seem to affect the manager’s chances of later having a guaranteed variable salary contract.
Columns (3) and (4) of Table 4, Models 8 and 9, present the estimates of the impact of the performance of the manager during the manager’s starting period at the bank while under a
variable remuneration for performance contract, measured by theP ERF ORM AN CE variable
(AV ERAGE IN IT IAL P ERIODS IN BAN K), on the probability of the manager later
having a guaranteed variable salary contract in the future using a probit and a logit model, respectively. Both estimations indicate that the performance of a manager does not seem to
affect the manager’s chances of having a guaranteed variable salary contract in the future. The estimates in Table 4 indicate that there is no evidence that senior management transfers underperforming managers to other branches, granting them a guaranteed variable salary contract. Thus, we have evidence that the estimation of the causal effect between guaranteed
variable salary contracts and the effective performance of the managers through a panel data fixed effect estimator, Model 5, is not biased.
6.2
Hiring/firing rule of managers, contract allocation and
produc-tivity
When managers’ productivity varies over time, another problem that can lead to bias of the Model 5 estimator derives from the fact that top management’s decisions to hire new managers and fire other managers can be made simultaneously with the allocation of contracts of employment and their inferences about managers’ productivity.
In particular, the Model 5 estimator is biased if senior management had an expectation for declining productivity (low performance) for those managers (sample) who were relocated to another branch subject to guaranteed variable salary contracts, and, concomitantly, those managers who left the sample had higher productivity and better performance.
In Section 6.1, we showed that there is no evidence that senior management transfers managers with low productivity to other branches. Therefore, we can only investigate whether the probability of leaving the bank is positively related to productivity and/or managers’ performance. If there is evidence of such a relationship, then the fixed effect estimator of
Model 5 may be biased.
(sample) as a function of the manager’s performance and his characteristics, such as gender, age, experience and fixed salary at the bank. Table 5 presents the results of these estimations.
[Insert Table 5 here]
Columns (1) and (2) of Table 5, Models 10 and 11, present estimates of the impact of a man-ager’s performance at the beginning of the sample, measured by P ERF ORM AN CE J AN07, on the probability of the manager leaving the bank using a logit model. Column (1) does
not control for contract type (guaranteed variable salary versus variable remuneration for performance), and Column (2) does control by contract type. Both estimations show that the performance of the manager does not seem to affect the manager’s chances of leaving the bank.
Columns (3) and (4) of Table 5, Models 12 and 13, estimate the impact of a manager’s
performance at the beginning of the sample, measured by the performance in January 2007, on the probability of the manager later leaving the bank using a probit model. Column (3) does not control by contract type (guaranteed variable salary versus variable remuneration for performance), and Column (4) does control by contract type. Both estimations show that the
performance of the manager does not seem to affect the manager’s chances of leaving the bank. The estimates in Table 5 indicate that there is no evidence that the probability of a manager leaving the bank is related to the manager’s productivity. Thus, we have evidence that the estimation of the causal effect by a panel data fixed effect estimator, Model 5, is not biased.
The Model 5 estimator would also be biased if managers who entered the bank (sample) had lower productivity (performance) and therefore were hired subject to a guaranteed variable salary contract.
To investigate this relationship, we estimate the probability of a manager being in the bank
(sample) in 2008 or 2009 as a function of the manager’s performance at the time of entry into the bank and the manager’s characteristics, such as gender, age, experience and fixed salary in the bank. Table 6 presents the results of these estimations.
[Insert Table 6 here]
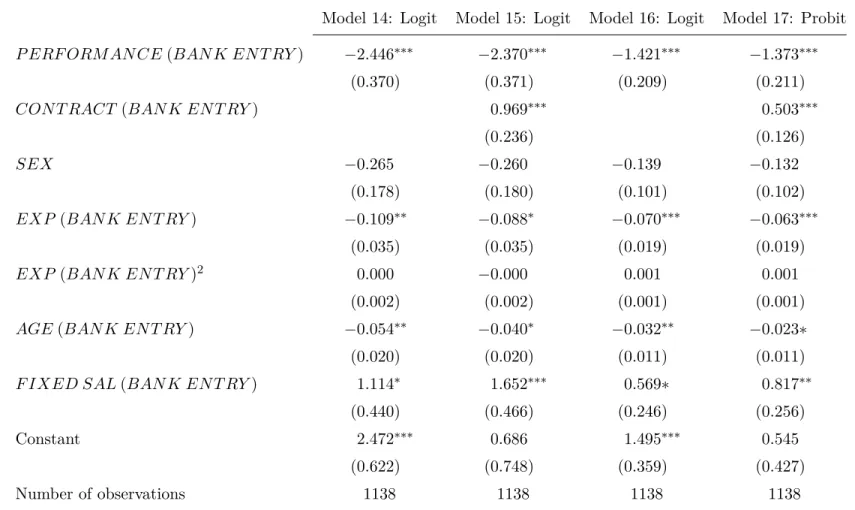
Columns (1) and (2) of Table 6, Models 14 and 15, present the estimates of the impact of the
manager’s performance at entry into the bank, as measured byP ERF ORM AN CE(BAN KEN T RY), on the manager’s probability of entry in 2008 or 2009 using a logit model. Column (1) does
not control by contract type (guaranteed variable salary versus variable remuneration for
Columns (3) and (4) of Table 6, Models 16 and 17, present the estimates of the impact of the
manager’s performance at entry into the bank, as measured byP ERF ORM AN CE(BAN KEN T RY),
on the manager’s probability of entry in 2008 or 2009 using a probit model. Column (3) does not control by contract type (guaranteed variable salary versus variable remuneration for performance), and Column (4) does control for contract type. As in Columns (1) and (2), Regressions (3) and (4) estimate that the managers entering the bank have, on average, worse
performance than other managers.
The estimates in Table 6 indicate that there is evidence that the probability of a manager entering the bank is negatively related to the manager’s productivity/performance. Thus, the panel data fixed effect estimator, Model 5, could be biased by the entry of new managers in
the sample.3
To address this problem, we run a new Model 5 estimation using only a sub-sample with balanced panel data. In this balanced panel subsample, only those managers who have been in the sample for the entire sample period (January 2007 to June 2009) are considered. Therefore,
all of the managers who entered the sample or left the bank during the period under analysis are excluded. This subsample contains 18,307 observations, which is 8,629 less than the sample used to estimate Model 5. Note that the fixed effects estimator with balanced data can provide us with an unbiased estimate of the parameter of interest once the potential bias caused by
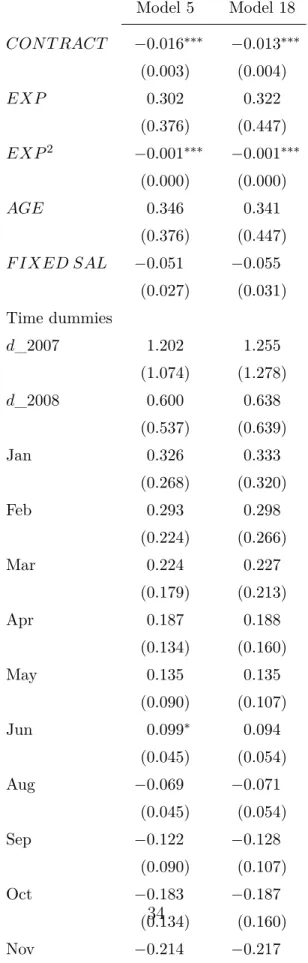
the entry of managers with worse performance (documented in Table 6) has been removed. Column (2) of Table 7, Model 18, presents the results of the estimation with balanced panel data and fixed effects. In particular, Model 18 indicates that the estimated coefficient parameter of interest β1 is (−0.013∗∗∗), which is statistically significant at the 1% level. This result
indicates that the problem of moral hazard explains 1.3 percentage points of the performance of unit managers who are subject to a guaranteed variable salary.
[Insert Table 7 here]
Finally, it is worth comparing the results of the coefficients for Models 5 and 18. The
coefficients of interest, β1, for Models 5 and 18 are (−0.016∗∗∗) and (−0.013∗∗∗), respectively.
This result indicates that the estimated coefficients in Models 5 and 18 have the same sign and the same order of magnitude and are statistically significant at the 1% level. Therefore, the
3
potential bias caused by the entry of managers with poor productivity at the bank (sample) does not seem to have a significant effect in the estimation of the causal effect between employment
contracts with variable remuneration for performance and the effective performance of the managers in Model 5. Note also that the other regression coefficients in Models 5 and 18 also have the same sign, the same order of magnitude and the same degree of significance.
7
Conclusions and final remarks
The aim of this study is to evaluate the causal relationship between a guaranteed variable salary contract and the performance of unit managers of a retail bank in Brazil. Thus, this study investigates how the application of this type of contract, which represents a substantial change in the direct incentive system of agents, affects the performance of these unit managers.
We empirically analyze data from a large national retail bank with a fixed effects estimator for panel data and the results (described in Section 5) indicate that the performance of the unit managers subject to guaranteed variable salary contracts is inferior to the performance of unit managers subject to performance-based remuneration schemes.
Although the behavior of agents subject to a guaranteed variable salary contract is also influenced by the current monitoring and control scheme and the condition of repeated games with an appeal to the growth of these agents within the organization, the findings corroborate current economic theory and existence of the moral hazard. The results show that after
controlling for unit managers’ characteristics that are fixed over time, the performance of unit managers subject to guaranteed variable salary contracts is, on average, 1.6 percentage points lower than unit managers subject to performance-based remuneration; therefore, we cannot rule out the problem of the moral hazard in the behavior of these unit managers.
The results hold up based on making an assumption about an important premise: the information about the performance of the bank unit managers represents a complete information bundle with zero mean and standard deviation. This premise should not be considered a problem in determining how a guaranteed variable salary contract affects the performance of a
unit manager because the sample analyzed has approximately 27,000 observations; however, consistency with this premise might be a limitation on the claims of this work in determining how the application of a guaranteed variable salary contract impacts agent performance and to quantify this impact.
practical relevance of the study. By failing to assess the materiality of the coefficients found, we cannot scale the impact of the existence of a guaranteed variable salary contract on the
operation of the retail bank. Regardless of the limitations described above, is a difference of 2.6 percentage points in the performance of unit managers subject to guaranteed variable salary contracts relevant to the operation of a large retail bank?
Due to access restrictions related to the confidential information of the bank under study,
the practical conclusion is limited to the authors’ perspective. However, over the 30 observed periods, 38% of the unit managers were subject to this type contract, and the performance of these managers is, on average, between 1.6 and 2.6 percentage points lower than the unit managers who were subject to performance-based remuneration. Thus, there is evidence that
a guaranteed variable salary contract does not promote an efficient allocation of resources at the bank because it induces worse performance by the managers.
However, the absence of information/data on the wages effectively paid to each unit manager-either through the guaranteed variable salary scheme or the pay-for-performance
scheme-does not allow us to measure the costs to the bank from these different wage policies. As the literature on executive compensation design and optimal contracts under moral hazards highlights (Tirole, 2006, Chapter 2), choosing between option-type salaries (as in the case of a guaranteed variable salary) and salaries with performance-based variable pay involves a
trade-off between risk premium and efficiency. On the one hand, performance-based variable compensation induces better performance by the managers, but on the other hand, such wages are expected to be higher than the salary paid to the same manager on an option-type of salary scheme to compensate for the risk/uncertainty associated with the wages. In theory, a
manager’s degree of risk aversion should determine the bank’s optimal wage policy: salary versus an option-type of variable salary based on performance.
As a final consideration, we highlight the items that were not within the scope of this work
References
Barbosa, Fabio, 2009,O Setor Bancŕio em Números, Ciab Febraban, Transamerica Expocenter, pp.1-17.
Milgrom, Paul Robert and Roberts, John, 1992, Economics, Organization and Management,
Prentice-Hall Englewood Cliffs, NJ.
Laffont, Jean-Jacques and Martimort, David, 2001, The Theory of Incentives: The
Principal-Agent Model, Princeton University Press.
Tirole, Jean, 2006, The Theory of Corporate Finance, Princeton University Press.
Jensen, Michael C and Murphy, Kevin J, 1990, Performance Pay and Top-Management
Incentives, The Journal of Political Economy, 98(2),225-264.
8
Appendix
A. Figures
0
.5
1
1.5
Performance
2007m1 2007m6 2007m11 2008m4 2008m9 2009m2
Time
Average performance Average performance + 1 sd
Average performance − 1 sd Maximum performance
Minimum performance
.84 .82
.77 .75
.73 .71
.76
.71 .7 .73 .75.77
.82 .83
.76.78 .78 .79
.73.75 .74 .69 .7
.72 .67
.72 .78
.81.83 .88
0
.2
.4
.6
.8
1
Average performance
.2
.4
.6
.8
1
0
Contract type
Without guarantee With guarantee Average performance
.65
.7
.75
.8
.85
.9
Performance
Time
With Guarantee Without Guarantee Average Performance
Table 1: Descriptive Statistics
Variable Description Observations Median Mean Std. Dev. Min. Max.
P ERF ORM AN CE Achievement of the global
perfor-mance indicator described in Section
2. Measured in percentages.
27,659 0.78 0.76 0.21 0.00 1.20
SEX Dummy variable that equals 1 when
male (64%) and zero otherwise
(36%).
Fem. 9,950 0.77 0.75 0.20 0.00 1.20
Male 17,709 0.78 0.76 0.21 0.00 1.20
AGE Current age in years of the individual 26,937 38.67 39.40 7.07 24.25 63.00
EX P Current number of years at the job. 27,659 13.58 13.89 9.29 0.00 36.58
F I X ED SAL Individual’s current fixed salary
di-vided by the average of fixed salaries
of all individuals in all the observed
periods.
27,659 0.93 1.00 0.28 0.29 2.21
Table 2: Difference between groups with guaranteed salary and variable salary according to performance
Not Guaranteed Guaranteed Difference
P ERF ORM AN CE 0.772 0.741 0.0314
(0.002) (0.002) (0.002)
SEX 0.647 0.629 0.0176
(0.004) (0.005) (0.006)
AGE* 40.21 38.095 2.117
(0.549) (0.068) (0.087)
EX P 14.558 12.809 1.749
(0.071) (0.009) (0.114)
F I X ED SAL 1.022 0.964 0.058
(0.002) (0.003) (0.003)
Obs. 17,094 10,565
*Number of observations: 16,657 and 10,280, respectively.
Table 3: Regressions for Models 1 through 5. Dependent variable: ln(P ERF ORM AN CE).
Variable of interest: P ERF ORM AN CE.
Model 1 Model 2 Model 3 Model 4 Model 5
CON T RACT −0.031∗∗∗ −0.032∗∗∗ −0.033∗∗∗ −0.026∗∗∗ −0.016∗∗∗ (0.003) (0.003) (0.003) (0.003) (0.003)
SEX 0.007∗∗ 0.007∗∗∗ 0.006∗∗ 0.029∗∗∗ − (0.003) (0.003) (0.003) (0.005)
EX P 0.005∗∗∗ 0.005∗∗∗ 0.005∗∗∗ 0.005∗∗∗ 0.302
(0.000) (0.000) (0.000) (0.001) (0.375)
EX P2
−0.000∗∗∗ −0.000∗∗∗ −0.000∗∗∗ −0.000∗∗∗ −0.001∗∗∗ (0.000) (0.000) (0.000) (0.000) (0.000)
AGE −0.001∗∗∗ −0.001∗∗∗ −0.001∗∗∗ 0.000 0.346 (0.000) (0.000) (0.000) (0.000) (0.375)
F I X ED SAL 0.049∗∗∗ 0.046∗∗∗ 0.056∗∗∗ 0.011 −0.051∗ (0.005) (0.005) (0.005) (0.010) (0.027)
Time Dummies
d_2007 −0.008∗∗∗ −0.010∗∗∗ 0.011∗∗∗ 1.202 (0.003) (0.003) (0.004) (1.072)
d_2008 0.015∗∗∗ −0.014∗∗∗ 0.004 0.600 (0.003) (0.004) (0.003) (0.536)
Jan 0.025∗∗∗ 0.027∗∗∗ 0.326
(0.006) (0.006) (0.268)
Feb 0.042∗∗∗ 0.043∗∗∗ 0.293
(0.006) (0.005) (0.223)
Mar 0.024∗∗∗ 0.025∗∗∗ 0.224
(0.006) (0.005) (0.179)
Apr 0.037∗∗∗ 0.038∗∗∗ 0.187
(0.006) (0.005) (0.134)
May 0.037∗∗∗ 0.038∗∗∗ 0.135
(0.006) (0.005) (0.089)
Jun 0.050∗∗∗ 0.052∗∗∗ 0.099∗∗
(0.006) (0.006) (0.045)
Aug −0.019∗∗∗ −0.018∗∗∗ −0.069
(0.007) (0.006) (0.045)
Sep −0.023∗∗∗ −0.022∗∗∗ −0.122
(0.007) (0.006) (0.090)
Oct −0.044∗∗∗ −0.040∗∗∗ −0.183
(0.007) (0.006) (0.134)
Table 4: Determinants for a manager to have a “Guaranteed Variable Salary” contract in the future.
Dependent Variable: Probability(Manager has a “Guaranteed Variable Salary” contract in the future |Manager has a “Performance-based Variable Salary”)
Model 6: Logit Model 7: Probit Model 8: Logit Model 9: Probit
P ERF ORM AN CE(EN T RY I N T H E BAN K) 0.725 0.460
(0.578) (0.356)
P ERF ORM AN CE(AV ERAGE I N I T I AL P ERI ODS I N BAN K) 0.426 0.266
(0.912) (0.560)
SEX −0.059 −0.035 −0.071 −0.045
(0.224) (0.137) (0.224) (0.137)
EX P (EN T RY I N T H E BAN K) 0.145∗∗ 0.091∗∗∗ 0.148∗∗ 0.093∗∗
(0.045) (0.028) (0.045) (0.027)
EX P (EN T RY I N T H E BAN K)2
−0.003∗ −0.002∗ −0.003∗ −0.002∗
(0.001) (0.001) (0.001) (0.001)
AGE(EN T RY I N T H E BAN K) −0.058∗∗ −0.036∗∗ −0.058∗ −0.036∗∗
(0.023) (0.014) (0.023) (0.014)
F I X ED SAL(EN T RY I N T H E BAN K) −0.737 −0.458 −0.727 −0.450
(0.396) (0.244) (0.395) (0.243)
Constant 1.421 0.859 1.636 0.997
(0.964) (0.594) (1.117) (0.688)
Number of Observations 422 422 422 422
∗;∗∗;∗∗∗ denote statistically significant at 10%, 5% and 1% levels, respectively. Robust standard errors in parentheses.