www.epjournal.net – 2009. 7(2): 264-279
¯ ¯ ¯ ¯ ¯ ¯ ¯ ¯ ¯ ¯ ¯ ¯ ¯ ¯ ¯ ¯ ¯ ¯ ¯ ¯ ¯ ¯ ¯ ¯ ¯ ¯ ¯ ¯
Original Article
On the Real Magnitude of Psychological Sex Differences
Marco Del Giudice, Center for Cognitive Science – Department of Psychology, University of Turin, Torino, Italy. Email: marco.delgiudice@unito.it
Abstract: A comprehensive evolutionary theory of sex differences will benefit from an accurate assessment of their magnitude across different psychological domains. This article shows that mainstream research has severely underestimated the magnitude of psychological sex differences; the reason lies in the common practice of measuring multidimensional differences one dimension at a time, without integrating them into a proper multivariate effect size (ES). Employing the Mahalanobis distance D (the multivariate generalization of Cohen’s d) results in more accurate, and predictably larger, estimates of overall sex differences in multidimensional constructs. Two real-world examples are presented: (1) In a published dataset on Big Five personality traits, sex differences on individual scales averaged d = .27, a typical ES conventionally regarded as “small.” However, the overall difference was D = .84 (disattenuated D = .98), implying considerable statistical separation between male and female distributions. (2) In a recent meta-analytic summary of sex differences in aggression, the individual ESs averaged d = .34. However, the overall difference was estimated at D = .75 – .80 (disattenuated D = .89 – 1.01). In many psychological domains, sex differences may be substantially larger than previously acknowledged.
Keywords: sex differences, gender, effect size, multivariate, Mahalanobis distance. ¯ ¯ ¯ ¯ ¯ ¯ ¯ ¯ ¯ ¯ ¯ ¯ ¯ ¯ ¯ ¯ ¯ ¯ ¯ ¯ ¯ ¯ ¯ ¯ ¯ ¯ ¯ ¯ ¯ ¯ ¯ ¯ ¯ ¯ ¯ ¯ ¯ ¯ ¯ ¯ ¯ ¯ ¯ ¯ ¯ ¯ ¯ ¯ ¯ ¯ ¯ ¯ ¯ ¯ ¯ ¯ ¯ ¯ ¯ ¯ ¯ ¯ ¯ ¯ ¯ ¯ ¯ ¯ ¯ ¯ ¯ ¯ ¯ ¯ ¯ ¯ ¯ ¯ ¯ ¯ ¯ ¯ ¯ ¯ ¯ ¯ ¯ ¯ Introduction
self-Evolutionary Psychology – ISSN 1474-7049 – Volume 7(2). 2009. -265-disclosure (d = .18; Dindia and Allen, 1992), self-esteem (d = .21; Kling, Hyde, Showers, and Buswell, 1999), personality (d = .10 to .50; Costa, Terracciano and McCrae, 2001), aggression (overall d = .24; Bettencourt and Miller, 1996), and the list could go on. Hyde (2005) conducted a second order analysis of sex differences on 128 published meta-analyses, and found that 78% of all the effect sizes fell below a standardized mean difference of d = .35, which is conventionally regarded as “small to moderate”. In terms of statistical overlap, d = .35 means that—assuming normality—the male and female distributions share about 75% of their joint area (Cohen, 1988). Hyde used this result in support of the “gender similarities hypothesis”, i.e., that males and females are similar rather than different on most psychological variables. While Hyde’s analysis has been criticized for omitting some large-effect studies and for not organizing variables in biologically relevant categories (Davies and Shackelford, 2006; Lippa, 2006), it is true that the effects reported in the empirical research often seem to imply little statistical separation between male and female distributions.
Is this a valid assessment of the data? And most importantly, should we care? I surmise that, if we want to build a comprehensive evolutionary theory of sex differences, we need to proceed in two directions at once: On one hand, we should aim to build more detailed models, develop finer distinctions between functionally distinct subtypes of traits and behaviors, and identify the specific contexts in which sex differences are magnified or reduced. On the other hand, we should try to measure the global patterns of sex differences in different areas of human psychology, and use the quantitative information carried by effect sizes to better understand the selective processes that have shaped our male and female minds. In addition, comparing the magnitude of effect sizes across different psychological domains may provide useful support in the evaluation of competing explanatory hypotheses on the origin and function of mental and behavioral traits (see below).
In the present article I will argue that mainstream research has severely underestimated the magnitude of human sex differences by failing to fully appreciate the multidimensional nature of many psychological constructs. I will then show how to address this shortcoming by calculating multivariate indices of effect size (ES). In particular, I will introduce the multivariate generalization of Cohen’s d: the Mahalanobis distance D, a standardized mean difference calculated simultaneously on k correlated variables. Finally, I will illustrate the practical import of multivariate ESs with two reanalyses of published datasets on sex differences in personality and aggression.
The interpretation of effect sizes
Evolutionary Psychology – ISSN 1474-7049 – Volume 7(2). 2009. -266-of an effect size without considering the theoretical relationship between variables, their measurement error, an the context in which they are measured and analyzed (see e.g., Breaugh, 2003; Burchinal, 2008; Hill, Bloom, Black and Lipsey, 2008). In some contexts, a statistically small deviation from a set value may have important consequences (think of the rigidly controlled mechanisms that regulate body temperature), while in others even “large” differences may be inconsequential or comparatively small (e.g., a drug reducing depressive symptoms by d = .80, when all other drugs on the market reduce them by d = 2 or more).
The practical significance of a difference between means also depends on where one is looking: differences that have almost undetectable effects in the central region of a distribution can be amplified by orders of magnitude as one moves toward the distribution extremes. For example, even if males (on average) were only slightly superior to females in their visuo-spatial abilities, the male:female ratio would increase dramatically when considering people with extremely high levels of the same abilities. Whereas such a small difference might have virtually no consequence in most aspects of everyday life, it could still determine large sex biases in specialized contexts where high visuo-spatial abilities are required (e.g., skilled hunting in traditional societies). This distribution-tail effect is often compounded by the larger variance exhibited by males in many psychological traits, perhaps especially in those with a history of strong sexual selection (Archer and Mehdikhani, 2003; see also Halpern et al., 2007). Finally, division-of-labor social and interpersonal processes may amplify initially small psychological sex differences, ending up in large differences in the actual behavior of the two sexes (e.g., Becker, 1991).
Effect sizes and the evolutionary psychology of sex differences
Evolutionary theory provides reasons to expect reliable sex differences in personality, cognition, and behavior (see Buss, 2004; Geary, 1998), and evolutionary psychological research has often focused on the adaptive value of male-female differences (e.g., Buss and Schmitt, 1993; Del Giudice, 2009; Schmitt, 2005; Schmitt et al., 2003; Silverman and Eals, 1992). Although current models are still too coarse to make quantitative predictions about the absolute magnitude of sex differences, it is already possible to generate several predictions on their relative magnitude in different traits or constructs. First of all, the strongest psychological sex differences are expected – and found – in reproduction-related traits and in those subject to divergent sexual selection pressures (Buss, 1995, 2004; Davies and Shackelford, 2006); for example, in the literature on mate preferences ESs are often in the d = .80 – 1.50 range (Buss, 1995), higher that those found in most other psychological domains. Careful application of sexual selection theory suggests additional, subtler predictions: As discussed by Miller (2000), sex differences in a sexually selected trait are likely to be small (or even nonexistent) if (1) the trait is subject to reciprocal mate choice, or (2) both sexes need to possess the same psychological machinery, in order for members of one sex to evaluate the quality of the trait when it is expressed by members of the other sex.
Evolutionary Psychology – ISSN 1474-7049 – Volume 7(2). 2009. -267-predict increased numbers of sexual partners (Miller and Tal, 2007; Nettle, 2005), and males might be expected to show higher average levels of these traits in many (but not all) ecological contexts (see Gangestad, Haselton and Buss, 2006; Gangestad and Simpson, 2000; Schmitt, 2008). Similarly, sex differences in visuo-spatial abilities may have been indirectly shaped by sexual selection because of the involvement of these abilities in sex-typical activities that contributed to mating success, such as hunting (Silverman and Eals, 1992). Effect sizes can be used to compare the magnitude of sex differences among different psychological constructs and, potentially, to adjudicate between alternative explanations of their evolution (e.g., a model involving reciprocal mate choice versus one positing divergent sexual selection pressures). Depending on the level of analysis, effect size comparisons can involve narrow traits such as extraversion or physical aggression, as well as complex multidimensional constructs such as mate preferences or personality.
Multidimensional effect sizes can also be useful when evaluating the magnitude of sex differences across different social and ecological contexts. For example, there is evidence that sex differences in personality traits vary among cultures (Costa et al., 2001); however, this may or may not translate in a change in the overall statistical overlap between male and female personality profiles, since different combinations of univariate sex differences may result in the same overall ES. The study of ecological variation in the overall patterns of sex similarity/difference has fascinating evolutionary implications; in this context, multivariate indices can be a valuable addition to standard univariate measures, and can be employed in cross-cultural studies to explore variation at a level higher than that of individual variables.
Another potential application of multivariate effect sizes is in the study of the folk psychology of sex differences. Are people’s perceptions of sex differences basically accurate, or are they prone to distortion by socially transmitted stereotypes? To begin answering this question, one has to know how large sex differences are in the first place; and the case can be made that overall, multidimensional sex differences (for example in personality or aggression) may be a more natural and intuitive metric than differences in the narrowly specified, individual traits measured by psychologists. It is then possible that what appear as inflated stereotypes (Hyde, 2005) might actually turn out to be realistic and accurate representations of the overall statistical distance between male and female profiles. Such findings would be highly relevant to the evolutionary study of social cognition, folk psychology, and social learning.
Evolutionary Psychology – ISSN 1474-7049 – Volume 7(2). 2009.
-268-The logic of multivariate differences
As stated in the introduction, the standard approach to the evaluation of sex differences dramatically underestimates their overall magnitude when dealing with multidimensional psychological constructs. The common procedure employed in meta-analyses of sex differences goes as follows: (1) sex differences are measured on a set of variables making up an integrated, multidimensional construct (e.g. the Big Five personality factors, multiple measures of aggression, or a battery of visuo-spatial tasks); (2) sex differences on these variables are not combined into a multivariate effect size, but considered only one at a time; and (3) an average measure of the univariate effect sizes is taken, and is then treated as an estimate of the overall sex difference in the investigated construct.
Why is this procedure inadequate? When measuring a multidimensional construct, the overall difference between two groups is not the average of the effects measured on each dimension, but a combination of those effects in the multidimensional space: Many small differences, each of them on a different dimension, can create an impressive effect when all the dimensions are considered simultaneously. Crucially, such overall differences are likely to matter more than their individual components, both in shaping people’s perceptions and in affecting social interaction. A geometric example may help at this point (Figure 1): Consider a cube with edges of length 1, where the three dimensions correspond to three uncorrelated personality traits (labeled A, B and C), and make vertex M the position of the male group on the three traits. Now imagine that vertex F represents the means of females on the same three traits, so that the female mean on each trait is equal to the male mean plus one. The average sex difference on the three traits is, of course, equal to one; however, the length of segment MF(i.e., the actual distance between males and females in this three-dimensional space) is the square root of 3, that is, MF ≅ 1.73. Failing
Evolutionary Psychology – ISSN 1474-7049 – Volume 7(2). 2009. -269-Figure 1. Geometric illustration of the difference between univariate and multivariate distances.
Note: The cube represents a hypothetical three-factor personality space with orthogonal factors.
A multivariate effect size: The Mahalanobis distance
The Mahalanobis distance D (Mahalanobis, 1936) is a generalized distance metric calculated on two or more correlated variables. Like the popular Cohen’s d, it is a standardized distance, i.e., distances are expressed in terms of the standard deviation of the measured variables. Let there be a set of k variables, and let d be a column vector of length
k whose elements are the between-group differences on each variable; D is given by
d S d' −1 =
D (1)
where S is the covariance matrix of the k variables. If d is a vector of standardized differences (i.e., Cohen’s d’s), then S is the correlation matrix. If the variables are orthogonal, D reduces to the euclidean distance between groups; if k = 1, D reduces to Cohen’s d. In addition to estimating between-group distances, D can be used to measure the distance between two cases or between a group and a case; in this last form, it is often employed to detect outlier cases (see Huberty, 2005 for an introduction; De Maesschalck, Jouan-Rimbaud and Massart, 2000 for a more technical treatment). The Mahalanobis distance is closely related to Hotelling’s t2, a common multivariate statistic for two-group comparison.
The interpretation of D is straightforward, as it represents the difference between two groups in terms of the standard deviation of the multivariate distribution. Thus, the interpretation of its magnitude is the same as that of Cohen’s d; for example, if D = 1, the two groups are one (multivariate) standard deviation apart. When the k variables are correlated, the standard deviation can be represented by an ellipsoid; D refers to the standard deviation in the direction given by the two group centroids. Figure 2 illustrates the effect of correlations on D in the case of two variables. The main difference between d and
Evolutionary Psychology – ISSN 1474-7049 – Volume 7(2). 2009. -270-groups, one has to refer to univariate d values; thus, univariate and multivariate ESs should be seen as complementary rather than alternative tools.
Figure 2. The effect of correlations on the magnitude of D, illustrated in the bivariate case.
Note: Small circles indicate group means on the two variables (group centroids); the standard deviations of the bivariate normal distributions are shown as ellipses. Panel A shows two orthogonal variables: the standard deviation is the same in all directions (ellipses reduce to circles), and D reduces to the euclidean distance, D = .72 (grey line). In panels B and C the two variables are correlated (r = +.5 and r = −.5, respectively); whereas
univariate differences between means (d) are the same in the three cases, D becomes larger in panel B (about one standard deviation) and smaller in panel C. Notice that larger D’s correspond to smaller overlap between distributions, that is, higher statistical separation between the two groups.
As with Cohen’s d, Mahalanobis D can be translated into approximate measures of statistical overlap by assuming multivariate normality. The overlapping coefficient OVL
represents the proportion of each distribution that is shared with the other distribution, and is given by
OVL=2Φ −
(
D/2)
(2)where Φ ⋅
()
is the CDF of the standard normal distribution (Bradley, 2006; Reiser, 2001). The OVL coefficient can be easily converted to Cohen’s index of nonoverlap U1; whereasOVL is calculated on a single group, U1 is calculated on the joint distribution of the two
groups:
⎟ ⎠ ⎞ ⎜
⎝ ⎛
− − =
OVL OVL U
2 1
1 . (3)
For consistency with the psychological literature (e.g., Hyde, 2005), in the present article I will always report (1 − U1) as an index of overlap. If desired, exact confidence
Evolutionary Psychology – ISSN 1474-7049 – Volume 7(2). 2009. -271-http://www.psych.unito.it/csc/pers/delgiudice/pdf/mahalanobis.zip .
When applied to k correlated variables making up a multidimensional construct, the Mahalanobis distance D is almost invariably larger than any of the corresponding univariate d’s, and will thus give a larger effect size (ES) estimate than simply taking an average value of d. The only exception occurs when the variables are perfectly correlated (i.e., when the construct is in fact unidimensional).
A simple calculation will help the reader get an intuitive feeling of the expected increase in effect size when computing the D index instead of relying solely on univariate
d’s. Imagine that a researcher was investigating sex differences in aggression, and that he/she had measured a number of different aggression-related variables. Also imagine that those variables were completely uncorrelated with one another, and that the standardized sex difference was exactly the same on all the variables, a conventionally “small” d = .25. In this case, the size of Mahalanobis D only depends on k, the number of variables measured by the researcher. Since the variables are orthogonal, D reduces to the euclidean distance and the overall ES is given by D=.25 k. With two variables, the overall sex difference would be D = .35. If the variables were three, D would equal .43. For five uncorrelated variables, D = .56; and if the researcher had measured participants on ten different aggression variables, each showing a univariate d = .25, the overall ES would be
D = .79. As noted earlier, relatively small differences on many dimensions can add up to a remarkable overall effect. Finally, adding correlations among variables could make D
larger or smaller (sometimes substantially so), depending on the exact pattern of correlations (see Figure 2).
In summary, computing multivariate effect sizes will give researchers a more accurate estimate of the overall difference between males and females on any truly multidimensional construct. First, the standard procedure almost invariably leads to underestimate the magnitude of sex differences construct-wise, and such underestimation bias becomes more severe as the number of measured variables increases. Second, there simply is no way of properly taking into account the effect of correlations between variables without calculating a multivariate effect size such as D.
Example 1: Sex differences in personality
I will now turn to a real-world example that strikingly demonstrates the importance of calculating multivariate effect sizes in addition to univariate ones. In a large Internet-based survey, Noftle and Shaver (2006) administered a Big Five personality inventory (the BFI; John, Donahue and Kentle, 1991) to 5,417 female and 2,901 male students.
Standardized sex differences on the five personality scales ranged from d =.10 to d = .53 in module (Table 1)1, with an average unsigned effect size d= .27. Correcting for attenuation
due to scale unreliability2 brings the average effect size to dc= .30.
1
Cohen’s d’s were calculated from correlations with the formula
F Mp p r
r d
) 1 ( − 2
= ,
where pM and pF are the sample proportions of males and females.
2
Evolutionary Psychology – ISSN 1474-7049 – Volume 7(2). 2009. -272-Table 1. Reanalysis of sex differences in Big Five personality traits from Noftle and Shaver (2006).
¯ ¯ ¯ ¯ ¯ ¯ ¯ ¯ ¯ ¯ ¯ ¯ ¯ ¯ ¯ ¯ ¯ ¯ ¯ ¯ ¯ ¯ ¯ ¯ ¯ ¯ ¯ ¯ ¯ ¯ ¯ ¯ ¯ ¯ ¯ ¯ ¯ ¯ ¯ ¯ ¯ ¯ ¯ ¯ ¯ ¯ ¯ ¯ ¯ ¯ ¯ ¯ ¯ ¯ ¯ ¯ ¯ ¯ ¯ ¯ ¯ ¯ ¯ ¯ ¯ ¯ ¯ ¯ ¯ ¯ ¯ ¯ ¯
Correlations and Reliabilities Sex Differences
¯ ¯ ¯ ¯ ¯ ¯ ¯ ¯ ¯ ¯ ¯ ¯ ¯ ¯ ¯ ¯ ¯ ¯ ¯ ¯ ¯ ¯ ¯ ¯ ¯ ¯ ¯ ¯ ¯ ¯ ¯ ¯ ¯ ¯ ¯ ¯ ¯ ¯ ¯ ¯ ¯ ¯ ¯ ¯ ¯ ¯ ¯ ¯ ¯ ¯ ¯ ¯ ¯ ¯ ¯ ¯ ¯ ¯ ¯ ¯ ¯ ¯ ¯ ¯ ¯ ¯ ¯ ¯ ¯ ¯ ¯ ¯ ¯
1. 2. 3. 4. 5. d corrected dc
¯ ¯ ¯ ¯ ¯ ¯ ¯ ¯ ¯ ¯ ¯ ¯ ¯ ¯ ¯ ¯ ¯ ¯ ¯ ¯ ¯ ¯ ¯ ¯ ¯ ¯ ¯ ¯ ¯ ¯ ¯ ¯ ¯ ¯ ¯ ¯ ¯ ¯ ¯ ¯ ¯ ¯ ¯ ¯ ¯ ¯ ¯ ¯ ¯ ¯ ¯ ¯ ¯ ¯ ¯ ¯ ¯ ¯ ¯ ¯ ¯ ¯ ¯ ¯ ¯ ¯ ¯ ¯ ¯ ¯ ¯ ¯ ¯
1. Neuroticism .86 -.53 -.57
2. Extraversion -.29 .76 -.18 -.20
3. Openness -.10 .26 .80 +.10 +.11
4. Agreeableness -.32 .13 .14 .81 -.23 -.25 5. Conscientiousness -.23 .17 .11 .29 .78 -.30 -.34
¯ ¯ ¯ ¯ ¯ ¯ ¯ ¯ ¯ ¯ ¯ ¯ ¯ ¯ ¯ ¯ ¯ ¯ ¯ ¯ ¯ ¯ ¯ ¯ ¯ ¯ ¯ ¯ ¯ ¯ ¯ ¯ ¯ ¯ ¯ ¯ ¯ ¯ ¯ ¯ ¯ ¯ ¯ ¯ ¯ ¯ ¯ ¯ ¯ ¯ ¯ ¯ ¯ ¯ ¯ ¯ ¯ ¯ ¯ ¯ ¯ ¯ ¯ ¯ ¯ ¯ ¯ ¯ ¯ ¯ ¯ ¯ ¯
Average ES d= .27 dc= .30
¯ ¯ ¯ ¯ ¯ ¯ ¯ ¯ ¯ ¯ ¯ ¯ ¯ ¯ ¯ ¯ ¯ ¯ ¯ ¯ ¯ ¯ ¯ ¯ ¯ ¯ ¯ ¯ ¯ ¯ ¯ ¯ ¯ ¯ ¯ ¯ ¯ ¯ ¯ ¯ ¯ ¯ ¯ ¯ ¯ ¯ ¯ ¯ ¯ ¯ ¯ ¯ ¯ ¯ ¯ ¯ ¯ ¯ ¯ ¯ ¯ ¯ ¯ ¯ ¯ ¯ ¯ ¯ ¯ ¯ ¯ ¯ ¯
Multivariate ES D = .84 Dc = .98
95% Upper Bound DU =.87
¯ ¯ ¯ ¯ ¯ ¯ ¯ ¯ ¯ ¯ ¯ ¯ ¯ ¯ ¯ ¯ ¯ ¯ ¯ ¯ ¯ ¯ ¯ ¯ ¯ ¯ ¯ ¯ ¯ ¯ ¯ ¯ ¯ ¯ ¯ ¯ ¯ ¯ ¯ ¯ ¯ ¯ ¯ ¯ ¯ ¯ ¯ ¯ ¯ ¯ ¯ ¯ ¯ ¯ ¯ ¯ ¯ ¯ ¯ ¯ ¯ ¯ ¯ ¯ ¯ ¯ ¯ ¯ ¯ ¯ ¯ ¯ ¯
Note: Correlations were obtained by pooling the male and female correlation matrices; reliability coefficients are shown on the diagonal. Negative effect sizes indicate higher scores in females.
These results are entirely typical of sex differences research and would fit neatly in Hyde’s (2005) meta-analysis; by looking at the average ES, one might conclude that the male and female distributions of Big Five personality traits in this sample show about 80% overlap. In fact, multivariate effect sizes tell a rather different story. I reanalyzed the same data (kindly provided by E. Noftle, personal communication) by calculating the Mahalanobis distance from Cohen’s d values and the correlation matrix of the five BFI scales (calculations were performed in R 2.7.2; R Development Core Team, 2008)3. As shown in Table 1, the overall male-female difference on the construct defined by the five personality scales was D = .84 (with a 95% upper bound of .87)4. Correcting for scale unreliability raised the estimated ES to Dc= .98, i.e., a sex difference of about one standard deviation. The corresponding overlap between the male and female distributions is about 45%; the statistical separation between the sexes in the Big Five personality space is clearly much larger than could be inferred by looking at individual scales one at a time. Given that
3
To avoid the spurious effect of sex on whole-sample correlations, the correlation matrix used to calculate D was obtained by pooling within-sex correlation matrices using weighted
means, as suggested by Hunter and Schmidt (2004): rpooled =
F M
F F M M
N N
N r N r
+ +
.
4
Evolutionary Psychology – ISSN 1474-7049 – Volume 7(2). 2009. -273-both d values and inter-scale correlations in Noftle and Shaver’s study are typical of personality research, this result is most likely to generalize to the entire field of sex differences in personality traits.
Example 2: Sex differences in aggression
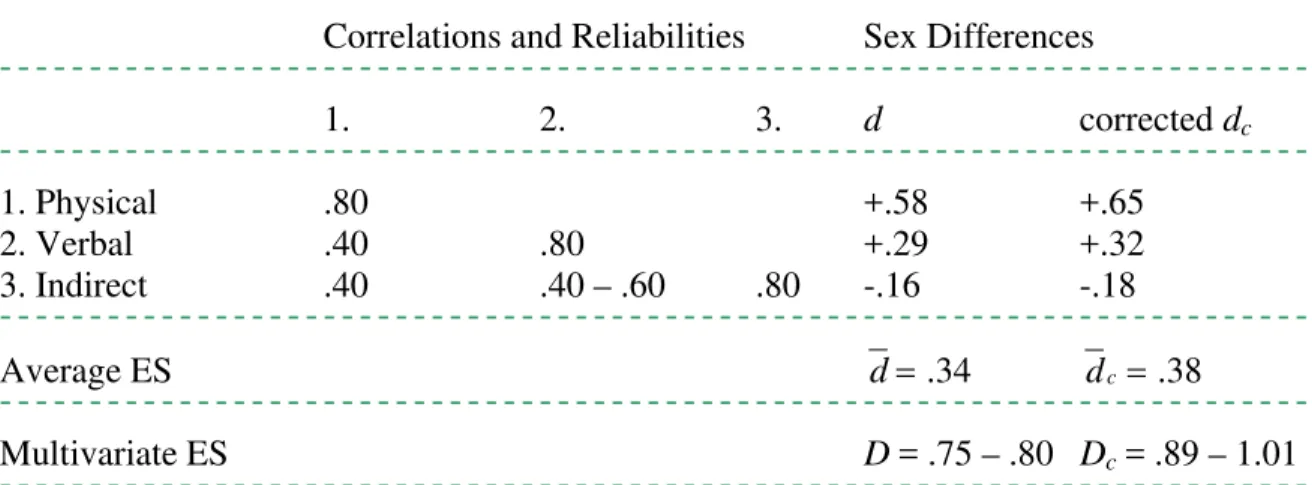
In a recent article, Archer (in press) discussed the hypothesis that sexual selection is responsible for the consistent pattern of sex differences observed in same-sex human aggression. He presented a summary of the meta-analytic findings in aggression research (Table 2 in Archer, in press) clearly showing that males are higher than females in physical and verbal aggression, and lower in indirect (or “relational”) aggression. The average effect sizes on the three aggression dimensions, pooled across assessment methods (e.g., observation, self report, teacher report), are shown in Table 2 (they were virtually identical to the median effect sizes and to the combined effect estimates by Knight, Guthrie, Page, and Fabes, 2002, thus confirming their robustness as overall estimates). The largest sex differences are found in physical aggression (average d = .58), the smallest in relational aggression (average d = –.16). While it is important to discriminate between different aspects of aggression and to interpret the univariate effect sizes one at a time, it can also useful to ask how much males and females differ in their overall aggression profiles. The average univariate effect size module is d= .34; correcting for attenuation by assuming
measurement reliability equal to .80 (a realistic estimate for psychological measures) produces a slightly higher average of dc= .38.
Evolutionary Psychology – ISSN 1474-7049 – Volume 7(2). 2009. -274-Table 2. Reanalysis of sex differences in aggression from Archer (in press).
¯ ¯ ¯ ¯ ¯ ¯ ¯ ¯ ¯ ¯ ¯ ¯ ¯ ¯ ¯ ¯ ¯ ¯ ¯ ¯ ¯ ¯ ¯ ¯ ¯ ¯ ¯ ¯ ¯ ¯ ¯ ¯ ¯ ¯ ¯ ¯ ¯ ¯ ¯ ¯ ¯ ¯ ¯ ¯ ¯ ¯ ¯ ¯ ¯ ¯ ¯ ¯ ¯ ¯ ¯ ¯ ¯ ¯ ¯ ¯ ¯ ¯ ¯ ¯ ¯ ¯ ¯ ¯ ¯ ¯ ¯ ¯ ¯
Correlations and Reliabilities Sex Differences
¯ ¯ ¯ ¯ ¯ ¯ ¯ ¯ ¯ ¯ ¯ ¯ ¯ ¯ ¯ ¯ ¯ ¯ ¯ ¯ ¯ ¯ ¯ ¯ ¯ ¯ ¯ ¯ ¯ ¯ ¯ ¯ ¯ ¯ ¯ ¯ ¯ ¯ ¯ ¯ ¯ ¯ ¯ ¯ ¯ ¯ ¯ ¯ ¯ ¯ ¯ ¯ ¯ ¯ ¯ ¯ ¯ ¯ ¯ ¯ ¯ ¯ ¯ ¯ ¯ ¯ ¯ ¯ ¯ ¯ ¯ ¯ ¯
1. 2. 3. d corrected dc
¯ ¯ ¯ ¯ ¯ ¯ ¯ ¯ ¯ ¯ ¯ ¯ ¯ ¯ ¯ ¯ ¯ ¯ ¯ ¯ ¯ ¯ ¯ ¯ ¯ ¯ ¯ ¯ ¯ ¯ ¯ ¯ ¯ ¯ ¯ ¯ ¯ ¯ ¯ ¯ ¯ ¯ ¯ ¯ ¯ ¯ ¯ ¯ ¯ ¯ ¯ ¯ ¯ ¯ ¯ ¯ ¯ ¯ ¯ ¯ ¯ ¯ ¯ ¯ ¯ ¯ ¯ ¯ ¯ ¯ ¯ ¯ ¯
1. Physical .80 +.58 +.65
2. Verbal .40 .80 +.29 +.32
3. Indirect .40 .40 – .60 .80 -.16 -.18
¯ ¯ ¯ ¯ ¯ ¯ ¯ ¯ ¯ ¯ ¯ ¯ ¯ ¯ ¯ ¯ ¯ ¯ ¯ ¯ ¯ ¯ ¯ ¯ ¯ ¯ ¯ ¯ ¯ ¯ ¯ ¯ ¯ ¯ ¯ ¯ ¯ ¯ ¯ ¯ ¯ ¯ ¯ ¯ ¯ ¯ ¯ ¯ ¯ ¯ ¯ ¯ ¯ ¯ ¯ ¯ ¯ ¯ ¯ ¯ ¯ ¯ ¯ ¯ ¯ ¯ ¯ ¯ ¯ ¯ ¯ ¯ ¯
Average ES d= .34 dc= .38
¯ ¯ ¯ ¯ ¯ ¯ ¯ ¯ ¯ ¯ ¯ ¯ ¯ ¯ ¯ ¯ ¯ ¯ ¯ ¯ ¯ ¯ ¯ ¯ ¯ ¯ ¯ ¯ ¯ ¯ ¯ ¯ ¯ ¯ ¯ ¯ ¯ ¯ ¯ ¯ ¯ ¯ ¯ ¯ ¯ ¯ ¯ ¯ ¯ ¯ ¯ ¯ ¯ ¯ ¯ ¯ ¯ ¯ ¯ ¯ ¯ ¯ ¯ ¯ ¯ ¯ ¯ ¯ ¯ ¯ ¯ ¯ ¯
Multivariate ES D = .75 – .80 Dc = .89 – 1.01
¯ ¯ ¯ ¯ ¯ ¯ ¯ ¯ ¯ ¯ ¯ ¯ ¯ ¯ ¯ ¯ ¯ ¯ ¯ ¯ ¯ ¯ ¯ ¯ ¯ ¯ ¯ ¯ ¯ ¯ ¯ ¯ ¯ ¯ ¯ ¯ ¯ ¯ ¯ ¯ ¯ ¯ ¯ ¯ ¯ ¯ ¯ ¯ ¯ ¯ ¯ ¯ ¯ ¯ ¯ ¯ ¯ ¯ ¯ ¯ ¯ ¯ ¯ ¯ ¯ ¯ ¯ ¯ ¯ ¯ ¯ ¯ ¯
Note: Correlations were estimated from the literature as described in the text. Effect sizes are shown before and after correcting for scale unreliablity, assuming all reliability coefficients equal to .80. Negative effect sizes indicate higher scores in females.
As shown in Table 2, the estimated overall sex difference in aggression is D = .75 – .80. Assuming .80 reliability, the disattenuated estimate is Dc = .89 – 1.01; in other words, males and females differ about one standard deviation in their overall aggression profiles. This corresponds to a statistical overlap of about 44 – 49%. Despite the error margin due to the rough estimates of correlations and reliabilities, this illustrative re-analysis indicates that the overall size of sex differences in human aggression may be more than twice as large as the average of the univariate ESs.
Limitations
The above examples show that proper aggregation of effect sizes can reveal substantial sex differences in multivariate psychological constructs. Of course, this does not mean that aggregation will always be useful or meaningful. I want to underline once again that I’m not proposing to automatically substitute univariate ESs with their multivariate counterparts; rather, the latter offer a complementary source of information, one that can be more or less interesting depending on the research question at hand. Most evolutionary hypotheses are highly domain-specific, and may be best answered by comparisons on single variables. In some instances, differences between males and females may be qualitative rather than quantitative, with distinct processes at work in the two sexes; clearly, in such cases any simple calculation of effect sizes (univariate or multivariate) would be uninformative or even misleading.
Methodological remarks
Evolutionary Psychology – ISSN 1474-7049 – Volume 7(2). 2009. -275-aggregating large number of variables produce inflated estimates of sex differences? To answer this question, one has to remember that D depends on the pattern of correlations between variables in addition to their number. Imagine that researcher A measures personality using only 5 scales, whereas researcher B employs 30 different scales. The 30 scales of researcher B are likely to show more content overlap with one another, and larger between-scale correlations; if the many scales he/she uses are psychometrically redundant, this will lead to relatively smaller estimates of D. In other words, adding variables contributes to D only as long as they provide new information about sex differences. Conversely, if the “true” dimensionality of that personality space is closer to 30 than to 5, and/or if some of the 30 scales reveal interesting sex effects that are masked in the 5 scales of researcher A, then researcher B may correctly get a higher estimate of the overall sex difference. The issue of how many variables to aggregate is, at bottom, a theoretical one: Careful definition of the traits under investigation is essential to ensure that the chosen variables provide a satisfactory coverage of the intended construct.
That said, it is true that sampling error will tend to inflate estimates of D when large numbers of variables are aggregated together. Even if all the univariate sex differences in the population were equal to zero, it would be virtually impossible that all the sample d’s turned out exactly zero as well. The same phenomenon leads to inflated R2 estimates when adding large numbers of independent variables to a multiple regression model. For this reason, when computing multivariate effect sizes researchers should (1) avoid including unnecessary or clearly redundant variables, and/or reduce the dimensionality of the construct via factor analysis; (2) in particular, keep the number of variables small when sample size is not large; and (3) when possible, compute confidence intervals on D to check the reliability of the estimate.
Finally, a note on correlation matrices: sometimes sex differences in two or more variables create spurious correlations between those variables that can muddle up the interpretation of D. For example, imagine that females were both more nurturing and less dominant than males, but that nurturance and dominance were otherwise completely unrelated within each sex. When computing whole-sample statistics, dominance and nurturance would be negatively correlated, but that would be solely due to sex differences in the two variables. Using the overall correlation coefficient to compute D would count the effect of sex differences twice, thus biasing the result in potentially misleading ways. For this reason, it seems advisable not to use whole-sample correlation matrices when computing Mahalanobis D to measure sex differences; whenever possible, a better estimate of correlations (unbiased by between-group differences) can be obtained by computing separate correlation matrices for males and females, then pooling them with one of the available methods. Of course, computing a pooled estimate is only meaningful if the within-sex correlation matrices are reasonably similar to one another.
Conclusion
Evolutionary Psychology – ISSN 1474-7049 – Volume 7(2). 2009. -276-the sexes. Luckily, -276-the appropriate multivariate ES indices are readily available, although seldom presented in data analysis textbooks; the Mahalanobis distance D is a highly intuitive measure of multivariate differences between groups, and has the same basic interpretation of Cohen’s d.
In this article I argued that accurate assessment of the magnitude of sex differences can foster progress in evolutionary research; indeed, I believe that evolutionary psychologists are especially likely to benefit from better measurement in this area. While the available models are still rudimentary in some respects, they already make it possible to predict the relative weight of sex differences between different psychological domains; and as theory will grow more sophisticated, empirical tests will increasingly depend on accurate quantification of between-sex variation, thus making effect size computation ever more important. I hope the present article will contribute to bring this important topic to the attention of researchers interested in human sex differences; I also hope it will prompt psychologists (regardless of their theoretical background) to challenge the received wisdom and consider the possibility that, taken as groups, human males and females are more different from one another than we currently believe.
Acknowledgements: I wish to thank Romina Angeleri, Jay Belsky, David Buss, Claudia
Chiavarino, Bruce Ellis, David Geary, Benjamin Reiser and two anonymous reviewers for their useful comments and advice.
Received 17 February 2009; Revision submitted 11 April 2009; Accepted 8 May 2009 References
Archer, J. (in press). Does sexual selection explain human sex differences in aggression?
Behavioral and Brain Sciences.
Archer, J., and Mehdikhani, M. (2003). Variability among males in sexually selected attributes. Review of General Psychology, 7, 219-236.
Becker, G. S. (1991). A treatise on the family. Cambridge, MA: Harvard University Press. Bernstein, I. H., and Gesn, P. R. (1997). On the dimensionality of the Buss/Perry
Aggression Questionnaire. Behaviour Research and Therapy, 35, 563-568.
Bettencourt, B. A. and Miller, N. (1996). Gender differences in aggression as a function of provocation: A meta-analysis. Psychological Bulletin, 119, 422-447.
Bradley, E. L. (2006). Overlapping coefficient. In S. Kotz, C. B. Read, N. Balakrishnan and B. Vidakovic (eds.) Encyclopedia of Statistical Sciences (2nd ed.) (pp. 546-547), Hoboken, NJ: Wiley.
Breaugh, J. A. (2003). Effect size estimation: factors to consider and mistakes to avoid.
Journal of Management, 29, 79–97.
Buller, D. J. (2005). Adapting minds: Evolutionary psychology and the persistent quest for human nature. Cambridge, MA: MIT Press.
Burchinal, M. R. (2008). How measurement error affects the interpretation and understanding of effect sizes. Child Development Perspectives, 2, 178-180.
Buss, A. H., and Perry, M. (1992), The Aggression Questionnaire. Journal of Personality and Social Psychology, 63, 452-459.
Evolutionary Psychology – ISSN 1474-7049 – Volume 7(2). 2009.
-277-American Psychologist, 50, 164-168.
Buss, D. M. (2004). Evolutionary psychology: The new science of the mind (2nd ed.). New York: Pearson.
Buss, D. M., and Schmitt, D. P. (1993). Sexual strategies theory: an evolutionary perspective on human mating. Psychological Review, 100, 204–232.
Card, N. A., Stucky, B. D., Sawalani, G. M., and Little, T. D. (2008). direct and indirect aggression during childhood and adolescence: A meta-analytic review of gender differences, intercorrelations, and relations to maladjustment. Child Development, 79, 1185–1229.
Cohen, J. (1988). Statistical power analysis for the behavioral sciences. Hillsdale, NJ: Erlbaum.
Costa, P. T. Jr., Terracciano, A., and McCrae, R. R. (2001). Gender differences in personality traits across cultures: Robust and surprising findings. Journal of Personality and Social Psychology, 81, 322-331.
Davies, A. P. C., and Shackelford, T. K. (2006). An evolutionary psychological perspective on gender similarities and differences. American Psychologist, 61, 640-641.
Del Giudice, M. (2009). Sex, attachment, and the development of reproductive strategies.
Behavioral and Brain Sciences, 32, 1-67.
De Maesschalck, R., Jouan-Rimbaud, D., and Massart, D. L. (2000). The Mahalanobis distance. Chemometrics and Intelligent Laboratory Systems, 50, 1-18.
Dindia, K., and Allen, M. (1992). Sex differences in self-disclosure: A meta-analysis. Psychological Bulletin, 112, 106-124.
Eagly, A. H., and Wood, W. (1999). The origins of sex differences in human behavior: Evolved dispositions versus social rules. American Psychologist, 54, 408-423. Figueredo, A. J., Sefcek, J. A., Vásquez, G., Brumbach, B. H., King, J. E. and Jacobs, W. J.
(2005). Evolutionary personality psychology. In D. M. Buss (Ed.), Handbook of Evolutionary Psychology (pp. 851-877). Hoboken, NJ: Wiley.
Fossati, A., Maffei, C., Acquarini, E, and Di Ceglie, A. (2003). Multigroup confirmatory component and factor analyses of the Italian version of the Aggression Questionnaire. European Journal of Psychological Assessment,19, 54-65
Gangestad, S. W., Haselton, M. G., and Buss, D. M. (2006). Evolutionary foundations of cultural variation: Evoked culture and mate preferences. Psychological Inquiry, 17, 75-95.
Gangestad, S. W., and Simpson, J. A. (2000). The evolution of human mating: Trade-offs and strategic pluralism. Behavioral and Brain Sciences, 23, 675-687.
Geary, D. C. (1998). Male, female. The evolution of human sex differences. Washington, DC: American Psychological Association.
Halpern, D. F., Benbow, C. P., Geary, D. C., Gur, R. C., Hyde, J. S., and Gernsbacher, M. A. (2007). The science of sex differences in science and mathematics.
Psychological Science in the Public Interest, 8, 1-51.
Harris, J. A. (1997). A further evaluation of the Aggression Questionnaire: Issues of validity and reliability. Behaviour Research and Therapy, 35, 1047-1053.
Hedges, L. V. (2008). What are effect sizes and why do we need them? Child Development Perspectives, 2, 167-171.
172-Evolutionary Psychology – ISSN 1474-7049 – Volume 7(2). 2009. -278-177.
Huberty, C. J. (2005). Mahalanobis distance. In B. S. Everitt and D. C. Howell (eds.),
Encyclopedia of statistics in behavioral science. Chichester: Wiley.
Hunter, J. E., and Schmidt, F. L. (2004). Methods of meta-analysis: Correcting error and bias in research findings (2nd ed). Newbury Park, CA: Sage.
Hyde, J. S. (2005). The gender similarities hypothesis. American Psychologist, 60, 581-592.
John, O. P., Donahue, E. M., and Kentle, R. L. (1991). The Big Five Inventory – Versions 4a and 54. Berkeley, CA: University of California, Berkeley, Institute of Personality and Social Research.
Kling, K. C., Hyde, J. S., Showers, C. J., and Buswell, B. N. (1999). Gender differences in self-esteem: A meta-analysis. Psychological Bulletin, 125, 470-500.
Knight, G. P., Guthrie, I. K., Page, M. C., and Fabes, R. A. (2002) Emotional arousal and gender differences in aggression: A meta-analysis. Aggressive Behavior, 28, 366-393.
Lippa, R. A. (2006). The gender reality hypothesis. American Psychologist, 61, 639-640. Mahalanobis, P. C. (1936). On the generalized distance in statistics. Proceedings of the
National Institute of Science, Calcutta, 2, 49-55.
Meesters, C., Muris, P., Bosma, H., Schouten, E., and Beuving, S. (1996). Psychometric evaluation of the Dutch version of the Aggression Questionnaire. Behaviour Research and Therapy, 34, 839-843.
Miller, G. (2000). The mating mind. How sexual choice shaped the evolution of human nature. London: Heinemann.
Miller, G. F., and Tal, I. R. (2007). Schizotypy versus openness and intelligence as predictors of creativity. Schizophrenia Research, 93, 317-324.
Miller, J. L., Vaillancourt, T., and Boyle, M. H. (2008). Examining the heterotypic continuity of aggression using teacher reports: Results from a national Canadian study. Social Development, 18, 164-180.
Nettle, D. (2005). An evolutionary perspective on the extraversion continuum. Evolution and Human Behavior, 26, 363-373.
Noftle, E. E. and Shaver, P. R. (2006). Attachment dimensions and the big five personality traits: associations and comparative ability to predict relationship quality. Journal of Research in Personality, 40, 179–208.
Ostrov, J. M., Ries, E. E., Stauffacher, K., Godleski, S. A., and Mullins, A. D. (2008). Relational aggression, physical aggression and deception during early childhood: A multimethod, multi-informant short-term longitudinal study. Journal of Clinical Child & Adolescent Psychology, 37, 664 – 675.
R Development Core Team (2008). R: A language and environment for statistical computing. Vienna, Austria: R Foundation for Statistical Computing. URL http://www.R-project.org.
Reiser, B. (2001). Confidence intervals for the Mahalanobis distance. Communications in Statistics: Simulation and Computation, 30, 37–45.
Schmitt, D. P. (2005). Sociosexuality from Argentina to Zimbabwe: A 48-nation study of sex, culture, and strategies of human mating. Behavioral and Brain Sciences, 28, 247-275.
Evolutionary Psychology – ISSN 1474-7049 – Volume 7(2). 2009. -279-ecological stressors influence dismissing orientations across genders and geographies. Cross-Cultural Research, 42, 220–247.
Schmitt, D. P., Alcalay, L., Allensworth, M., Allik, J., Ault, L., Austers, I., et al. (2003). Are men universally more dismissing than women? gender differences in romantic attachment across 62 cultural regions. Personal Relationships, 10, 307–331.
Silverman, I., and Eals, M. (1992). Sex differences in spatial abilities: Evolutionary theory and data. In J. H. Barkow, L. Cosmides and J. Tooby (Eds.), The adapted mind (pp. 533-549). New York: Oxford University Press.
Vaillancourt, T., Brendgen, M., Boivin, M., and Tremblay, R. E. (2003). A longitudinal confirmatory factor analysis of indirect and physical aggression: Evidence of two factors over time? Child Development, 74, 1628-1638.
Voyer, D., Voyer, S., and Bryden, M. P. (1995). Magnitude of sex differences in spatial abilities: A meta-analysis and consideration of critical variables. Psychological Bulletin, 117, 250-270.
Zou, G. Y. (2007). Exact confidence interval for Cohen’s effect size is readily available.