Wolney Lisboa CondeI,II Débora Rocha OliveiraIII,IV Camila A BorgesIII
Larissa Galastri BaraldiI
I Departamento de Nutrição. Faculdade de Saúde Pública. Universidade de São Paulo. São Paulo, SP, Brasil
II Núcleo de Pesquisas Epidemiológicas em Nutrição e Saúde. Universidade de São Paulo. São Paulo, SP, Brasil
III Programa de Pós-graduação de Nutrição em Saúde Pública. Departamento de Nutrição. Faculdade de Saúde Pública. Universidade de São Paulo. São Paulo, SP, Brasil IV Departamento de Nutrição. Centro
Universitário São Camilo. São Paulo, SP, Brasil
Correspondence: Wolney Lisboa Conde Departamento de Nutrição - FSP Av. Doutor Arnaldo, 715 01246-904 São Paulo, SP, Brasil E-mail: [email protected] Received: 4/5/2012
Approved: 7/27/2012
Article available from: www.scielo.br/rsp
Consistency between
anthropometric measures in
national survey
ABSTRACT
OBJECTIVE: To analyze the consistency between height and weight values
obtained by direct measurement and reporting in contemporary national surveys.
METHODS: A group of 20 to 39 year olds were selected in the Household
Budget Survey (POF) and Surveillance System of Protective and Risk Factors for Chronic Diseases by Telephone Survey (VIGITEL), 2008 and 2009. The surveys were matched by sex and age. For inference about the comparison between standardized (POF) and self-declared (VIGITEL) height and weight values used the Student t test and the Spearman estimator (ρ). The consistency between anthropometric indexes and indicators in the two surveys was estimated by the estimators of Lin (Φ) and Pearson (r).
RESULTS: Weight and height results were higher than those measured in a
standardized way. The correlation of average height in the two surveys was
ρ = 0.31 in women and ρ = 0.62 in men. The association was ρ = 0.86 and 0.88 respectively, for weight. Body mass index showed a strong correlation and agreement of approximately 0.90 for the two estimators in both sexes. The agreement between the diagnosis of obesity from the values of the measured and self-declared surveys was Φ = 0.89 in men and Φ = 0.91 in women.
CONCLUSIONS: Reported height and weight follow the same bias as those
measured standardly and eliminates distortion in estimated indices and indicators in both surveys. The declared anthropometric values show good prospects for use in other analyses involving determinants of health and nutrition.
DESCRIPTORS: Body Weights and Measures, methods. Anthropometry, methods. Diagnostic Self Evaluation. Techniques, Measures,
The question of whether there are differences in reported and directly measured anthropometric data and, if so, the size and direction of this difference has been answered by an experiment which compares the two types of data directly, using the subjects them-selves as control.
The responses obtained in such an approach indicate that height and weight reported by the subject differ from the values obtained when measured by an expe-rienced anthropometrist.10,19 The reported values tended
to overestimate height and underestimate weight,10,15,23
although these differences did not appear to be affected by the age22 or height5 of the subject. In some studies,
the clinical impact of the comparison was shown to be higher among women than in men.3,6,7
These responses and evidence do not encompass all the complexity of the problem and sideline the ultimate aim of population based surveys: to produce valid estimates for the population studied. This aim broadens the comparison between reported and directly measured anthropometric data, as the sources of variation include the surveys themselves, even when only median values are used. The method which uses the subjects them-selves as control for analyzing the variability between measured and reported anthropometric values is not suffi cient and is not relevant to address the reliability or consistency of data obtained in population studies.20
Rather than comparing measured and reported values, measured values taken at an unspecifi ed time and in a non-standard was are compared with measured values taken in a standardized way at the time of the survey.11,12 Thus, using the individual as control in the
analysis has the disadvantage of introducing a favor-able bias to standardized direct measurement, as all of the noise of the comparison, including that which has nothing to do with the individual, is concentrated in the reported measurement.
The irrelevance of analysis based on individuals for the validity or reliability of the measures in popula-tion studies is because typical variability which occurs between surveys is discounted.20 Therefore, in this type
of analysis, the variability of anthropometric measures taken at different times and, by extension, the vari-ability of the anthropometric values of the same cohort between surveys, remains unanswered.
The ecological approach between cohorts seems more suitable and informative for analyzing the difference
INTRODUCTION
between population based anthropometric data that is self-reported by the interviewee and standardized direct measurements taken during the survey. This approach does not resolve all of the problems previously outlined, but it allows a more consistent analysis and interpreta-tion of the differences.
This study aimed to analyze the consistency between reported height and weight values and those obtained by direct measurement in recent national surveys.
METHODS
The VIGITEL (Surveillance System of Protective and Risk Factors for Chronic Diseases by Telephone Survey), established by the Brazilian Ministry of Health in 2006, is a system which monitors annually the frequency and distribution of the principal risk factors associated with non-communicable chronic illness in the Brazilian population. The basic VIGITELa sample
is composed of at least 2,000 individuals aged ≥ 18 in the Federal District and in each state capital. Adjusting the sample for the total population of the country takes place in two stages: in the fi rst stage, the weighting is a function of the probability of being selected and of having a landline in the universe of each city studied; in the second stage, this is the relationship between the frequencies of the sex, age group and schooling catego-ries in the VIGITELa sample and in IBGE (Brazilian
Institute of Geography and Statistics) Demographic Census. Details of the VIGITEL sample procedures are described in Kuczmarski et al.12
The Household Budget Survey (POF) is a national survey conducted by the IBGEb in both urban and
rural areas throughout the country, with all states represented. The permanent private residences in the sample are drawn within clusters distributed according to census tracts grouped by socioeconomic strata. The POF collects demographic data, data on the household budget and measures the height and weight of all indi-viduals in the sample.b
The VIGITEL 2008 and 2009 samples were drawn from all cases aged ≥ 20 and < 40 years old, giving a total of 103,164 cases selected (44,071 men and 59,093 women). Data from women who were pregnant or suspected they were pregnant had been previously excluded from the samples. Data from the 2008-2009 POF on individuals aged between 20 and 40 and on residents in the state capitals and metropolitan areas
a Ministério da Saúde. VIGITEL Brasil 2008: Vigilância de fatores de risco e proteção de doenças crônicas por inquérito telefônico: estimativas sobre freqüência e distribuição sócio-demográfi ca de fatores de risco e proteção para doenças crônicas nas capitais dos 26 estados brasileiros e no Distrito Federal em 2008. Brasília (DF); 2009.
covered by VIGITEL were used. The estimates took into consideration the weighting factors in each survey.
In the VIGITEL survey, height and weight were reported by the subjects.14 In the POF survey height
and weight values were measured in a standardized way in the subjects’ own residences. Body Mass index was calculated dividing weight (kg) by height2 (m) and
frequency of underweight (BMI < 18.5 kg/m2) and
obese (BMI ≥ 30 kg/m2) individuals was estimated,
according to critical values for adults adopted by the World Health Organization.24
The analysis of consistency between reported and directly measured values in 2008-2009 were based on the premise that, in all of the comparisons, the values presented represent a mean estimate of the Brazilian population in the state capitals and metropolitan areas.
The height and weight means were stratifi ed year on year from 20 to 29 years old and biennia between 30 and 39 years old to maintain the homogeneity of the sample.
The VIGITEL and POF height and weight means were compared statistically for each age with values effectively measured using the student’s t-test. The
p values < 0.05 were considered signifi cant. The correla-tion of mean height and weight values between the two surveys was obtained using the Spearman estimator.
The consistency between estimated anthropometric indicators based on measurements (POF) and on reported values (VIGITEL) in the Brazilian population in 2008-2009 was analyzed using Pearson (r) and Lin () estimators according to sex and age group.
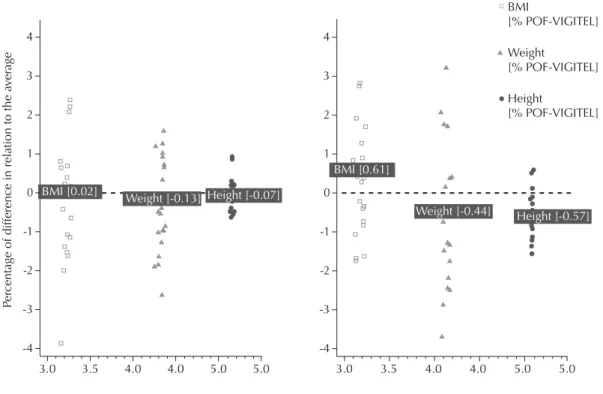
To show the effect of the reported and directly measured measurements, the values for height, weight and Body Mass Index were log-transformed and the differences versus the means plotted, as proposed by Bland & Altman.2
The analyses were carried out using the Stata® version
11 software package.
RESULTS
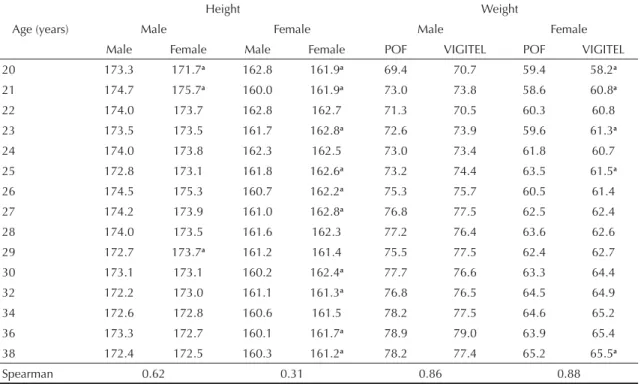
Differences in values for height between POF and VIGITEL presented no systematic characteristics in men and were not associated with age. Differences in values for weight were not associated with age and the difference between means was not statistically signifi cant at any age. There was no link between the differences in mean weight and the differences in mean height, i.e., when mean weight was higher in VIGITEL, mean height did not follow any trend of being higher or lower (Table 1).
Ten of the 15 difference in height values were statis-tically signifi cant for women. The mean height in
Table 1. Means of height and weight values as collected by the VIGITEL system and the POF survey, according to sex and age group. Brazilian capitals and the Federal District, 2008-2009.
Height Weight
Age (years) Male Female Male Female
Male Female Male Female POF VIGITEL POF VIGITEL
20 173.3 171.7a 162.8 161.9a 69.4 70.7 59.4 58.2a
21 174.7 175.7a 160.0 161.9a 73.0 73.8 58.6 60.8a
22 174.0 173.7 162.8 162.7 71.3 70.5 60.3 60.8
23 173.5 173.5 161.7 162.8a 72.6 73.9 59.6 61.3a
24 174.0 173.8 162.3 162.5 73.0 73.4 61.8 60.7
25 172.8 173.1 161.8 162.6a 73.2 74.4 63.5 61.5a
26 174.5 175.3 160.7 162.2a 75.3 75.7 60.5 61.4
27 174.2 173.9 161.0 162.8a 76.8 77.5 62.5 62.4
28 174.0 173.5 161.6 162.3 77.2 76.4 63.6 62.6
29 172.7 173.7a 161.2 161.4 75.5 77.5 62.4 62.7
30 173.1 173.1 160.2 162.4a 77.7 76.6 63.3 64.4
32 172.2 173.0 161.1 161.3a 76.8 76.5 64.5 64.9
34 172.6 172.8 160.6 161.5 78.2 77.5 64.6 65.2
36 173.3 172.7 160.1 161.7a 78.9 79.0 63.9 65.4
38 172.4 172.5 160.3 161.2a 78.2 77.4 65.2 65.5a
Spearman 0.62 0.31 0.86 0.88
a p < 0.05
VIGITEL was higher than that in POF in eight cases. In ten comparisons, VIGITEL values exceeded those of POF for weight and in all of the comparisons of over 30s. The values for height were higher in VIGITEL in almost all of the comparisons. The VIGITEL values exceeded mean values in the POF in the majority of comparisons of weight values (Table 1).
Correlation between mean height values in the two surveys was greater among men than women. With
regards to weight, there was a strong association between reported and measured values for both sexes (Table 1).
BMI based on reported height and weight values showed high concordance () and correlation (r) with that calculated from directly measured values for both sexes (Table 2). Stratifi cation of the comparisons by age shows, however, fewer similarities between the two surveys, especially in the classifi cation of women as underweight or obese.
Table 2. Pearson (r) and [Lin (Φ)] coeffi cients between anthropometric indicators estimated based on directly measured (POF) and reported (VIGITEL) according to sex and age group in the Brazilian adult population. Brazilian capitals and the Federal District, 2008-2009.
Sex and age BMI (kg/m2) Underweight Obese
Lin (Φ) Bias Pearson (r) Lin (Φ) Bias Pearson (r) Lin (Φ) Bias Pearson (r)
Male
20 to 24 0.41 0.23 0.48 0.32 0.06 0.37 0.31 0.02 0.40
25 to 29 0.78 0.17 0.86 -0.02 0.01 -0.03 0.43 0.03 0.87
30 to 34 0.04 -0.29 0.08 0.01 0.02 0.04 -0.40 0.00 -0.40
35 to 39 0.04 -0.15 0.06 -0.14 0.01 -0.41 0.15 0.01 0.23
40 to 49 0.89 -0.01 0.91 0.35 0.01 0.46 0.71 0.02 0.76
Female
20 to 24 0.51 0.08 0.52 0.17 0.03 0.40 0.05 0.01 0.09
25 to 29 0.08 -0.48 0.17 -0.05 0.04 -0.86 -0.86 0.00 -0.87
30 to 34 0.72 -0.02 0.77 0.34 0.00 0.48 -0.43 0.01 -0.86
35 to 39 0.62 -0.01 0.63 -0.33 0.02 -0.57 0.06 0.00 0.07
40 to 49 0.91 -0.11 0.92 0.49 0.02 0.62 0.61 0.01 0.62
VIGITEL: Surveillance System of Protective and Risk Factors for Chronic Diseases by Telephone Survey POF: Household Budget Survey
VIGITEL POF
0.30
0.25
0.20
0.15
0.10
Proportion of o
verweight patients
Female Male
0.05
0.00
2021 22 23 24 25 26 27 28 29 30 32 34 36 38 20 21 22 23 24 25 26 27 28 29 30 32 34 36 38
VIGITEL: Surveillance System of Protective and Risk Factors for Chronic Diseases by Telephone Survey POF: Household Budget Survey
The VIGITEL values were higher than those estimated in the POF for the same age groups in men. In women, the expression of higher values in the obesity estimates varied between 20 and 29 years old and tended to be higher in VIGITEL from this age and upwards (Figure 1).
The dispersion of differences proportional to the mean between the two surveys was greater among females than males, notably for weight values. For women, the height and weight values in VIGITEL exceeded those observed in the POF by an average of around 5%. For males, the trend for VIGITEL values to exceed POF values still existed, although in magnitudes the proportional differences of which were close to zero (Figure 2).
DISCUSSION
Comparison between reported and directly measured height and weight values in the Brazilian population of the state capitals and the Federal District in 2008-2009 shows: a) height and weight values reported by the interviewee tend to be higher than those directly measured in the same population; b) men are less imprecise and inexact than women when providing
anthropometric data; c) overall estimates based on BMI calculated using reported or measured values are relatively close; d) there is greater variability in obesity estimates when stratifi ed by age; e) the differ-ences between measured and reported values are more pertinent to females. By restricting the age range in the study, this analysis avoided the results being infl u-enced by anthropometric fl uctuations typical of growth completion in adolescence and of ageing.
The fact that reported height and weight values are higher than measured values is widely documented and recognized in diverse studies on the topic.6,9,21 These
studies, however, refer to analytical designs using the subjects themselves as control. The data reported here may represent an agglomeration of values originally obtained by unstandardized measuring technique, carried out by untrained anthropometrists.
Among men, the mean estimate for the population, based on reported anthropometric values, does not differ from than based on directly measured values in the same population. For women, however, the differences between reported and measured values are statistically signifi cant, and proportionally higher, in the case of weight. The profi le of the differences for POF and VIGITEL average [log]
Pe
rc
entage of difference in relation to the a
ver
age
BMI
[% POF-VIGITEL]
Weight
[% POF-VIGITEL]
Height
[% POF-VIGITEL]
BMI [0.02]
Weight [-0.13]
Weight [-0.44] Height [-0.07]
Height [-0.57] BMI [0.61]
2
-2 1
-1 0 4
-4 3
-3
3.0 3.5 4.0 4.0 5.0 5.0
2
-2 1
-1 0 4
-4 3
-3
3.0 3.5 4.0 4.0 5.0 5.0
VigiteI: Surveillance System Risk and Protective Factors for Chronic Diseases Survey Telephone POF: Household Budget Survey
females means that BMI based on measured values was a mean 0.6% higher.
With the exception of a study carried out in Italy, which reported differences of approximately 1kg/m² in both sexes, the majority of studies describing discrepancies in reported and measured anthropometric values,3,4,18 the
difference in BMI does not exceed 0.5 kg/m².
Comparison of the results of this study with those of other published analyses on the topic raises two relevant points. The fi rst concerns the possibility of using data for anthropometric estimates about the population studied and the use of anthropometric data in studies related to risk factors for health; the second concerns the less exact and precise nature of the data for females in relation to the anthropometric values in question.
Using these anthropometric data to estimate BMI or indicators of obesity in the population studied provides reliable and relatively precise data with regards to the values which are conventionally used, from surveys in which anthropometric measures are taken in a standardized way in the subjects’ homes. Precision tends to fall as then analyses and their associations are stratifi ed by sex and age group. The variations in BMI estimates (up to 3.0% on average) do not appear to be suffi cient to distort overall estimates or studies of associations between anthropometric values and risk factors for health.
Estimates from unpublished data originating from anthropometric training in the Population Nutrition Evaluation Laboratory of the Nutrition Department of Sao Paulo University indicate that measures taken using unstandardized measuring procedures or by less experienced anthropometrists tend to increase the anthropometric values, which provides a reasonable
explanation for some of the fi ndings of this study.c
The lower precision and exactitude in the anthropo-metric values reported by women are more diffi cult to explain, although the results are in line with those of other analyses published in Brazil9 and in other
coun-tries.2,6,13,17,23 It may be that women are less exposed
socially to systematic measuring processes. This occurs in the case of men, for example when under-going their physical checks for military service, which is obligatory in Brazil. The fact of being less exposed to standardized measuring undertaken by trained anthropometrists using correctly calibrated equip-ment means women are more exposed to measuring themselves opportunistically (equipment in pharma-cies, for example) or to the effects of psychological perception on body size.8,16
If true, these hypotheses have more impact on variability of weight values than height values, as observed in Figure 2. The greater variability in weight values among women is directly linked to opportunistic measuring.
The results here indicate that overall estimates of nutri-tional states obtained based on reported anthropometric measures are consistent with those based on directly measured values for the same population in equivalent periods. More stratifi ed estimates show greater impre-cision in the results, especially for females. The main nutritional trends in the population will not be affected by stratifying the analyses.
The results show the relevance and usefulness of VIGITEL style surveys in monitoring overall values and main trends in the nutritional state and its associa-tion with health risks in countries with similar structures to Brazil. These data open good prospects of using the anthropometric values of this monitoring activity in other analyses involving health and nutrition determinants.
1. Bagni UV, Fialho Jr CC, Barr os DC. Infl uência do erro técnico de medição em Antropometria sobre o
diagnóstico nutricional. Nutrire Rev Soc Bras Aliment
Nutr. 2009;34(3):187-200.
2. Bland JM, Altman DG. Comparing methods of measurement: why plotting difference against standard
method is misleading. Lancet. 1995;346(8982):1085-7.
DOI:10.1016/S0140-6736(95)91748-9
3. Bolton-Smith C, Woodward M, Tunstall-Pedoe H, Morrison C. Accuracy of the estimated prevalence of obesity from self reported height and weight in an
adult Scottish population. J Epidemiol Community
Health. 2000;54(2):143-8. DOI:10.1136/jech.54.2.143
4. Castro V, Moraes SA, Freitas ICM. Agreement of anthropometric measures in a population-based epidemiological study: Ribeirão Preto, SP, 2006. OBEDIARP Project.
Rev Bras Epidemiol. 2010;13(1):58-68. DOI:10.1590/S1415-790X2010000100006
5. Dahl AK, Hassing LB, Fransson EI, Pedersen NL. Agreement between self-reported and measured height, weight and body mass index in old age-a longitudinal study with 20 years
of follow-up. Age Ageing. 2010;39(4):445-51.
DOI:10.1093/ageing/afq038
6. Danubio ME, Miranda G, Vinciguerra MG, Vecchi E, Rufo F. Comparison of self-reported and measured height and weight: Implications for obesity
research among young adults. Econ Human Biol.
2008;6(1):181-90. DOI:10.1016/j.ehb.2007.04.002
7. Engstrom JL, Paterson SA, Doherty A, Trabulsi M, Speer KL. Accuracy of self-reported height and weight in women: an integrative review of the literature.
J Midwifery Women’s Health. 2003;48(5):338-45. DOI:10.1016/S1526-9523(03)00281-2
8. Feingold A, Mazzella R. Gender differences in body
image are increasing. Psychol Sci. 1998;9(3):190-5.
DOI:10.1111/1467-9280.00036
9. Fonseca MJM, Faerstein E, Chor D, Lopes CS. Validade de peso e estatura informados e índice de massa corporal: estudo pró-saúde.
Rev Saude Publica. 2004;38(3):392-98. DOI:10.1590/S0034-89102004000300009
10. Gorber SC, Tremblay M, Moher D, Gorber B. A comparison of direct vs self-report measures for assessing height, weight and body mass index: a
systematic review. Obes Rev. 2007;8(4):307-26.
DOI:10.1111/j.1467-789X.2007.00347.x
11. Krul AJ, Daanen HAM, Choi H. Self-reported and measured weight, height and body mass index (BMI) in Italy, the Netherlands and North
America. Eur J Public Health. 2011;21(4):414-9.
DOI:10.1093/eurpub/ckp228
12. Kuczmarski MF, Kuczmarski RJ, Najjar M. Effects of age on validity of self-reported height, weight,
and body mass index: fi ndings from the Third National Health and Nutrition Examination Survey,
1988-1994. J Am Diet Assoc. 2001;101(1):28-34.
DOI:10.1016/S0002-8223(01)00008-6
13. Lee D-H, Shin A, Kim J, Yoo KY, Sung J. Validity of self-reported height and weight in a Korean
population. J Epidemiol. 2011;21(1):30-6.
DOI:10.2188/jea.JE20100058
14. Moura EC, Morais Neto OL, Malta DC, Moura L, Silva NN, Bernal R, et al Vigilância de Fatores de Risco para Doenças Crônicas por Inquérito Telefônico nas capitais dos 26 estados brasileiros e no Distrito Federal
(2006). Rev Bras Epidemiol. 2008;11(Supl 1):20-37.
DOI:10.1590/S1415-790X2008000500003
15. Nawaz H, Chan W, Abdulrahman M, Larson D, Katz DL. Self-reported weight and height: implications for
obesity research. Am J Prev Med. 2001;20(4):294-8.
DOI:10.1016/S0749-3797(01)00293-8
16. Osuna-Ramírez I, Hernández-Prado B, Campuzano JC, Salmerón J. Indice de masa corporal y percepción de la imagen corporal en una población adulta mexicana: la precisión del
autorreporte. Salud Publica Mex. 2006;48(2):94-103.
DOI:10.1590/S0036-36342006000200003
17. Peixoto MRG, Benício MH, Jardim PCBV. Validade do peso e da altura auto-referidos: o estudo de
Goiânia Rev Saude Publica. 2006;40(6):1065-72.
DOI:10.1590/S0034-89102006000700015
18. Roberts R. Can self-reported data accurately describe the prevalence of overweight?
Public Health. 1995;109(4):275-84. DOI:10.1016/S0033-3506(95)80205-3
19. Rowland ML. Self-reported weight and height. Am J
Clin Nutr. 1990;52(6):1125-33.
20. Schwartz S. The fallacy of the ecological fallacy: the potential misuse of a concept and the
consequences. Am J Public Health. 1994;84(5):819-24.
DOI:10.2105/AJPH.84.5.819
21. Shields M, Gorber SC, Tremblay MS. Estimates of obesity based on self-report versus direct measures.
Health Rep. 2008;19(2):61-76.
22. Spencer EA, Appleby PN, Davey GK, Key TJ. Validity of self-reported height and weight in 4808 EPIC-Oxford
participants. Public Health Nutr. 2002;5(4):561-5.
DOI:10.1079/PHN2001322
23. Taylor AW, Grande ED, Gill TK, ChittleboroughCR,
WilsonDH, AdamsRJ, et al. How valid are
self-reported height and weight? A comparison between CATI self-report and clinic measurements using a large
cohort study. Aust N Z J Public Health.
2006;30(3):238-46. DOI:10.1111/j.1467-842X.2006.tb00864.x
24. World Health Organization. Physical status: the use and interpretation of anthropometry. Geneva; 1995.
REFERENCES
![Table 2. Pearson (r) and [Lin ( Φ )] coeffi cients between anthropometric indicators estimated based on directly measured (POF) and reported (VIGITEL) according to sex and age group in the Brazilian adult population](https://thumb-eu.123doks.com/thumbv2/123dok_br/19036534.477274/4.812.109.750.342.629/pearson-anthropometric-indicators-estimated-directly-according-brazilian-population.webp)