Different Polar Metabolites and Protein
Profiles between High- and Low-Quality
Japanese
Ginjo
Sake
Kei Takahashi*, Hiromi Kohno
National Research Institute of Brewing, 3-7-1 Kagamiyama, Higashi-hiroshima, Hiroshima, 739–0046, Japan
*k.takahashi@nrib.go.jp
Abstract
Japaneseginjosake is a premium refined sake characterized by a pleasant fruity apple-like flavor and a sophisticated taste. Because of technical difficulties inherent in brewingginjo sake, off-flavors sometimes occur. However, the metabolites responsible for off-flavors as well as those present or absent in higher qualityginjosake remain uncertain. Here, the rela-tionship between 202 polar chemical compounds in sake identified using capillary electro-phoresis coupled with time-of-flight mass spectrometry and its organoleptic properties, such as quality and off-flavor, was examined. First, we found that some off-flavored sakes con-tained higher total amounts of metabolites than other sake samples. The results also identi-fied that levels of 2-oxoglutaric acid and fumaric acid, metabolites in the tricarboxylic acid cycle, were highly but oppositely correlated withginjosake quality. Similarly, pyridoxine and pyridoxamine, co-enzymes for amino transferase, were also highly but oppositely correlated withginjosake quality. Additionally, pyruvic acid levels were associated with good quality as well. Compounds involved in the methionine salvage cycle, oxidative glutathione derivatives, and amino acid catabolites were correlated with low quality. Among off-flavors, an inharmoni-ous bitter taste appeared attributable to polyamines. Furthermore, protein analysis displayed that a diversity of protein components and yeast protein (triosephosphate isomerase, TPI) leakage was linked to the overall metabolite intensity inginjosake. This research provides insight into the relationship between sake components and organoleptic properties.
Introduction
Japanese sake, a traditional fermented alcoholic beverage, is produced from polished rice (Oryza sativaJaponica sp.), rice mold (Aspergillus oryzae), and sake yeast (Saccharomyces cerevisiae) by simultaneous saccharification and alcohol fermentation [1,2]. Rice mold produces and secretes a large amount of starch hydrolyzing enzymes and protein breakdown enzymes. In addition, rice mold produces lipids, amino acids, vitamins, and secondary metabolites. Sake yeast, in turn, produces ethanol and several types of higher alcohols, acetic ester, ethyl esters, and many types of organic acids. Sake thus contains a variety of volatile and non-volatile metabolites derived
OPEN ACCESS
Citation:Takahashi K, Kohno H (2016) Different Polar Metabolites and Protein Profiles between High-and Low-Quality JapaneseGinjoSake. PLoS ONE 11(3): e0150524. doi:10.1371/journal.pone.0150524
Editor:Keiko Abe, The University of Tokyo, JAPAN
Received:September 10, 2015
Accepted:February 14, 2016
Published:March 3, 2016
Copyright:© 2016 Takahashi, Kohno. This is an open access article distributed under the terms of the
Creative Commons Attribution License, which permits unrestricted use, distribution, and reproduction in any medium, provided the original author and source are credited.
Data Availability Statement:All relevant data are within the paper.
Funding:This work was financially supported by Grant-in-Aid for Young Scientists (B) Grant Number 26850092 for K.T. (http://www.jsps.go.jp), and the Tojuro Iijima Memorial Foundation for the promotion of food science and technology for K.T. (http://www. iijima-kinenzaidan.or.jp/index.html).
Competing Interests:The authors have declared that no competing interests exist.
ionization-from rice and microorganisms, which often differ depending on the brewing process and condi-tions, techniques employed, pasteurization process, and the storage conditions [3–8], similar to that which occurs during winemaking [9–11] and beer brewing [12–14] processes. Among Japa-nese sake,ginjosake, a premium sake (refined rice wine), has become popular even abroad. In theginjobrewing process, sake mash is fermented for a long period (approximately 30–40 days) under low temperature to carefully control yeast and enzymatic activity, and to not emit fruity ester compounds into the air. Owing to the technical difficulties of handlingginjosake mash, which arise in part because of the higher ethyl ester-producing cerulenin-resistant sake yeast generally used in modernginjosake brewing, undesirable off-flavors can be accidentally albeit rarely generated, leading to a degradedginjosake quality.
Many terms have been used to describe the characteristic tastes and flavors of sake, accord-ing to a Japanese government report [15]. With regard to pleasant flavor, ethyl hexanoate (ethyl caproate) [16] and Isoamyl acetate [17] produce fruity apple and banana like flavors, respectively. However, the molecular mechanisms underlying the generation of these com-pounds are considerably different. The typical ethyl esters inginjosake, ethyl hexanoate, is preferably produced at a lower temperature in sake mash than is isoamyl acetate; hence the ascertainment of ethyl hexanoate is thought to be one of the“merkmale”of higher quality of
ginjosake. With regard to pleasant taste, aftertaste, smoothness, body, and sweetness are important forginjosake. Conversely, with regard to unpleasant flavor, fatty acid [6,7,18], roast, deterioration“hineka”[19–21], deterioration arising from non-pasteurization“
raw-hineka”[21] (similar to“mureka”[22]), yeast-debris, sulfur compound-like [23], diacetyl [24], and pungent (similar to 4-vinylguaiacol-like and smoke-like odors) odors occasionally arise during sake brewing. Unpleasant tastes, such as inharmonious bitter taste and inharmonious body also degradeginjosake quality. These organoleptic properties arise from the concentra-tion or combinaconcentra-tion of chemical compounds in the sake. Previously, numerous studies have identified the compounds that confer such organoleptic properties in sake [3,5,6,19–21,23–
25]. However, a comprehensive understanding of the different compounds and the resulting organoleptic properties such as quality and off-flavor is yet to be determined.
As a rudimentary challenge, a wide range of chemical compounds in sake have been detected [8,25,26], which has built a fundamental knowledge of the components in sake and their relationships to its sensory properties. Recently, the development of metabolite analytical instruments and data mining techniques have permitted a comprehensive analysis of the com-ponents in sake, and the associated correlation analyses of a variety of metabolites in sake with its sensory evaluation have just begun to be explored by several independent groups [3–6]. Using capillary electrophoresis time-of-flight mass spectrometry (CE–TOFMS), Sugimoto et al. found that the levels of amino acids and organic acids were positively correlated to the sourness of sake [3]. They also found that the pasteurization process considerably changes the metabolites in sake, and that the amino acids were reduced over the course of time during the storage period [4]. Mimura et al. used gas chromatography coupled with MS (GC–MS) to fol-low compound derivatization, and demonstrated that their strategy yielded results consistent with previous findings for an analysis based on orthogonal projections to latent structures regression analysis and variable importance on projection [5]. In our previous studies [6,21], we used two dimensional GC coupled with TOFMS (GC × GC–TOFMS) to elucidate the corre-lations of volatile metabolites with organoleptic properties inginjosake by means of a check-all-that-apply (CATA) method and a quantitative descriptive analysis (QDA). These nascent metabolomics studies of sake have facilitated the examination of the methodologies used to investigate the associations between the components and organoleptic properties of sake. In addition, some relevant relationships between the components and organoleptic properties of sake have also been unveiled. However, the important enigma regarding the sake metabolites
mass spectrometry; GC–MS, gas chromatography coupled with mass spectrometry; MALDI, matrix-assisted laser desorption-ionization; GSH, glutathione; GSSG, oxiglutathione; HMT, Human Metabolome Technologies; KLH, keyhole limpet hemocyanin; PCA, Principal component analysis; PepA, Acid protease; QDA, quantitative descriptive analysis; TCA, tricarboxylic acid; TPI1,
that are involved in the generation of off-flavors as well those present or absent in higher qual-ityginjosake remains to be deciphered.
In addition to metabolomics, targeted protein and proteomics analyses of wine [27,28], beer [29–35], and their corresponding ingredients such as grape [36–39], barley [29–32,34], wheat [33], and yeast [31,40–43], have progressed recently as well. Metabolites contained in fermented alcoholic beverages are thought to be highly associated with the protein entities that are leaked to the product from corresponding ingredients and microorganisms. Therefore, an approach that integrates the results of protein analysis into those of the metabolome is particu-larly effective for sake metabolite research.
In this study, we performed a correlation analysis of the polar metabolites inginjosake as analyzed using CE–TOFMS with the organoleptic properties (quality and off-flavor) ofginjo
sake. Compounds in the central metabolic pathway, glutathione pathway, vitamin B6, and
amino acid catabolites were associated withginjosake quality, whereas medium-chain fatty acids and compounds in the methionine salvage pathway were correlated with an unpleasant fatty acid odor. Polyamines were highly correlated with an unpleasant inharmonious bitter taste. Because some low qualityginjosake contained higher amount of metabolites, protein analysis was performed to clarify whether the protein profile was associated with the metabolite level.
Materials and Methods
Materials
Thirteen premium Japanese sake samples brewed fromYamadanishikirice cultivar were selected from Annual National New Sake Awards entries (National Research Institute of Brew-ing (NRIB) competition, 2011), as described previously [6]. For glucose quantification, a Wako glucose kit (Wako Pure Chemical Industries Ltd., Osaka, Japan) was used. For pyruvic acid quantification, F-kit pyruvate 8000J was purchased from J.K. International Inc. (Tokyo, Japan). Coomassie brilliant blue (CBB) R-250 was purchased from Nacalai Tesque Inc. (Kyoto, Japan). Other chemicals were purchased from Wako Pure Chemical Industries Ltd.
Sensory Evaluations
Sensory evaluations were performed by 15 well-trained panelists as described in a Japanese gov-ernment report [44]. The“taste quality”and“flavor quality”were evaluated using a 5-point scale.
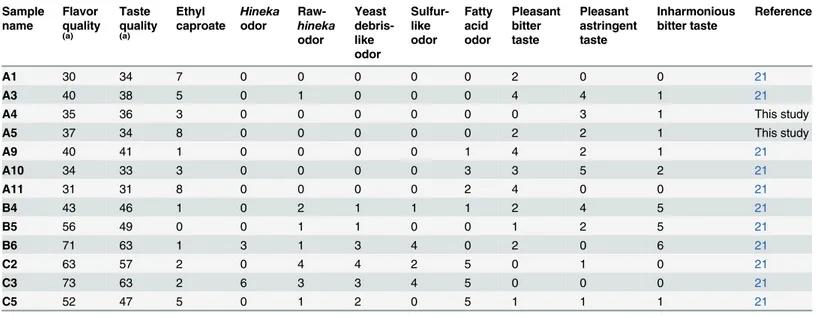
Identification of specific organoleptic properties (fatty acid odor, inharmonious bitter taste, yeast debris-like odor, sulfur-like odor, and“koji”(rice mold) odor) was determined based on an assessment of their presence or absence in a sample using a CATA survey [45–47]. The number of notations of the presence of each factor was used as an index of intensity (Table 1).
Sample Collection and Preparation for CE
–
TOFMS Metabolomics
Analysis
Japaneseginjosake (80μL) was mixed with 20μL of 1,000μM internal standard solution 1
(Solution ID: H3304-1002, Human Metabolome Technologies (HMT), Tsuruoka, Japan). Then, the mixture was centrifugally filtered through a Millipore 5-kDa cutoff filter to remove proteins for 60 min at 9,100 ×gand 4°C. The flow-through fraction was diluted to 2 and 5 fold by water for cation and anion mode analysis, respectively.
CE
–
TOFMS Metabolomics Analysis
adapter kit, and Agilent G1607A CE–ESI–MS sprayer kit (Agilent Technologies, Waldbronn, Germany). The system was controlled by Agilent G2201AA ChemStation software version B.03.01 for CE (Agilent Technologies).
Cationic metabolites were analyzed with a fused silica capillary (50μm i.d. × 80cm total
length), with commercial cation electrophoresis buffer (Solution ID: H3301-1001, HMT) as the electrolyte. The sample was injected at a pressure of 50 mbar for 10s (approximately 10nL). The applied voltage was set at 27kV. Electrospray ionization–MS (ESI–MS) was conducted in the positive ion mode, and the capillary voltage was set at 4,000 V. The spectrometer was scanned fromm/z50 to 1,000.
Anionic metabolites were analyzed with a fused silica capillary (50μm i.d. × 80 cm total
length), with commercial anion electrophoresis buffer (Solution ID: H3302-1021, HMT) as the electrolyte. The sample was injected at a pressure of 50 mbar for 25s (approximately 25nL). The applied voltage was set at 30kV. ESI–MS was conducted in the negative ion mode, and the capillary voltage was set at 3,500 V. The spectrometer was scanned fromm/z50 to 1,000.
Two independent CE–TOFMS analyses were examined. For quantitative analysis of the major compounds of the central metabolites pathway, each compound was calibrated by one-point using a 100μM standard.
Data Analysis
Raw data obtained by CE–TOFMS were processed with MasterHands [48]. Signal peaks corre-sponding to isotopomers, adduct ions, and other product ions of known metabolites were excluded, and all signal peaks potentially corresponding to authentic compounds were
extracted, and then their migration time (MT) was normalized using those of the internal stan-dards. Thereafter, the alignment of peaks was performed according to them/zvalues and nor-malized MT values. Finally, peak areas were nornor-malized against those of the internal standards, methionine sulfone and cyclosporin A for cations and anions, respectively. Annotation tables were produced from the CE–ESI–TOFMS measurements of standard compounds, and were Table 1. The quality score and the number of counts ofginjosake by 15 sensory evaluation panelists.
Sample name Flavor quality (a) Taste quality (a) Ethyl caproate Hineka odor Raw-hineka odor Yeast debris-like odor Sulfur-like odor Fatty acid odor Pleasant bitter taste Pleasant astringent taste Inharmonious bitter taste Reference
A1 30 34 7 0 0 0 0 0 2 0 0 21
A3 40 38 5 0 1 0 0 0 4 4 1 21
A4 35 36 3 0 0 0 0 0 0 3 1 This study
A5 37 34 8 0 0 0 0 0 2 2 1 This study
A9 40 41 1 0 0 0 0 1 4 2 1 21
A10 34 33 3 0 0 0 0 3 3 5 2 21
A11 31 31 8 0 0 0 0 2 4 0 0 21
B4 43 46 1 0 2 1 1 1 2 4 5 21
B5 56 49 0 0 1 1 0 0 1 2 5 21
B6 71 63 1 3 1 3 4 0 2 0 6 21
C2 63 57 2 0 4 4 2 5 0 1 0 21
C3 73 63 2 6 3 3 4 5 0 0 0 21
C5 52 47 5 0 1 2 0 5 1 1 1 21
(a)Low score means high quality
aligned with the datasets according to similarm/zvalues and normalized MT values. The com-pounds that had statistically invalid area deviations by ANOVA (F value<2, n = 13, 2) were excluded from further analysis. Principal component analysis (PCA) and correlation analyses were conducted using JMP version 10.0.2 (SAS Institute Inc., Cary, NC, USA).
Polyclonal Antibodies
An anti-S.cerevisiaetriosephosphate isomerase 1 (TPI1) antibody produced in a rabbit (LS-C147663) was purchased from LifeSpan BioSciences, Inc. (Seattle, WA, USA).
An anti-glucoamylase antibody was generated against the keyhole limpet hemocyanin (KLH)-conjugated synthetic peptides as cysteine + 114−127 amino acid sequence ofA.oryzae
glucoamylase GlaB (C+NEQAVSNPSGGLSD) from accession number BAA25205 [49]. The
GlaB epitope sequence has some similarity with the 114–127 amino acid sequence of GlaA (accession number, P36914) [50]. An anti-α-amylase antibody was generated against the
KLH-conjugated synthetic peptides as cysteine + 354−367 amino acid sequence ofA.oryzaeα
-amy-lase, AmyA, AmyB, and AmyC, (C+QHYAGGNDPANREA) from accession number CAA31220
[51]. An anti-PepA antibody was generated against the KLH-conjugated synthetic peptides as cysteine + 236−254 amino acid sequence ofA.oryzaeacid protease, PepA (
C+-KYHAPGSYDFGFIDKSKFT) from accession number BAA02994 [52]. All three antibodies were raised in rabbits. After sampling each serum, IgG were purified by affinity chromatogra-phy using corresponding synthetic peptide conjugated columns. The generated antibodies were subdivided and kept at−80°C until thawed.
Acetone Protein Precipitation
To cleave theN-linked glycosylation of proteins in sake, 1 mL sake was mixed with 1μL PNGase
F (500 U: New England Biolabs Japan, Tokyo, Japan) and incubated for 2 h at 0°C. PNGase F treated or untreated sake (1 mL) was mixed with an equal amount of acetone and kept at−80°C overnight. Following removal of the supernatant after centrifugation at 17,000 ×gfor 15 min, the precipitate was suspended in 40μL solubilizing buffer containing 4 M urea, 6% SDS, 50 mM
Tris-HCl (pH 6.8), 20% glycerol, and 2% DTT. After addition of 10μL 5× Ling’s solubilizing
buffer (50 mM Tris-HCl (pH 8.0), 5 mM EDTA, 10% SDS, 200 mM DTT, and 50% sucrose), protein was denatured at 50°C for 15 min. Then, 50μL 2× urea buffer (10 M urea, 40 mM DTT,
10 mM Tris-HCl (pH 8.0), 1 mM EDTA, 2% SDS, and 10% sucrose) was added to the sample.
SDS-PAGE and Immunoblot Analysis
SDS-PAGE was performed in 15% polyacrylamide gel (ATTO, Tokyo, Japan) with a size marker (Bio-Rad Laboratories, Hercules, MA, USA). After separation, proteins on the gel were stained with 0.1% CBB R-250. Then, the gel was destained at least for 12 h, and directly scanned using an EPSON GT 900 (Nagano, Japan).
For immunoblot analysis, following SDS-PAGE in 10% polyacrylamide gel (ATTO), pro-teins were transferred to a 0.22μm pore PVDF membrane (Whatman) at 12 V, 60 mA, for 30
Protein Identification in
Ginjo
Sake by MALDI
–
TOF/TOF
The gel pieces for spots of interest were obtained from 15% SDS-PAGE gels (ATTO) and digested in-gel using trypsin (Proteomics Sequencing Grade; Sigma, St. Louis, MO, USA) fol-lowing destaining of CBB. Protein identification in the precipitates ofginjosake was performed by using an Ultraflex TOF/TOF matrix-assisted laser desorption-ionization TOFMS system (MALDI–TOFMS: Bruker Daltonics, Billerica, MA, USA). Parameters for the analysis were as follows; mode of operation, reflection positive; accelerating voltage, 25 kV; acquisition mass range, 800–3,500 Da; MALDI matrix,α-cyano-4-hydroxycinnamic acid; calibration, external.
The peptide fragment ion data obtained by MALDI–TOF/TOF were searched against the NCBI database of the origin toS.cerevisiae,A.oryzae, andO.sativausing Mascot software (Matrix Science, London, UK).
Results
Metabolomics of
Ginjo
Sake Using CE
–
TOFMS
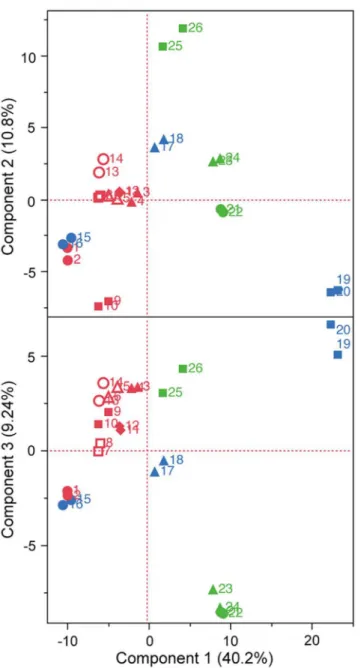
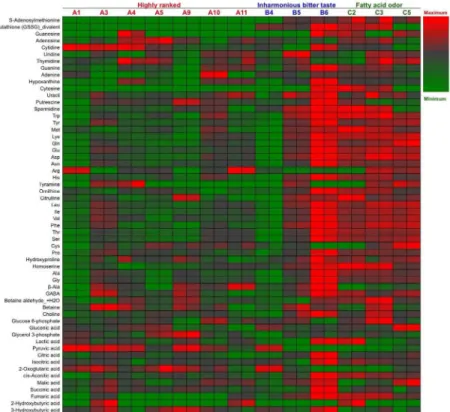
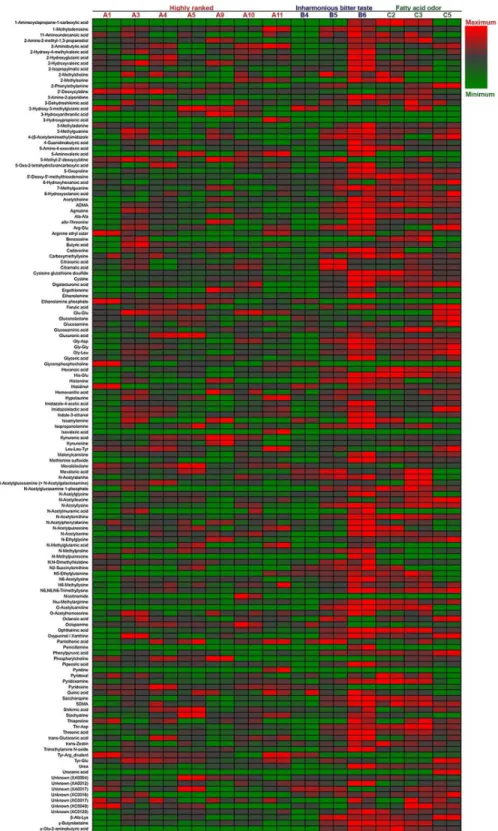
The polar metabolites in 13 Japaneseginjosake (refined rice wine) samples were analyzed by CE–TOFMS. From this, 156 cationic compounds, 62 anionic compounds, and up to 218 pounds in total were detected and annotated. Following exclusion of a small number of com-pounds by ANOVA calculations of Fisher ratios (F>2, n = 13, 2), 202 compounds (148 cationic and 54 anionic, including unknown compounds) were further analysis by PCA. As shown inFig 1, PCA showed that all 7 higher ranked sake were located to the left on the x-axis according to component 1, and 5 of 6 off-flavored low quality sake were located to the right, some of which were excessive. The metabolite containing patterns of sake samples A1 and B4 were similar. The heatmaps of polar metabolites are depicted in Figs2and3, according to quantitative and relative values, respectively. Notably, the metabolite patterns of higher ranked sake were considerably different among the samples, suggesting diversity of taste and flavor among higher ranked sake. Apparently, some off-flavored sake (B6, C2, C3, C5), particularly sample B6, contained higher amounts of metabolites in total compared to other sake samples. This suggests that some off-flavored sake, which has relatively higher yeast debris-like odor and sulfur-like odor indices (Table 1), is apt to contain a large number of metabolites. The dif-ferences of metabolite containing patterns as shown in the heatmaps were corroborated by PCA inFig 1. In addition, the similarity of metabolite patterns between A1 and B4 seen by PCA was also corroborated by the heatmaps in Figs2and3.
Correlations of Metabolites with
Ginjo
Sake Quality
fumaric acid, gamma-butyrobetaine, ophthalmic acid, Thr-Asp, homoserine, saccharopine, Trp, His-Glu, 50-deoxy-50-methylthioadenosine, oxiglutathione (GSSG), Glu, cysteine glutathi-one disulfide, ornithine, pyridoxamine, and many amino acids except for arginine (Table 2).
Metabolite Patterns in
Ginjo
Sake in the Central Metabolic Pathway
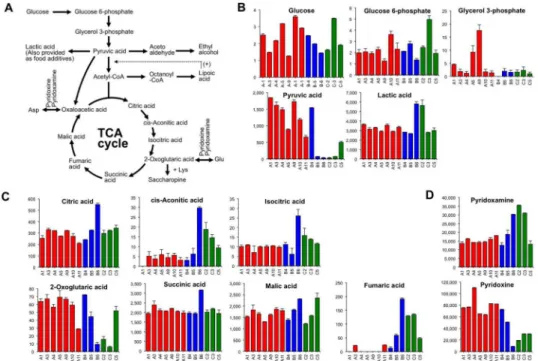
The metabolites of the central metabolic pathway in eachginjosake sample are shown inFig 4. The content patterns of glucose and glucose 6-phosphate, which occur during the earlier stage of the glycolytic pathway, were similar (Fig 4B), whereas compounds at the later stage, Fig 1. Principal component analysis (PCA) of Japanese sake.After selecting 202 compounds using Fisher ratio criteria, PCA was performed for 13 sake samples in duplicate. Same symbols indicate the same sake samples. Highly ranked sake (n = 7) are shown in red, sake with fatty acid odor (n = 3) are shown in green, and inharmonious bitter tasting sake (n = 3) are shown in blue.including glycerol 3-phosphate, pyruvic acid, and lactic acid varied among sake samples. The level of pyruvic acid was extremely low in off-flavored sake, except for sample B4 and C5. Pyru-vic acid is the last compound of the glycolytic pathway as well as an intermediate of alcoholic fermentation inS.cerevisiae(Fig 4A). Notably, the concentration of pyruvic acid inginjosake is strongly correlated with sake flavor and taste quality (Table 2). An extreme diminishing of pyruvic acid was found in some off-flavored sake (Fig 4B), suggesting that part of the genera-tion of a specific off-flavor is correlated to pyruvic acid loss, and that this can be attributed to marked deterioration in yeast activity.
As depicted inFig 4A, lactic acid is generally added to the modern yeast starter ofginjosake (shubo). The lactic acid levels were almost the same in eleven sake samples; however, the con-centration was clearly higher in the B6 and C2 sake samples.
Fig 4Cshows the pattern of sake metabolites from the tricarboxylic acid (TCA) cycle. Levels of bothcis-aconitic acid and isocitric acid, which are related to the TCA cycle, were higher in some off-flavored sake (Fig 4C). The content pattern ofcis-aconitic acid and isocitric acid was quite similar in sake (Fig 4C). Notably, the content patterns of 2-oxoglutaric acid (α
-ketogluta-rate) and fumaric acid were completely different; a higher concentration of 2-oxoglutaric acid was found in high quality sake, and a higher concentration of fumaric acid was found in low quality sake (Fig 4C). Similarly, levels of pyridoxine and pyridoxamine, both of which are co-enzymes for amino transferase and are generally called vitamin B6, were also highly correlated
withginjosake quality albeit in opposite directions (Fig 4D).
Fig 2. Quantified heatmap for the major metabolites of 13 sake samples.Heatmap showing the quantified metabolic profiles of 13 sake samples (7 of highly ranked sake, 3 of inharmonious bitter tasting sake, and 3 of sake with fatty acid odors) analyzed in duplicate. Maximum to minimum level is represented by a red-gray-green color scheme.
Fig 3. Relative heatmap for the metabolites of 13 sake samples.Heatmap showing the metabolic profiles of 13 sake samples (7 of highly ranked sake, 3 of inharmonious bitter tasting sake, and 3 of sake with fatty acid odors) analyzed in duplicate. Maximum to minimum level is represented by a red-gray-green color scheme. The values ofm/zof the unknown compounds XA0004, XA0012, XA0017 are 144.0292, 166.0154, and 186.1124, respectively, by the anion detection mode. The values ofm/zof the unknown compounds XC0016, XC0017, XC0040, and XC0120 are 129.0646, 130.0977, 174.0861, and 298.0518, respectively, by the cation detection mode.
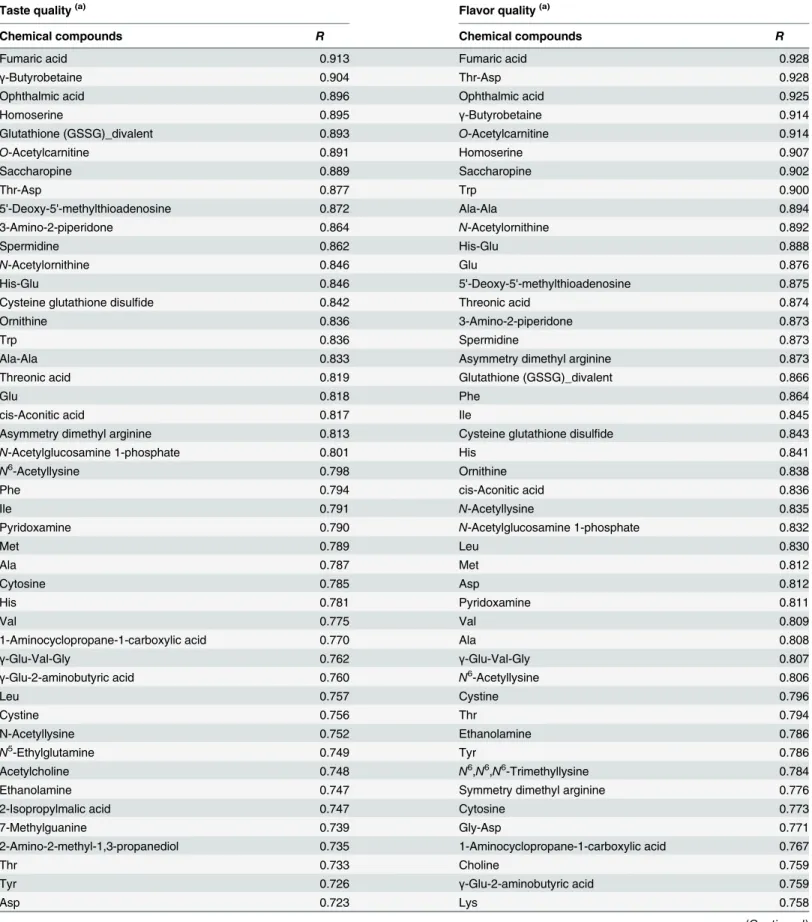
Table 2. Chemical compounds whose levels were positively or negatively correlated with either taste or flavor quality.
Taste quality(a) Flavor quality(a)
Chemical compounds R Chemical compounds R
Fumaric acid 0.913 Fumaric acid 0.928
γ-Butyrobetaine 0.904 Thr-Asp 0.928
Ophthalmic acid 0.896 Ophthalmic acid 0.925
Homoserine 0.895 γ-Butyrobetaine 0.914
Glutathione (GSSG)_divalent 0.893 O-Acetylcarnitine 0.914
O-Acetylcarnitine 0.891 Homoserine 0.907
Saccharopine 0.889 Saccharopine 0.902
Thr-Asp 0.877 Trp 0.900
5'-Deoxy-5'-methylthioadenosine 0.872 Ala-Ala 0.894
3-Amino-2-piperidone 0.864 N-Acetylornithine 0.892
Spermidine 0.862 His-Glu 0.888
N-Acetylornithine 0.846 Glu 0.876
His-Glu 0.846 5'-Deoxy-5'-methylthioadenosine 0.875
Cysteine glutathione disulfide 0.842 Threonic acid 0.874
Ornithine 0.836 3-Amino-2-piperidone 0.873
Trp 0.836 Spermidine 0.873
Ala-Ala 0.833 Asymmetry dimethyl arginine 0.873
Threonic acid 0.819 Glutathione (GSSG)_divalent 0.866
Glu 0.818 Phe 0.864
cis-Aconitic acid 0.817 Ile 0.845
Asymmetry dimethyl arginine 0.813 Cysteine glutathione disulfide 0.843
N-Acetylglucosamine 1-phosphate 0.801 His 0.841
N6-Acetyllysine 0.798 Ornithine 0.838
Phe 0.794 cis-Aconitic acid 0.836
Ile 0.791 N-Acetyllysine 0.835
Pyridoxamine 0.790 N-Acetylglucosamine 1-phosphate 0.832
Met 0.789 Leu 0.830
Ala 0.787 Met 0.812
Cytosine 0.785 Asp 0.812
His 0.781 Pyridoxamine 0.811
Val 0.775 Val 0.809
1-Aminocyclopropane-1-carboxylic acid 0.770 Ala 0.808
γ-Glu-Val-Gly 0.762 γ-Glu-Val-Gly 0.807
γ-Glu-2-aminobutyric acid 0.760 N6-Acetyllysine 0.806
Leu 0.757 Cystine 0.796
Cystine 0.756 Thr 0.794
N-Acetyllysine 0.752 Ethanolamine 0.786
N5-Ethylglutamine 0.749 Tyr 0.786
Acetylcholine 0.748 N6,N6,N6-Trimethyllysine 0.784
Ethanolamine 0.747 Symmetry dimethyl arginine 0.776
2-Isopropylmalic acid 0.747 Cytosine 0.773
7-Methylguanine 0.739 Gly-Asp 0.771
2-Amino-2-methyl-1,3-propanediol 0.735 1-Aminocyclopropane-1-carboxylic acid 0.767
Thr 0.733 Choline 0.759
Tyr 0.726 γ-Glu-2-aminobutyric acid 0.759
Asp 0.723 Lys 0.758
Correlations of Metabolites with a Low Quality of Sake
Representative metabolites that were found at a higher amount in low quality sake and their relevant compounds are shown inFig 5. Levels of methionine,S-adenosylmethionine, and 50 -deoxy-50-methylthioadenine, which are some typical compounds in the methionine salvage cycle, were elevated in low quality sake (Fig 5A and 5B). Therefore, compounds in the methio-nine salvage cycle are expected to be involved inginjosake quality.
Table 2. (Continued)
Taste quality(a) Flavor quality(a)
Chemical compounds R Chemical compounds R
Asn 0.721 Asn 0.753
N6,N6,N6-Trimethyllysine 0.715 N5-Ethylglutamine 0.750
Glucosaminic acid 0.715 5-Oxoproline 0.748
Gly 0.708 Pro 0.748
Symmetry dimethyl arginine 0.707 Ser 0.747
5-Oxoproline 0.704 2-Amino-2-methyl-1,3-propanediol 0.740
Pro 0.703 Gly 0.738
Acetylcholine 0.732
7-Methylguanine 0.724
2-Isopropylmalic acid 0.717
Nω-Methylarginine 0.710
Shikimic acid -0.206
3-Hydroxyanthranilic acid -0.207
Glycerol 3-phosphate -0.212
Phosphorylcholine -0.226
Arg -0.244
Hypotaurine -0.266
5-Methyl-2'-deoxycytidine -0.276
Nicotinamide -0.277
Glycerophosphocholine -0.287
N-Methylglutamic acid -0.290
3-Hydroxypropionic acid -0.327
Isovaleric acid -0.327
Pyridine -0.327 Glycerophosphocholine -0.392
Ethanolamine phosphate -0.409 Tyr-Glu -0.392
Tyr-Glu -0.475 Ethanolamine phosphate -0.510
2'-Deoxycytidine -0.527 2'-Deoxycytidine -0.546
Tyr-Arg_divalent -0.619 Mevalolactone -0.632
Mevalolactone -0.670 Leu-Leu-Tyr -0.643
Leu-Leu-Tyr -0.682 Tyr-Arg_divalent -0.675
Pyruvic acid -0.712 Octopamine -0.728
Octopamine -0.724 Glu-Glu -0.753
2-Oxoglutaric acid -0.733 2-Oxoglutaric acid -0.772
Glu-Glu -0.783 Pyruvic acid -0.801
Pyridoxine -0.861 Pyridoxine -0.879
(a)Negative value of correlation coef
ficient shows high quality.
Fig 4. Patterns of identified metabolites from the central metabolic pathway of the sake yeast,
Saccharomyces cerevisiae.A) A typical schematic for the central metabolic pathway. In the sake brewing process, lactic acid can be also added as a food additive at an early stage of the yeast starter making process. Alpha-lipoic acid can facilitate acetyl-CoA production with vitamin B1. B) The concentrations of the
indicated chemical compounds involved in the glycolytic pathway in sake. Highly ranked sake, inharmonious bitter tasting sake, and sake with fatty acid odor are shown in red, blue, and green, respectively. Glucose is shown as a percentage (n = 4). Glucose 6-phosphate, glycerol 3-phosphate, pyruvic acid, and lactic acid are shown asμmol/L (n = 2). C) The concentrations of the indicated chemical compounds involved in the tricarboxylic acid (TCA) cycle in sake. All metabolites are shown asμmol/L (n = 2). D) The relative values of pyridoxamine and pyridoxine (n = 2). Data are shown as means±SEM.
doi:10.1371/journal.pone.0150524.g004
Fig 5. The patterns of representative metabolites associated with sake quality.A) Compounds involved in the methionine cycle. 50-deoxi-50-methylthioadenosine is shown as relative value.S-Adenosylmethionine and methionine are shown asμmol/L. B) A simple summarization of the methionine cycle pathway. C) Compounds involved in glutathione or ophthalmic acid biosynthesis pathways. Cysteine and glutathione (GSSG; oxiglutathione) are shown asμmol/L. Gamma-glutamyl-2-aminobutyric acid, ophthalmic acid, and cysteine glutathione disulfide are shown as relative values. D) The metabolites that participate in part of the glutathione (GSH) and ophthalmic acid biosynthesis pathways. E) Other amino acid-related chemical compounds associated with lower sake quality. Saccharopine and cystine are shown as relative values. Homoserine is shown asμmol/L. Data are shown as means±SEM (n = 2).
Compounds related to oxidized glutathione (i.e. GSSG, cysteine glutathione disulfide,γ
-Glu-aminobutyric acid, and ophthalmic acid) but not to glutathione (GSH) were higher in some low quality sake (Fig 5C). Cysteine, a substrate for cysteine glutathione disulfide, could not be detected in B6 and C2 sake samples, which contained higher amounts of cysteine gluta-thione disulfide (Fig 5C), suggesting that cysteine was consumed to produceγ-Glu-Cys and
cysteine glutathione disulfide (Fig 5D).
Other amino acid-related chemical compounds associated with low sake quality are shown inFig 5E. The level of saccharopine, which consists of compounds derived from lysine and 2-oxoglutaric acid, and which was previously found in red wine [53], was higher in low quality sake (Fig 5E). The level of 2-oxoglutaric acid was lower in low-quality sake samples B6, C2, and C3, suggesting that a portion of 2-oxoglutaric acid could be utilized for saccharopine biosyn-thesis. The profile of homoserine was similar to that of saccharopine (Fig 5E). Cystine, the disulfide bonded form of cysteine, was slightly higher in low quality sake (Fig 5E).
Correlations of Metabolites with Sake Off-Flavor
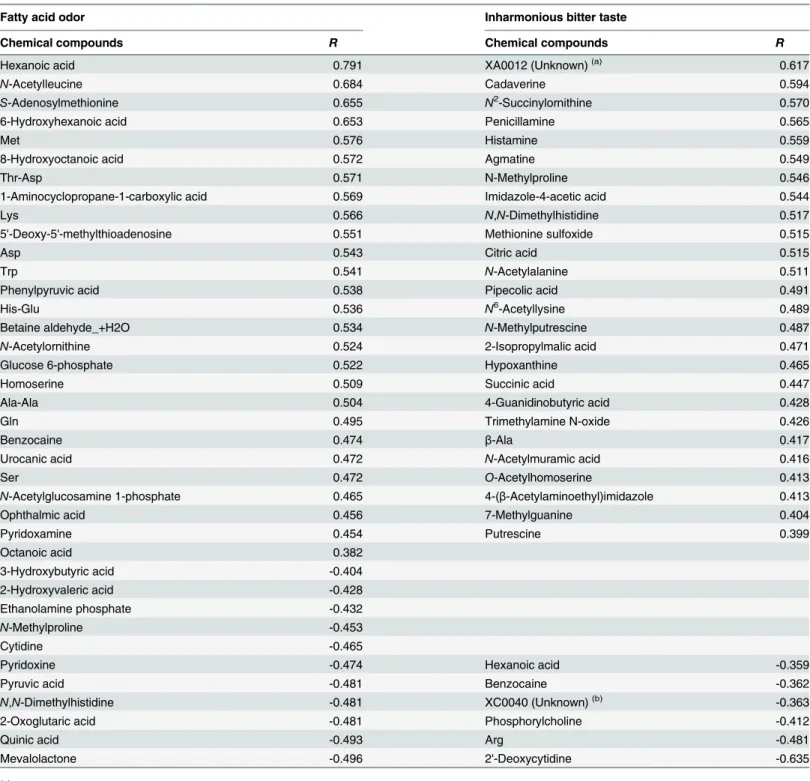
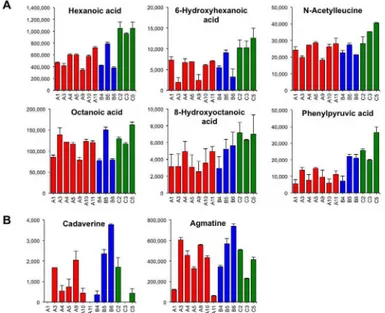
We have reported that the CATA method of sensory evaluation can be applied to provide insight into the correlation analysis between the chemical compounds in sake and its organo-leptic properties including off-flavor [6,21]. Therefore, a correlation analysis was performed between sake metabolite levels and off-flavor (fatty acid odor and inharmonious bitter taste) according to the scores shown inTable 1. Compounds that were positively correlated with fatty acid odor included medium-chain fatty acids related compounds such as hexanoic acid,N -acetylleucine, 6-hydroxyhexanoic acid, 8-hydroxyoctanoic acid, and phenylpyruvic acid, as well as compounds associated with the methionine salvage cycle such asS-adenosylmethionine, methionine, and 50-deoxy-50-methylthioadenine (Table 3). Consistent with a previous report using GC [6], hexanoic acid was highly correlated with a fatty acid odor ofginjosake. The con-tent pattern of these compounds is shown inFig 6A. Compounds that were negatively corre-lated with fatty acid odor were mevalolactone, quinic acid, 2-oxoglutaric acid,N,N
-dimethylhistidine, and pyruvic acid (Table 3).
Compounds that were positively correlated with inharmonious bitter taste included many polyamines such as cadaverine, agmatine,N-methylputrescine, and putrescine, as well as monoamines such as penicillamine and histamine, whereas Arg was negatively correlated (Table 3). In addition, several nucleic acid derivatives weakly correlated with inharmonious bit-ter taste. This result suggests that polyamines and amine-related compounds might be involved in an inharmonious bitter taste ofginjosake.
In addition to fatty acid odor and inharmonious bitter taste, we performed correlation anal-ysis between sake metabolites and“koji-like odor.”Citric acid,cis-aconitic acid, and isocitric acid, which are metabolites in TCA cycle, were positively correlated to“koji-like odor”(data not shown). SomeAspergillusspecies [54,55] and sporulatingBacillus subtilis[56,57] are known as being strong citric acid producers, suggesting that those tricarboxilic acids are also biomarkers forA.oryzaeand might be increased by an enhancement of conidiation at the last stage of the rice mold making process.
Table 3. Chemical compounds whose levels were positively or negatively correlated with the off-flavors of either fatty acid odor or inharmonious bitter taste.
Fatty acid odor Inharmonious bitter taste
Chemical compounds R Chemical compounds R
Hexanoic acid 0.791 XA0012 (Unknown)(a) 0.617
N-Acetylleucine 0.684 Cadaverine 0.594
S-Adenosylmethionine 0.655 N2-Succinylornithine 0.570
6-Hydroxyhexanoic acid 0.653 Penicillamine 0.565
Met 0.576 Histamine 0.559
8-Hydroxyoctanoic acid 0.572 Agmatine 0.549
Thr-Asp 0.571 N-Methylproline 0.546
1-Aminocyclopropane-1-carboxylic acid 0.569 Imidazole-4-acetic acid 0.544
Lys 0.566 N,N-Dimethylhistidine 0.517
5'-Deoxy-5'-methylthioadenosine 0.551 Methionine sulfoxide 0.515
Asp 0.543 Citric acid 0.515
Trp 0.541 N-Acetylalanine 0.511
Phenylpyruvic acid 0.538 Pipecolic acid 0.491
His-Glu 0.536 N6-Acetyllysine 0.489
Betaine aldehyde_+H2O 0.534 N-Methylputrescine 0.487
N-Acetylornithine 0.524 2-Isopropylmalic acid 0.471
Glucose 6-phosphate 0.522 Hypoxanthine 0.465
Homoserine 0.509 Succinic acid 0.447
Ala-Ala 0.504 4-Guanidinobutyric acid 0.428
Gln 0.495 Trimethylamine N-oxide 0.426
Benzocaine 0.474 β-Ala 0.417
Urocanic acid 0.472 N-Acetylmuramic acid 0.416
Ser 0.472 O-Acetylhomoserine 0.413
N-Acetylglucosamine 1-phosphate 0.465 4-(β-Acetylaminoethyl)imidazole 0.413
Ophthalmic acid 0.456 7-Methylguanine 0.404
Pyridoxamine 0.454 Putrescine 0.399
Octanoic acid 0.382
3-Hydroxybutyric acid -0.404
2-Hydroxyvaleric acid -0.428
Ethanolamine phosphate -0.432
N-Methylproline -0.453
Cytidine -0.465
Pyridoxine -0.474 Hexanoic acid -0.359
Pyruvic acid -0.481 Benzocaine -0.362
N,N-Dimethylhistidine -0.481 XC0040 (Unknown)(b) -0.363
2-Oxoglutaric acid -0.481 Phosphorylcholine -0.412
Quinic acid -0.493 Arg -0.481
Mevalolactone -0.496 2'-Deoxycytidine -0.635
(a)Them/zis 166.0154 by anion detection mode. (b)Them/zis 174.0855 by cation detection mode.
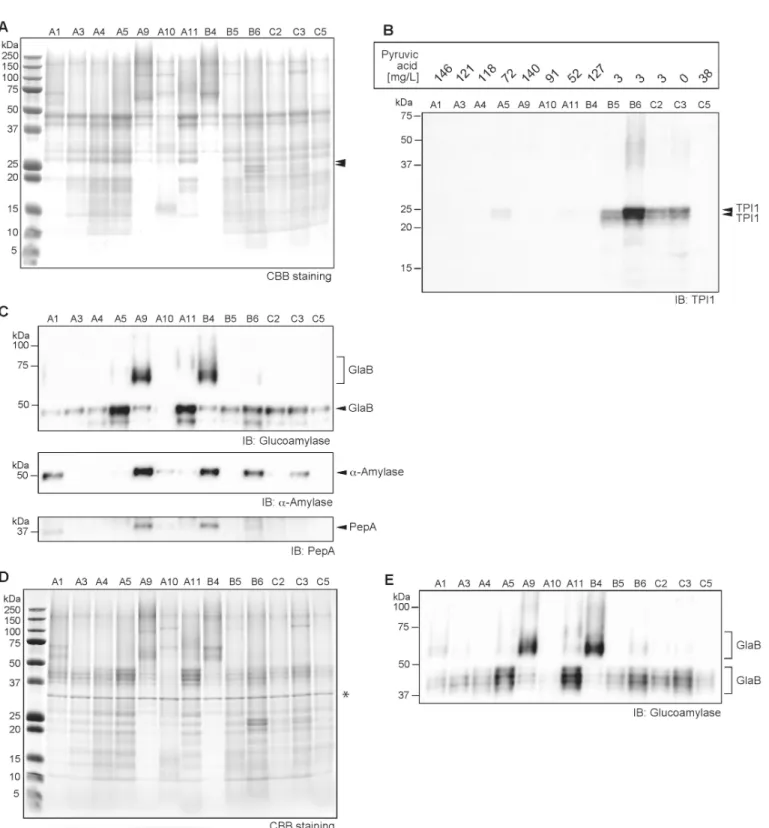
inFig 7A, proteins in sake were found to exhibit diversity as seen for the metabolites, with some resemblances among sake. It was difficult to identify an overall apparent correlation between metabolites and protein profiles. Nevertheless, distinct protein bands located at 23 and 25 kDa were found in sake samples B5, B6, C2, and C3 (Fig 7A). The intensity of these two bands was strongest in sake sample B6, which is consistent with its metabolite level. To identify these two protein bands, MALDI-TOFMS analysis was performed. Both of these proteins were clearly identified asS.cerevisiaetriosephosphate isomerase (TPI), which catalyzes the isomeri-zation of a dihydroxyacetone phosphate to D-glyceraldehyde-3-phosphate in the glycolytic pathway. For further confirmation, we performed an immunoblot assay using a yeast TPI1-s-pecific antibody as shown inFig 7B. The results clearly indicated that the two bands located at 23 and 25 kDa for sake samples B5, B6, C2, and C3 were TPI polypeptides. The TPI detection level was strongly correlated with yeast debris-like odor and sulfur-like odor indices (Table 1). The pyruvic acid concentration in the sake samples was negatively correlated with TPI detec-tion level (Fig 7B). Both dihydroxyacetone phosphate and D-glyceraldehyde-3-phosphate were not detected in the metabolome analysis. However, these results still clearly suggest that the leakage of one or more yeast intracellular proteins is associated with the abundance of metabo-lites in sake, which are also associated with lower quality of the final product.
The presence of major enzymes was analyzed by immunoblotting as shown inFig 7C. As expected, we detectedα-amylase and glucoamylase, both of which are produced by the rice
moldA.oryzaein sake; however, unexpectedly, their contents exhibited large differences among sake samples (Fig 7C). Two major bands, a clear band at 47 kDa and a blurred band at 65–80 kDa, were detected for glucoamylase. To identify the protein band at 47 kDa and the blurred band at 65–80 kDa, MALDI-TOFMS analysis was performed. Both protein bands were identified asA.oryzaeGlaB, and not GlaA. The GlaB is composed of a 493 amino-acid poly-peptide [49], and its modification withN-linked glycosylation has been experimentally con-firmed (Fig 7A, 7C, 7D and 7E). Theα-amylase detection level was similar to that of the
Fig 6. Chemical compounds contributing to fatty acid odor and inharmonious bitter taste.A)
Representative chemical compounds involved in fatty acid odor generation are medium-chain fatty acids and medium-chain fatty acid analogues. B) Two representative polyamines (cadaverine and agmatine) involved in inharmonious bitter taste generation. All chemical compounds are shown as relative values. Data are shown as means±SEM (n = 2).
Fig 7. Protein profiles of 13 sake samples showing that yeast cellular protein leakage is linked to low sake quality.A) Overall protein profiling by Coomassie brilliant blue (CBB) staining after SDS-PAGE. For each sample, 10μL of denatured protein was applied to a lane, and 5μL of marker was utilized. Protein bands indicated by double black triangles areSaccharomyces cerevisiaetriosephosphate isomerase (TPI). B) Immunoblot analysis forS.cerevisiae TPI1 in sake. Pyruvic acid concentrations in sake (n = 2) determined by colorimetric assay is shown in the upper rectangle. C)Upper panel; Immunoblot analysis for glucoamylase (GlaB) derived fromAspergillus oryzaein sake. TheN-glycosylated forms of GlaB were detected at 47 kDa and as a blurred band beyond 65 kDa.Middle panel; Immunoblot analysis forα-amylase.Lower panel; Immunoblot analysis for the acid protease, PepA. D) Protein profiling following PNGaseF treatment by CBB staining after SDS-PAGE. For each sample, 10μL of denatured protein was applied to a lane, and 5μL of marker was applied. The asterisk at 34 kDa shows PNGaseF. E) Immunoblot analysis for glucoamylase (GlaB) following PNGaseF treatment of sake. The blurred band and multiple bands at 55–70 kDa and 37–50 kDa correspond to GlaB.
blurred 65–80 kDa band of GlaB (Fig 7C). The level of glucoamylase digestible dextrin and gosaccharides in sake quantified by the colorimetric method indicated that the dextrin and oli-gosaccharide components were not associated with the residual GlaB andα-amylase levels in
sake (data not shown). Acid protease (PepA) is a major endo-type protease that is also pro-duced byA.oryzaeduring the middle stage of the rice mold-making process [58]. PepA levels were weakly correlated with the blurred 65–80 kDa band of GlaB andα-amylase in sake (Fig
7C), and the signal pattern was similar to that ofα-amylase.
Discussion
The relationship between the chemical compounds in sake and its organoleptic properties has been demonstrated recently utilizing the newly evolved metabolomic instrumentation and technologies. Previously, we had focused on premiumginjosake and analyzed the volatile chemical compounds using a GC system. Because we were able to successively apply a simple method for sensory evaluation,“CATA,”to this analysis [6,21], we performed a correlation analysis to evaluate the relationship of polar metabolites inginjosake determined using CE– TOFMS with both overall quality determined using QDA and off-flavors determined using the CATA method. Furthermore, to facilitate an understanding of comprehensive molecular rela-tionships, protein analysis was integrated with polar metabolite analysis. Our results provided important observations regarding the processes ofginjosake brewing.
Table 2andFig 4Bshow the correlation between the metabolites in the central metabolic pathway inginjosake and its organoleptic properties. In the Japanese sake brewery industry, a higher amount of pyruvic acid in the final stage of mash has been thought to lead to increased risk of generation of diacetyl off-flavors in bottled sake. However, in this study, as shown in
Table 2, Figs4Band7B, pyruvic acid was barely detected in some off-flavorginjosake, suggest-ing that pyruvic acid loss is associated with the generation of off-flavors inginjosake. To con-firm the relationship, we performed pyruvic acid quantification using another set of 64ginjo
sake samples (S1 Fig), and analyzed the correlation using sensory quality scores. The correla-tion coefficients between pyruvic acid and sensory quality scores (flavor quality, taste quality, fatty acid odor, yeast debris-like odor, and sulfur-like odor) were−0.26,−0.38,−0.44,−0.45, and−0.28, respectively (data not shown), thus verifying the relationship between pyruvic acid loss and the generation of off-flavors inginjosake. Although this conclusion appears contradic-tory, several reports have presented data supporting this supposition. For example, Ito et al. reported that the concentration of pyruvic acid in the final stage of sake mash fermented using cerulenin-resistanceginjosake yeast tended to sharply decrease to almost 0 mg/L [59]. In addi-tion, Iwano et al. reported that the concentration of pyruvic acid was only slightly, i.e., not sig-nificantly, correlated withginjosake quality (R=−0.188) [25]. Together, these results suggest that forginjosake, pyruvate loss rather than maintenance in the last stage of sake mash could be the critical factor for generation of off-flavors. Therefore, forginjosake brewing, it may be better to stop sake brewing and squeeze within a few days when the pyruvic acid level decreases to 0 mg/L in the final stage of the sake mash.
Unique molecular content patterns were observed for fumaric and 2-oxoglutaric acids, both of which are key metabolites in the TCA cycle (Table 2andFig 4C). 2-Oxoglutaric acid is known as a substrate for inorganic nitrogen assimilation for the conversion to glutamatevia
glutamate dehydrogenase. In turn, glutamate can be a substrate for aminotransferase with other amino acids to produce 2-oxoglutaric acid. Using the laboratory strain ofS.cerevisiae
anaerobic fermentation, such as inginjosake brewing conditions, fumaric acid can be reduced by fumarate reductase to produce succinic acid [61]; however, marked succinic acid variation was not observed in our study (Fig 4C). Overall, the patterns of 2-oxoglutaric acid, fumaric acid, and succinic acid are enigmatic and the research to elucidate their relevance to a physio-logical state is ongoing. Recently, it has been reported that 2-oxoglutaric acid is associated with extended lifespan inCaenorhabditis elegans[62] while fumaric acid is associated with short-ened lifespan in mouse kidney cells [63]. Important roles for 2-oxoglutaric acid and the ratio of 2-oxoglutaric acid/succinic acid in mammalian embryonic stem cells have been also reported [64]. While the roles of these major metabolites in microorganisms includingS.cerevisiaehave not been reported, clues might be provided through analysis of whether their levels are reflected by physiological state of the organism. Further research targeted to these compounds is required to address these issues.
Oxidized glutathione related compounds (i.e. GSSG, cysteine glutathione disulfide,γ
-Glu-aminobutyric acid, and ophthalmic acid) but not GSH were higher in some low quality sake (Fig 5C). InS.cerevisiae,γ-Glu-Cys is synthesized by Glu and CysviaGSH1 [65]. GSH1 can
also catalyze the ligation of Glu and 2-aminobutyric acid (2AB) to produceγ-Glu-2AB because
its homologue inE.coliand mammals,γ-glutamylcysteine synthetase, catalyzes the ligation of
Glu and 2AB [66]. Subsequently,γ-Glu-Cys andγ-Glu-2AB are conjugated with Gly via yeast
GSH2 to produce GSH and ophthalmic acid, respectively (Fig 5D) [67,68]. Ophthalmic acid is known as a compound produced when cells are exposed to oxidative stress that causes a defi-ciency in cysteine molecules [68]. When cells are in a reducing state, GSH is produced, whereas when cells are in an oxidative state, compounds related to oxidized glutathione relatives (i.e., GSSG, cysteine glutathione disulfide,γ-Glu-aminobutyric acid, and ophthalmic acid) would be
produced. Therefore, oxidative stress in microorganisms during the sake brewing process might be associated withginjosake quality.
The correlation of many amino acids with low quality sake has been well known in the field of sake brewing industry, and has been recently supported by metabolomics approaches [3,5,
25]. Consistent with previous reports, in this study, we found that many amino acids and dimethylarginine were correlated with low qualityginjosake, whereas arginine and some types of dipeptides and tripeptides were correlated with high qualityginjosake (Table 2). We previ-ously reported that many varieties and large amounts of dipeptides are contained in sake com-pared to wine and beer by LC–MS analysis [53]. In addition, several cyclic-dipeptides have been correlated with sake quality and a pleasant flavor, ethyl caproate, through GC × GC– TOFMS analysis [21]. These results suggest that some types of dipeptides might be involved in
ginjosake quality. Therefore, future studies should address whether the amount and types of dipeptides in sake are associated with its quality.
In previous studies, we analyzed the volatile compounds of the same sake samples used in this study using a GC system [6,21], but we could not distinguish the metabolite content pat-tern of sake sample B6. In this study, comprehensive polar metabolite analysis by CE–TOFMS was able to reveal that sake sample B6 contained relatively higher amount of metabolites as well as an enhanced variety of metabolites among sake samples (Figs2and3). On the other hand, protein analysis clearly showed that sake sample B6 contained notable protein bands at 23 and 25 kDa (Fig 7A and 7B), which were found to be derived fromS.cerevisiaeTPI. Detec-tion of intracellular TPI in sake by the protein leakage indicates a rise in the ratio of yeast cell death at the last stage of sake mash causing degradation of cell membrane (cell wall). In support of this mechanism, the remarkable reduction of pyruvic acid concentration in someginjosake was associated with an increased TPI level (Fig 7BandS1 Fig). In addition to protein leakage from yeast, the difference of mechanical compression at the last step of sake brewing process,
among sake samples. The reason why TPI was the only remarkable protein in lower-quality sake is unknown.
In this study, we observed large differences in GlaB profiles among sake samples (Fig 7C and 7E), although these differences did not seem to affectginjosake quality. We also confirmed that a single 65 kDa GlaB protein was expressed during the solid-state rice mold making process (data not shown). The 47 kDa GlaB may be a partially digested form of the 65 kDa GlaB, whereas the blurred 65–80 kDa GlaB could have resulted from differences in glucoamylase genes, which could produce alternative splicing variants of GlaB or enzyme resistance. The differences inglaB
gene expression could have resulted from theA.oryzaespecies used in the rice mold making pro-cess. Because it is a general practice ofA.oryzaesuppliers to mix severalA.oryzaespecies during the formulation of rice mold seeds to be reach a desirable enzymatic activity, proteins from a variety ofA.oryzaespecies are likely contained in sake. GlaA is 65 kDa polypeptide ofN-linked glycosylated secreted protein that is only expressed in submerged culture [69,70]. However, in MALDI-TOFMS analysis, GlaA was not detected, which suggests that GlaA was not expressed to a detectable level in sake mash after the solid-state rice mold making process.
Conclusions
In conclusion, the results of this study clearly demonstrate that certain polar metabolites in
ginjosake strongly correlate with its quality, and others correlate with its off-flavor. However, questions remain regarding the reasons or mechanisms by which these chemicals or their molecular rations might be associated with sake quality and off-flavor. To address this, further investigation of targeted chemicals and molecular biological approaches using cell culture sys-tems will be required. In addition, this study identified that several low quality sake samples contained higher amounts of polar metabolites that corresponded to a particular protein, TPI, inginjosake. The integrated approach combining successive metabolomics and protein analy-sis in sake presented here was the first demonstration of its application in the field of sake brewing, suggesting that it might possibly be applicable to other food or beverage fields as well.
Supporting Information
S1 Fig. Relationship between yeast TPI protein level and pyruvic acid concentration in 64
ginjosake samples.TPI was detected by immunoblot analysis in sake samples that were entered in the Annual NRIB National New Sake Awards competition held in 2009 (09), 2010 (10), and 2011 (11). Highly ranked sake samples are described as‘A’, inharmonious bitter-tast-ing sake samples are described as‘B’, and sake samples with a fatty acid odor are described as ‘C’. Pyruvic acid concentration in sake determined by colorimetric assay is shown in graphs. As part of the sensory evaluation score, yeast debris-like odor and sulfur-like odor indices are also displayed.
(TIFF)
Acknowledgments
Author Contributions
Conceived and designed the experiments: KT. Performed the experiments: KT HK. Analyzed the data: KT HK. Contributed reagents/materials/analysis tools: KT. Wrote the paper: KT.
References
1. Kanauchi M. SAKE alcoholic beverage production in Japanese food industry. In: Muzzalupo I., editor, Food Industry. Intech, Rijeka, Croatia; 2013. pp. 39–63.
2. Kitagaki H, Kitamoto K. Breeding research on sake yeasts in Japan: history, recent technological advances, and future perspectives. Annu Rev Food Sci Technol. 2013; 4:215–35. doi:10.1146/ annurev-food-030212-182545PMID:23464572
3. Sugimoto M, Koseki T, Hirayama A, Abe S, Sano T, Tomita M, et al. Correlation between sensory eval-uation scores of Japanese sake and metabolome profiles. J Agric Food Chem. 2010; 58(1):374–83.
doi:10.1021/jf903680dPMID:19961224
4. Sugimoto M, Kaneko M, Onuma H, Sakaguchi Y, Mori M, Abe S, et al. Changes in the charged metabo-lite and sugar profiles of pasteurized and unpasteurized Japanese sake with storage. J Agric Food Chem. 2012; 60(10):2586–93. doi:10.1021/jf2048993PMID:22352923
5. Mimura N, Isogai A, Iwashita K, Bamba T, Fukusaki E. Gas chromatography/mass spectrometry based component profiling and quality prediction for Japanese sake. J Biosci Bioeng. 2014; 118(4):406–14.
doi:10.1016/j.jbiosc.2014.04.006PMID:25060729
6. Takahashi K, Tsuchiya F, Isogai A. Relationship between medium-chain fatty acid contents and organ-oleptic properties of Japanese sake. J Agric Food Chem. 2014; 62(33):8478–85. doi:10.1021/ jf502071dPMID:25077811
7. Takahashi K, Goto-Yamamoto N. Simple method for the simultaneous quantification of medium-chain fatty acids and ethyl hexanoate in alcoholic beverages by gas chromatography-flame ionization detec-tor: Development of a direct injection method. J Chromatogr A. 2011; 1218(43):7850–6. doi:10.1016/j. chroma.2011.08.074PMID:21925662
8. Sakamoto K, Shimoda M, Osajima Y. Concentration in porapak Q column of volatile compounds in sake for analysis. Nippon Nogeikagaku Kaishi. 1993; 67(4):685–92. (in Japanese).
9. Farina L, Medina K, Urruty M, Boido E, Dellacassa E, Carrau F. Redox effect on volatile compound for-mation in wine during fermentation bySaccharomyces cerevisiae. Food Chem. 2012; 134(2):933–9.
doi:10.1016/j.foodchem.2012.02.209PMID:23107710
10. Robinson AL, Boss PK, Heymann H, Solomon PS, Trengove RD. Influence of yeast strain, canopy management, and site on the volatile composition and sensory attributes of cabernet sauvignon wines from Western Australia. J Agric Food Chem. 2011; 59(7):3273–84. doi:10.1021/jf104324dPMID: 21370883
11. Perestrelo R, Barros AS, Camara JS, Rocha SM. In-depth search focused on furans, lactones, volatile phenols, and acetals as potential age markers of Madeira wines by comprehensive two-dimensional gas chromatography with time-of-flight mass spectrometry combined with solid phase microextraction. J Agric Food Chem. 2011; 59(7):3186–204. doi:10.1021/jf104219tPMID:21375340
12. Van Opstaele F, De Causmaecker B, Aerts G, De Cooman L. Characterization of novel varietal floral hop aromas by headspace solid phase microextraction and gas chromatography-mass spectrometry/ olfactometry. J Agric Food Chem. 2012; 60(50):12270–81. doi:10.1021/jf304421dPMID:23186043 13. Verstrepen KJ, Derdelinckx G, Dufour JP, Winderickx J, Thevelein JM, Pretorius IS, et al. Flavor-active
esters: adding fruitiness to beer. J Biosci Bioeng. 2003; 96(2):110–8. PMID:16233495
14. Inui T, Tsuchiya F, Ishimaru M, Oka K, Komura H. Different beers with different hops. Relevant com-pounds for their aroma characteristics. J Agric Food Chem. 2013; 61(20):4758–64. doi:10.1021/ jf3053737PMID:23627300
15. Utsunomiya H, Isogai A, Iwata H, Nakano S. Flavor terminology and reference standards for sensory analysis of sake. In: National Research Institute of Brewing editor. Report of the Research Institute of Brewing, vol. 178., Higashi-Hiroshima, Hiroshima, Japan; 2006 pp 45–52. (in Japanese).
16. Ichikawa E, Hosokawa N, Hata Y, Abe Y, Suginami K, Imayasu S. Breeding of a Sake Yeast with Improved Ethyl Caproate Productivity. Agric Biol Chem. 1991; 55(8):2153–4.
17. Ashida S, Ichkawa E, Suginami K, Imayasu S. Isolation and application of mutants producing sufficient isoamyl acetate, a sake flavor component. Agric Biol Chem. 1987; 51(8):2061–5.
19. Isogai A, Kanda R, Hiraga Y, Nishimura T, Iwata H, Goto-Yamamoto N. Screening and identification of precursor compounds of dimethyl trisulfide (DMTS) in Japanese sake. J Agric Food Chem. 2009; 57 (1):189–95. doi:10.1021/jf802582pPMID:19090758
20. Isogai A, Kanda R, Hiraga Y, Iwata H, Sudo S. Contribution of 1,2-dihydroxy-5-(methylsulfinyl)pentan-3-one (DMTS-P1) to the formation of dimethyl trisulfide (DMTS) during the storage of Japanese sake. J Agric Food Chem. 2010; 58(13):7756–61. doi:10.1021/jf100707aPMID:20527964
21. Takahashi K, Kabashima F, Tsuchiya F. Comprehensive two-dimensional gas chromatography cou-pled with time-of-flight mass spectrometry reveals the correlation between chemical compounds in Jap-anese sake and its organoleptic properties. J Biosci Bioeng. 2015; In press. doi:10.1016/j.jbiosc.2015. 06.016
22. Yamashita N, Motoyoshi T, Nishimura A. Molecular cloning of the isoamyl alcohol oxidase-encoding gene (mreA) from Aspergillus oryzae. J Biosci Bioeng. 2000; 89(6):522–7. PMID:16232791 23. Isogai A, Utsunomiya H, Kanda R, Iwata H. Changes in the aroma compounds of sake during aging. J
Agric Food Chem. 2005; 53(10):4118–23. PMID:15884848
24. Inahashi M, Yoshida K, Tadenuma M. Determination of carbonyl compounds in alcoholic beverages. J Brew Soc Japan. 1997; 92(2):151–8. (in Japanese).
25. Iwano K, Ito T, Nakazawa N. Correlation analysis of a sensory evaluation and the chemical components of ginjyo-shu. J Brew Soc Japan. 2005; 100(9):639–49. (in Japanese).
26. Utsunomiya H, Yamada O, Hashiguchi T. Analysis of free fatty acids, higher alcohols and esters in gin-jyo-shu produced in the northern part of kyushu. J Brew Soc Japan. 2000; 95(3):214–8. (in Japanese). 27. D'Amato A, Fasoli E, Kravchuk AV, Righetti PG. Mehercules, adhuc Bacchus! The debate on wine
pro-teomics continues. J Proteome Res. 2011; 10(8):3789–801. doi:10.1021/pr200266wPMID:21702502 28. Van Sluyter SC, McRae JM, Falconer RJ, Smith PA, Bacic A, Waters EJ, et al. Wine protein haze:
mechanisms of formation and advances in prevention. J Agric Food Chem. 2015; 63(16):4020–30. doi: 10.1021/acs.jafc.5b00047PMID:25847216
29. Fasoli E, Aldini G, Regazzoni L, Kravchuk AV, Citterio A, Righetti PG. Les Maitres de l'Orge: the prote-ome content of your beer mug. J Proteprote-ome Res. 2010; 9(10):5262–9. doi:10.1021/pr100551nPMID: 20722451
30. Iimure T, Kihara M, Sato K. Beer and wort proteomics. Methods Mol Biol. 2014; 1072:737–54. doi:10. 1007/978-1-62703-631-3_51PMID:24136560
31. Iimure T, Takoi K, Kaneko T, Kihara M, Hayashi K, Ito K, et al. Novel prediction method of beer foam stability using protein Z, barley dimeric alpha-amylase inhibitor-1 (BDAI-1) and yeast thioredoxin. J Agric Food Chem. 2008; 56(18):8664–71. doi:10.1021/jf801184kPMID:18710245
32. Konecna H, Muller L, Dosoudilova H, Potesil D, Bursikova J, Sedo O, et al. Exploration of beer prote-ome using OFFGEL prefractionation in combination with two-dimensional gel electrophoresis with nar-row pH range gradients. J Agric Food Chem. 2012; 60(10):2418–26. doi:10.1021/jf204475ePMID: 22353030
33. Picariello G, Mamone G, Cutignano A, Fontana A, Zurlo L, Addeo F, et al. Proteomics, peptidomics, and immunogenic potential of wheat beer (weissbier). J Agric Food Chem. 2015; 63(13):3579–86. doi: 10.1021/acs.jafc.5b00631PMID:25793656
34. Picariello G, Mamone G, Nitride C, Addeo F, Camarca A, Vocca I, et al. Shotgun proteome analysis of beer and the immunogenic potential of beer polypeptides. J Proteomics. 2012; 75(18):5872–82. doi: 10.1016/j.jprot.2012.07.038PMID:22868252
35. Berner TS, Jacobsen S, Arneborg N. The impact of different ale brewer's yeast strains on the proteome of immature beer. BMC Microbiol. 2013; 13:215. doi:10.1186/1471-2180-13-215PMID:24079909 36. Di Carli M, Zamboni A, Pe ME, Pezzotti M, Lilley KS, Benvenuto E, et al. Two-dimensional differential in
gel electrophoresis (2D-DIGE) analysis of grape berry proteome during postharvest withering. J Prote-ome Res. 2011; 10(2):429–46. doi:10.1021/pr1005313PMID:20945943
37. Fraige K, Gonzalez-Fernandez R, Carrilho E, Jorrin-Novo JV. Metabolite and proteome changes during the ripening of Syrah and Cabernet Sauvignon grape varieties cultured in a nontraditional wine region in Brazil. J Proteomics. 2015; 113:206–25. doi:10.1016/j.jprot.2014.09.021PMID:25301534 38. Martinez-Esteso MJ, Vilella-Anton MT, Pedreno MA, Valero ML, Bru-Martinez R. iTRAQ-based protein
profiling provides insights into the central metabolism changes driving grape berry development and ripening. BMC Plant Biol. 2013; 13:167. doi:10.1186/1471-2229-13-167PMID:24152288
39. Kambiranda D, Katam R, Basha SM, Siebert S. iTRAQ-based quantitative proteomics of developing and ripening muscadine grape berry. J Proteome Res. 2014; 13(2):555–69. doi:10.1021/pr400731p
40. Braconi D, Bernardini G, Possenti S, Laschi M, Arena S, Scaloni A, et al. Proteomics and redox-proteo-mics of the effects of herbicides on a wild-type wineSaccharomyces cerevisiaestrain. J Proteome Res. 2009; 8(1):256–67. doi:10.1021/pr800372qPMID:19032026
41. Zhao S, Zhao X, Zou H, Fu J, Du G, Zhou J, et al. Comparative proteomic analysis ofSaccharomyces cerevisiaeunder different nitrogen sources. J Proteomics. 2014; 101:102–12. doi:10.1016/j.jprot.2014. 01.031PMID:24530623
42. Xu W, Wang J, Li Q. Comparative proteome and transcriptome analysis of lager brewer's yeast in the autolysis process. FEMS Yeast Res. 2014; 14(8):1273–85. doi:10.1111/1567-1364.12223PMID: 25345722
43. Rossignol T, Kobi D, Jacquet-Gutfreund L, Blondin B. The proteome of a wine yeast strain during fer-mentation, correlation with the transcriptome. J Appl Microbiol. 2009; 107(1):47–55. doi:10.1111/j. 1365-2672.2009.04156.xPMID:19245406
44. Matsumaru K, Isogai A, Fujita A, Sudo S, Kizaki Y. Analysis of Sake Component Presented to Sake Contests in 2011. In: National Research Institute of Brewing editor. Report of the Research Institute of Brewing, vol. 184., Higashi-Hiroshima, Hiroshima, Japan; 2012 pp 1–15. (in Japanese).
45. Dooley L, Lee Y-s, Meullenet J-F. The application of check-all-that-apply (CATA) consumer profiling to preference mapping of vanilla ice cream and its comparison to classical external preference mapping. Food Qual Pref. 2010; 21(4):394–401.
46. Reinbach HC, Giacalone D, Ribeiro LM, Bredie WLP, Frost MB. Comparison of three sensory profiling methods based on consumer perception: CATA, CATA with intensity and Napping. Food Qual Pref. 2014; 32(Part B):160–6.
47. Ares G, Antúnez L, Bruzzone F, Vidal L, Giménez A, Pineau B, et al. Comparison of sensory product profiles generated by trained assessors and consumers using CATA questions: Four case studies with complex and/or similar samples. Food Qual Pref. 2015; 45(0):75–86.
48. Sugimoto M, Wong DT, Hirayama A, Soga T, Tomita M. Capillary electrophoresis mass spectrometry-based saliva metabolomics identified oral, breast and pancreatic cancer-specific profiles. Metabolo-mics. 2010; 6(1):78–95. PMID:20300169
49. Hata Y, Ishida H, Ichikawa E, Kawato A, Suginami K, Imayasu S. Nucleotide sequence of an alternative glucoamylase-encoding gene (glaB) expressed in solid-state culture of Aspergillus oryzae. Gene. 1998; 207(2):127–34. PMID:9511753
50. Hata Y, Kitamoto K, Gomi K, Kumagai C, Tamura G, Hara S. The glucoamylase cDNA fromAspergillus oryzae: Its cloning, nucleotide sequence, and expression inSaccharomyces cerevisiae. Agric Biol Chem. 1991; 55(4):941–9. PMID:1368680
51. Wirsel S, Lachmund A, Wildhardt G, Ruttkowski E. Three alpha-amylase genes ofAspergillus oryzae exhibit identical intron-exon organization. Mol Microbiol. 1989; 3(1):3–14. PMID:2785629
52. Gomi K, Arikawa K, Kamiya N, Kitamoto K, Kumagai C. Cloning and nucleotide sequence of the acid protease-encoding gene (pepA) from Aspergillus oryzae. Biosci Biotechnol Biochem. 1993; 57 (7):1095–100. PMID:7763981
53. Takahashi K, Tokuoka M, Kohno H, Sawamura N, Myoken Y, Mizuno A. Comprehensive analysis of dipeptides in alcoholic beverages by tag-based separation and determination using liquid chromatogra-phy/electrospray ionization tandem mass spectrometry and quadrupole-time-of-flight mass spectrome-try. J Chromatogr A. 2012; 1242:17–25. doi:10.1016/j.chroma.2012.03.076PMID:22560451 54. Siiu P, Johnson MJ. Effect of the composition of the sporulation medium on citric acid production by
Aspergillus nigerin submerged culture. J Bacteriol. 1947; 54(2):161–7.
55. Futagami T, Mori K, Wada S, Ida H, Kajiwara Y, Takashita H, et al. Transcriptomic analysis of tempera-ture responses ofAspergillus kawachiiduring barley koji production. Appl Environ Microbiol. 2015; 81 (4):1353–63. PMID:25501485
56. Deutscher J, Galinier A, Martin-Verstraete I.Bacillus subtilisand its closest relatives:from Genes to Cells, Sonenshein A. L., Hoch J. A. & Losick R.. Editors. Washington, DC: American Society for Micro-biology. 2002. pp. 129–150.
57. Morohashi M, Ohashi Y, Tani S, Ishii K, Itaya M, Nanamiya H, et al. Model-based definition of popula-tion heterogeneity and its effects on metabolism in sporulatingBacillus subtilis. J Biochem. 2007; 142 (2):183–91. PMID:17545249
58. Kitano H, Kataoka K, Furukawa K, Hara S. Specific expression and temperature-dependent expression of the acid protease-encoding gene (pepA) inAspergillus oryzaein solid-state culture (Rice-Koji). J Biosci Bioeng. 2002; 93(6):563–7. PMID:16233250
60. Nakayama Y, Putri SP, Bamba T, Fukusaki E. Metabolic distance estimation based on principle compo-nent analysis of metabolic turnover. J Biosci Bioeng. 2014; 118(3):350–5. doi:10.1016/j.jbiosc.2014. 02.014PMID:24680283
61. Arikawa Y, Kuroyanagi T, Shimosaka M, Muratsubaki H, Enomoto K, Kodaira R, et al. Effect of gene disruptions of the TCA cycle on production of succinic acid inSaccharomyces cerevisiae. J Biosci Bioeng. 1999; 87(1):28–36. PMID:16232421
62. Chin RM, Fu X, Pai MY, Vergnes L, Hwang H, Deng G, et al. The metabolite alpha-ketoglutarate extends lifespan by inhibiting ATP synthase and TOR. Nature. 2014; 510(7505):397–401. doi:10. 1038/nature13264PMID:24828042
63. Zheng L, Cardaci S, Jerby L, MacKenzie ED, Sciacovelli M, Johnson TI, et al. Fumarate induces redox-dependent senescence by modifying glutathione metabolism. Nat Commun. 2015; 6:6001. doi:10. 1038/ncomms7001PMID:25613188
64. Carey BW, Finley LW, Cross JR, Allis CD, Thompson CB. Intracellular alpha-ketoglutarate maintains the pluripotency of embryonic stem cells. Nature. 2015; 518(7539):413–6. doi:10.1038/nature13981
PMID:25487152
65. Wu AL, Moye-Rowley WS. GSH1, which encodes gamma-glutamylcysteine synthetase, is a target gene for yAP-1 transcriptional regulation. Mol Cell Biol. 1994; 14(9):5832–9. PMID:7915005
66. Huang CS, Moore WR, Meister A. On the active site thiol of gamma-glutamylcysteine synthetase: rela-tionships to catalysis, inhibition, and regulation. Proc Natl Acad Sci U S A. 1988; 85(8):2464–8. PMID: 2895925
67. Grant CM, MacIver FH, Dawes IW. Glutathione synthetase is dispensable for growth under both normal and oxidative stress conditions in the yeastSaccharomyces cerevisiaedue to an accumulation of the dipeptide gamma-glutamylcysteine. Mol Biol Cell. 1997; 8(9):1699–707. PMID:9307967
68. Soga T, Baran R, Suematsu M, Ueno Y, Ikeda S, Sakurakawa T, et al. Differential metabolomics reveals ophthalmic acid as an oxidative stress biomarker indicating hepatic glutathione consumption. J Biol Chem. 2006; 281(24):16768–76. PMID:16608839
69. Hata Y, Ishida H, Kojima Y, Ichikawa E, Kawato A, Suginami K, et al. Comparison of two glucoamylases produced byAspergillus oryzaein solid-state culture (koji) and in submerged culture. J Ferment Bioeng. 1997; 84(6):532–7.