PONTIFÍCIA UNIVERSIDADE CATÓLICA DO RIO GRANDE DO SUL FACULDADE DE BIOCIÊNCIAS
PROGRAMA DE PÓS-GRADUAÇÃO EM ZOOLOGIA
CARACTERIZAÇÃO DO GENOMA MITOCONDRIAL DE ONÇA-PINTADA (PANTHERA ONCA) E ELUCIDAÇÃO DA FILOGENIA MITOGENÔMICA DO
GÊNERO PANTHERA
Laura Moretti Heidtmann
DISSERTAÇÃO DE MESTRADO
PONTIFÍCIA UNIVERSIDADE CATÓLICA DO RIO GRANDE DO SUL Av. Ipiranga, 6681
Fone: (51) 3320-3500 - Fax: (51) 3339-1564 CEP: 90619-900, Porto Alegre - RS
Brasil
PONTIFÍCIA UNIVERSIDADE CATÓLICA DO RIO GRANDE DO SUL
FACULDADE DE BIOCIÊNCIAS
PROGRAMA DE PÓS-GRADUAÇÃO EM ZOOLOGIA
CARACTERIZAÇÃO DO GENOMA MITOCONDRIAL DE ONÇA-PINTADA (PANTHERA ONCA) E ELUCIDAÇÃO DA FILOGENIA MITOGENÔMICA DO
GÊNERO PANTHERA
Laura Moretti Heidtmann Orientador: Dr. Eduardo Eizirik Co-orientadora: Dra. Taiana Haag
DISSERTAÇÃO DE MESTRADO PORTO ALEGRE - RS - BRASIL
III SUMÁRIO
AGRADECIMENTOS...IV RESUMO...VI ABSTRACT...VII APRESENTAÇÃO...VIII INTRODUÇÃO GERAL...IX ARTIGO CIENTÍFICO...XVIII
Abstract...2
Introduction...3
Materials and methods...5
Results and Discussion...9
Conclusions...15
References...16
Tables...20
Figures...25
IV AGRADECIMENTOS
Primeiramente agradeço o meu orientador, Duda muito obrigada pela oportunidade, por acreditar no meu potencial, por ter me possibilitado experiências inesquecíveis nestes dois anos, foi e sempre será um grande prazer trabalhar contigo.
À Taia minha co-orientadora que me incentivou a trabalhar com onças desde o primeiro dia que entrei no lab e graças a isso realizei o meu sonho de trabalhar com este felino maravilhoso.
À Fê Pedone que quando a conheci senti que já nos conhecíamos há muito tempo. Fê, muitíssimo obrigada por toda ajuda, tu tiveste um papel fundamental em diversos processos do meu mestrado e serei sempre muito grata por tudo que fizeste por mim. Obrigada pela parceria e pela amizade.
Ao Henrique e a Fêzinha pela parceria na busca do genoma mitocondrial da onça-pintada e no entendimento dessas coisas loucas de next-gen. Muito obrigada pelas discussões, pelas sugestões e pela ajuda ao longo deste trabalho.
Aos meus inspiradores Taiana Haag, Tatiane Trigo, Cristine Trinca e Manoel Fountoura-Rodrigues em um mini-curso sobre carnívoros neotropicais, genética da conservação, filogenia, simplesmente me fascinaram com este mundo. Tenho muito orgulho de ter convivido com vocês estes anos e de ter aprendido tanto. Parabéns e continuem encantando as pessoas, pois vale a pena.
Aos professores do PPG-Zoo pelos ensinamentos e aos meus colegas de mestrado pelas trocas de experiência, de ideias e de sentimentos.
Aos amados genômicos por tornarem o ambiente de trabalho tão alegre e principalmente pelo apoio no dia-a-dia. Pelos almoços, pelos cafezinhos, pelos papos, pelas risadas e pela boa companhia. Foi um prazer imenso conviver com vocês estes dois anos. Adri, Alemoa, Aninha, Fabíola, Fabrício, Fê, Fezinha, Fernando, Flavinha, Gabi, Gi, Henrique, Isadora, Lucas, Luiza, Kerstin, Maneco, Manuel, Maísa, Tali, Taiz e Ti, muitíssimo obrigada por tornarem os momentos difíceis em risadas e pelo apoio emocional, isso conta muito! Valeu pessoal!
V
depois (Maísa, Dani, Fabrício, Gustavo, Ítalo – veio só para pizza, mas valeu mesmo assim).
Ao pessoal do Zoológico Municipal Quinzinho de Barros, Sorocaba, em especial ao M.V. Rodrigo Teixeira e a M.V. Alexandra Comerlato por toda a atenção que nos deram e por toparem fazer parte do projeto genoma da onça-pintada e também por cederem amostras da onça Vitória, uma possível onça de cativeiro a ser translocada para natureza.
À minha super amiga Camila Castilho, que me incentivou a ir atrás do mestrado que eu realmente queria. Muito obrigada florzinha por sempre me ouvir, por sempre me ajudar e por eu saber que sempre posso contar contigo.
Às minhas amigas Carol e Carochinha que a distância nunca nos separe e que a gente possa eternamente contar umas com as outras, muito obrigada por tudo.
Aos meus pais, Patricia e Henrique e à minha irmã, Bárbara, sem o apoio familiar a vida seria muito mais difícil. Obrigada por me apoiarem, por acreditarem em mim, pela confiança que sempre tiveram e pelo amor indestrutível e forte que temos um pelo outro. Amo vocês.
VI RESUMO
VII ABSTRACT
The characterization of the mitochondrial genome of the jaguar (Panthera onca) and the elucidation of the mitogenomic phylogeny from Panthera genus
VIII APRESENTAÇÃO
Esta dissertação, intitulada “Caracterização do genoma mitocondrial de onça-pintada (Panthera onca) e elucidação da filogenia mitogenômica do gênero Panthera”, é um dos requisitos exigidos pelo Programa de Pós-Graduação em Zoologia, da
Faculdade de Biociências, da Pontifícia Universidade Católica do Rio Grande do Sul, para a obtenção do título de mestre.
Os resultados aqui apresentados foram gerados em sua maioria no Laboratório de Biologia Genômica e Molecular, vinculado a esta Universidade. Os dados brutos de sequenciamento de RNA foram gerados pelo Laboratório de Biotecnologia Animal, da Escola Superior de Agricultura Luiz de Queiroz, da Universidade de São Paulo.
Este estudo contou com o apoio financeiro da Coordenação de Aperfeiçoamento de Pessoal de Nível Superior (CAPES) que me concedeu a bolsa de mestrado PROSUP/INSTITUCIONAL do Programa de Suporte à Pós-Graduação de Instituições de Ensino Particulares. Além disso, o projeto contou com apoio financeiro do CNPq, FAPERGS e FAPESP.
Este trabalho teve como objetivos (i) realizar a primeira caracterização completa do genoma mitocondrial de onça-pintada (Panthera onca), através do sequenciamento de alto desempenho aplicado à técnica de sequenciamento de RNA; e (ii) elucidar a filogenia mitogenômica do gênero Panthera.
IX INTRODUÇÃO GERAL
1. Genomas mitocondriais: estrutura, organização e transcrição
O DNA mitocondrial (DNAmt) da maioria dos animais se apresenta como uma molécula de fita dupla e circular. Apenas algumas classes de cnidários (Cubozoa, Scyphozoa e Hydrozoa) possuem o DNAmt arranjado linearmente (Bridge et al., 1992). As duas fitas do DNAmt podem ser distinguidas com base em suas composições nucleotídicas de guanina e timina (G+T), que fazem com que as fitas apresentem pesos moleculares distintos em gradientes alcalinos de cloreto de césio, sendo por este motivo uma das fitas chamada de H (“heavy”, que em inglês que significa pesado) e a outra de L (“light”, que traduzido do inglês é leve) (Clayton, 1991; Wolstenholme, 1992). A fita pesada é rica em guanina enquanto que a fita leve é pobre em guanina (Clayton, 1991).
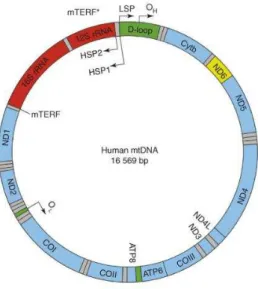
Outra característica marcante do DNAmt animal é que este é geralmente muito compacto, possuindo de 15 a 20 Kb, e se apresenta organizado em 37 genes (Anderson et al., 1981). Tipicamente, todo o genoma mitocondrial está distribuído em duas subunidades de rRNA, 22 tRNAs, 13 genes codificadores de proteínas envolvidos na cadeia respiratória, e uma região não codificadora (região controle), envolvida na regulação da replicação e transcrição mitocondrial (Fig. 1) (Anderson et al., 1981; Clayton, 1991; Wolstenholme, 1992; Taanman, 1999; Asin-Cayuela & Gustafsson, 2007). Dessa maneira, existem poucos ou nenhum nucleotídeo entre os genes, não há íntrons e ocorre sobreposição de alguns genes, como atp8 com atp6 e nad4 com nad4L (Clayton, 1991; Wolstenholme, 1992). Em muitos casos, os códons de terminação não são codificados, mas gerados posteriormente à transcrição pela poli-adenilação dos mRNAs (Bobrowicz et al., 2008).
X
Figura 1 Organização dos 37 genes mitocondriais em humanos. OH e OL – origem de replicação da fita pesada e leve, respectivamente. HSP1 e 2 – referem-se aos dois promotores responsáveis pela transcrição da fita H; LSP- corresponde ao promotor da fita L; mTERF parece ser o responsável pelo bloqueio da transcrição da fita L e da transcrição da fita H iniciada pelo promotor HSP1. mTERF* parece ser importante no estímulo da transcrição iniciada pelo promotor HSP1. Em azul, os genes codificadores de proteínas transcritos na fita H; em amarelo, ND6 o único gene codificante transcrito na fita L. Em cinza, os tRNAs. Em vermelho, os genes codificadores das duas subunidades ribossomais mitocondriais. Em verde, regiões não codificadoras e a região controle ou D-loop. Fonte: Asin-Cayuela & Gustafsson, 2007.
A região controle (CR - control region) ou D-loop é a única porção significativa do DNAmt que não é codificante. Em mamíferos, encontra-se localizada entre os genes
trnP e trnF (Fig. 2) e apresenta cerca de 1000pb (Anderson et al., 1981). Esta região está associada a diversos mecanismos celulares como crescimento e ciclo de vida celular além de apresentar papel fundamental na regulação da transcrição e da replicação mitocondrial (King & Low, 1987; Clayton, 1991). Além disso, esta porção é a principal responsável pelas variações de tamanho encontradas dentro da mesma espécie e até no mesmo indivíduo, sendo este último um processo conhecido como heteroplasmia (Hayasaka et al., 1991; Hoelzel et al., 1994).
CBS-1-XI
3, seguindo as numerações propostas por Hoelzel et al. (1994). No gênero Panthera,
RS-2 e RS-3 são as principais responsáveis pela variação de tamanho do genoma
mitocondrial, tanto inter- quanto intra-especificamente (Jae-Heup et al., 2001).
Figura 2 Representação esquemática da região controle do gênero Panthera. pro e tRNA-phe são os limites da região controle. HVS – corresponde aos segmentos hipervariáveis; RS-2 e RS-3 são regiões repetitivas; CSB são os blocos de sequência conservada. Fonte: Jae-Heup et al., 2001.
O DNAmt possui duas origens de replicação, uma para cada fita (Clayton, 1991).
A fita H tem sua origem de replicação na região controle (OH) e a origem de replicação da fita L (OL) está localizada dentro de um agrupamento de cinco tRNAs (Fig.1) (revisado por Taanman, 1999).
Em mamíferos, a transcrição do DNAmt inicia-se em três pontos de origem
localizados dentro ou adjacentes à região controle (revisado por Asin-Cayuela &
Gustafsson, 2007). Existe um único promotor de transcrição da fita L (LSP) e dois
promotores para a fita H (HSP1 e HSP2). A maioria das informações mitocondriais são
codificadas na fita H, sendo o promotor HSP2 o principal responsável pela transcrição de
praticamente toda a fita. Este promotor se localiza dentro do trnF e produz um único
grande transcrito com 12 genes codificadores de proteínas e as duas subunidades
ribossomais de rRNA (Montoya, 1982; Christianson & Clayton, 1988; Taanman, 1999;
revisado por Asin-Cayuela & Gustafsson, 2007). O promotor HSP1 se encontra
localizado a aproximadamente 100 pb do HSP2, estando mais próximo da região controle
(Fig. 1). Este promotor, HSP1, gera um transcrito mais curto, que cobre os dois genes
codificadores de rRNA e termina no fim do gene rrnL. O promotor LSP é responsável
pela transcrição de oito tRNAs e do gene nad6, e está localizado dentro da região controle
(Montoya, 1982; Clayton, 1991; Taanman, 1999; revisado por Asin-Cayuela &
XII
Apenas, sabe-se que a transcrição iniciada pelo promotor HSP1 possui um sítio de terminação provável chamado mTERF (Fig.1), este mesmo sítio parece influenciar também o término da transcrição iniciada pelo promotor LSP (ver Asin-Cayuela & Gustafsson, 2007).
O processamento dos transcritos primários é guiado pela localização dos tRNAs, os quais servem de sinal de clivagem para a produção de mRNAs maduros dos genes codificadores de proteínas e para a produção de moléculas de rRNA. Este mecanismo é possível uma vez que estes segmentos encontram-se espaçados por tRNAs - processo este conhecido como modelo de pontuação de tRNA (traduzido do inglês tRNA punctuation model) (Ojala et al., 1981). Tipicamente, a maturação dos mRNAs envolve ainda a
poli-adenilação, sendo que moléculas de rRNA também passam por este processo (Bobrowicz et al., 2008). Em vertebrados, todos os mRNAs maduros são monocistrônicos, exceto os mensageiros de nad4/nad4L e atp8/atp6, que são bicistrônicos (Bernt et al., 2012).
A organização dos genes mitocondriais difere muito pouco dentro dos principais grupos de animais, porém em grupos filogeneticamente distantes os arranjos dos genes podem ser bastante diferentes. Por este motivo, os rearranjos de genes mitocondriais são utilizados como informação filogenética em estudos que buscam resolver os ramos mais basais dos metazoários, por exemplo (Boore, 1999). Porém, como os rearranjos são raros, esta abordagem apresenta a limitação de fornecer poucos caracteres para gerar reconstruções filogenéticas satisfatórias (Curole & Kocker, 1999).
2. Genomas mitocondriais: importância
XIII
tamanho e estrutura, os arranjos dos genes, o código genético e as estruturas secundárias
de rRNAs e tRNAs, proveram os únicos caracteres capazes de esclarecer filogenias
obscuras (Boore, 1999, 2006).
Os principais motivos que induziram a popularização do DNAmt como marcador
molecular em animais são: ausência de recombinação, herança exclusivamente materna,
taxas de substituição nucleotídica aceleradas em relação ao DNA nuclear, tamanho
compacto e organização conservada em vertebrados (Harrison, 1989; Wolstenholme,
1992; Avise, 1994, Curole & Kocher, 1999). Tais características facilitaram a aplicação
e o desenvolvimento de diversos tipos de análise, e são ainda relevantes, mesmo quando
se pode também caracterizar locos nucleares (que apresentam padrões evolutivos mais
complexos).
3. Genomas mitocondriais: como são obtidos
Os genomas mitocondriais (mitogenomas) podem ser gerados de várias maneiras.
O método mais comumente empregado, em organismos-modelo ou em um organismo
onde um mitogenoma de uma espécie filogeneticamente próxima já foi caracterizado, é o
método de sequenciamento baseado em PCR ou em PCR longo (por exemplo Cheng et
al., 1994; Lei et al., 2010; Xu et al., 2012). Para aplicá-lo, uma série de primers
conservados são desenhados em posições adjacentes ou sobrepostas, com o intuito de
amplificar regiões complementares. Para outras espécies, onde não existem muitos
trabalhos realizados e se tem pouco conhecimento sobre a estrutura e a composição do
DNAmt, a abordagem de primer-walking é mais recomendada. Esta técnica consiste em
desenhar um primer em uma região conhecida e fazê-lo amplificar um grande número de
pares de base; em seguida o fragmento gerado é sequenciado e usado como base para
desenhar outro primer que fará a mesma coisa que o primeiro e assim sucessivamente até que se “ande” todo o genoma mitocondrial (por exemplo Imanishi et al., 2013).
Inserções de DNAmt em cromossomos nucleares, conhecidas como numts, são
comuns em diversos organismos (Bensasson et al., 2001; Hazkani-Covo et al., 2010). Os
numts são um problema difícil de lidar na hora de reconstruir genomas mitocondriais.
Alguns métodos e kits foram desenvolvidos para isolar o DNAmt e assim evitar que as
XIV
et al., 2006; Wei et al., 2011). Porém, estes métodos de isolamento de DNAmt ainda não
foram testados quanto a sua eficácia em remover totalmente o DNA nuclear. Sendo assim,
é necessária uma análise mais aprofundada com relação à confiabilidade de genomas
mitocondriais gerados através deste método, pelo menos em grupos onde se sabe que
existem grandes e recentes numts. Além disso, novas abordagens devem ser avaliadas visando a contornar este problema.
O desenvolvimento do sequenciamento de alto desempenho vem revolucionando o
campo da genética e da biologia molecular (ver revisões: Mardis, 2008; Metzker, 2009).
Dentre estes, o sequenciamento de RNA (RNA-seq) vem revolucionando o ramo de
pesquisa de transcriptomas (Wang et al., 2009). Além de ser uma excelente técnica para
o esclarecimento da arquitetura da transcrição nuclear em organismos não-modelo,
estima-se que 25% dos transcritos gerados por esta técnica são provenientes de DNA
organelar (Wang et al., 2009; Torres et al., 2009; Nabholz et al., 2010; Neira-Oviedo et
al., 2011; Smith, 2013). Ou seja, esta técnica parece ser bastante promissora para gerar
genomas mitocondriais. Além disso, os dados gerados por RNA-seq eliminam a
contaminação por numt (cópias nucleares de DNA mitocondrial) uma vez que estes segmentos tendem a ser pseudogenes, não sendo transcritos e tampouco gerando mRNAs
maduros (Bensasson et al., 2001; Hazkani-Covo et al., 2010).
4. Numt e suas complicações
Acredita-se que a mitocôndria originalmente era uma α-proteobacteria que foi
incorporada na origem das células eucarióticas através de um processo que conhecemos
como endossimbiose (Lang et al., 1999). Parte do material genético desta proteobacteria
endossimbionte foi perdida e grande parte foi transferida para o núcleo, motivo pelo qual
a grande maioria das proteínas mitocondriais são codificadas atualmente no núcleo (para
mais detalhes a respeito da evolução mitocondrial, ver Gray, 2012). Em contrapartida,
não há relatos de transferência recente de material genético funcional do DNA
mitocondrial para o núcleo em animais (revisado por Bensasson et al., 2001).
Possivelmente, isto ocorre porque apenas genes vitais foram mantidos no DNA organelar
e também porque os códigos genéticos do DNA nuclear e mitocondrial em animais são
XV
conhecidas como numts, se assemelham a pseudogenes (Bensasson et al., 2001; Hazkani-Covo et al., 2010).
Na família Felidae existem casos bem documentados de numts (Lopez et al. 1994, 1996; Johnson et al., 1996; Cracraft et al., 1998; Kim et al., 2006; Antunes et al., 2007).
Um caso bem conhecido e comentado na literatura é a translocação de 7,9 kb do genoma
mitocondrial para o cromossomo D2 de Felis catus (Lopez et al., 1994, 1996; Antunes et al. 2007). Outro caso em que ocorre tal translocação é no gênero Panthera, onde foi detectado em P. tigris 12.536 pb do genoma mitocondrial em um único bloco no cromossomo F2 (Cracraft et al., 1998; Kim et al., 2006). A similaridade entre numt e cymt (DNA mitocondrial citoplasmático) ocasionam inúmeros problemas quando se almeja
utilizar marcadores provenientes de DNAmt. Estes problemas variam desde a
identificação errônea de espécies (no caso de DNA barcode, por exemplo) até problemas relacionados a estudos populacionais ou a reconstruções filogenéticas (Song et al., 2008;
Davis et al., 2010; Hazkani-Covo et al., 2010).
5. Relações filogenéticas do gênero Panthera
O início da radiação dos felinos modernos é marcado pela divergência da
linhagem Panthera, formada por Panthera tigris, P. uncia, P. onca, P. pardus, P. leo, juntamente com as espécies irmãs Neofelis nebulosa e N. diardi (Johnson et al., 2006). Diversos trabalhos moleculares buscaram resolver a filogenia do gênero Panthera, porém, não há sequer dois trabalhos que reconstituam a filogenia do gênero com a mesma
topologia (por exemplo, Janczewski et al., 1995; Johnson et al., 1996; Yu & Zhang, 2005;
Johnson et al., 2006). Isto está relacionado principalmente à divergência rápida e recente
do gênero, o que dificulta a escolha de marcadores moleculares capazes de detectar o sinal
filogenético de maneira conclusiva (Johnson et al., 2006).
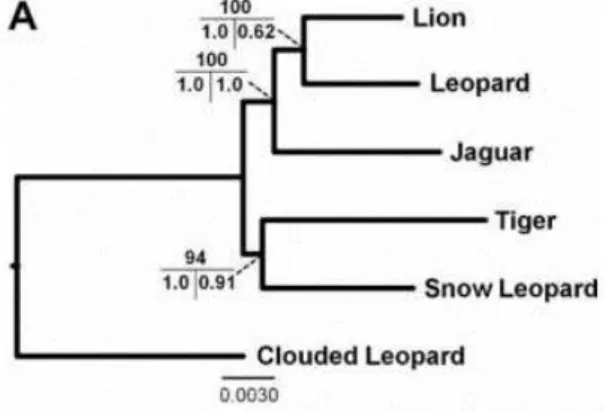
Atualmente, a filogenia do gênero Panthera mais aceita é a proposta por Davis et al. (2010). Neste trabalho, os autores realizaram uma busca exaustiva por diversas
sequências disponíveis em base de dados como o GenBank e ainda geraram novas
sequências para algumas espécies. O resultado foi a compilação de genes mitocondriais
(6.141 pb), autossômicos (19.124 pb), ligados ao cromossomo X (3.223 pb) e ligados ao
XVI
propostos por dados morfológicos e até o momento parece ser a que melhor representa as
relações filogenéticas do gênero (Fig. 3). Este trabalho detectou uma série de falhas em
estudos filogenéticos anteriores, desde sequencias que estavam mal identificadas - diziam
ser de uma espécie mas nas análises filogenéticas eram agrupadas com outra - até
amplificação errônea do numt ao invés do cymt.
Figura 3 - Filogenia atualmente aceita do gênero Panthera. Topologia obtida através do método de Maximum likelihood. Os valores de suporte dos ramos estão dispostos da seguinte maneira: em cima valor de bootstrap obtido por Maximum Likelihood, na porção inferior temos na esquerda a probabilidade posterior obtida pela análise de Inferência Bayesiana e na direita a probabilidade posterior estimada pelo método BEST (Bayesian estimation of species trees). Fonte: Davis et al., 2010.
Com o crescimento da era genômica, muitos trabalhos têm buscado resolver as
relações filogenéticas do gênero Panthera com genomas mitocondriais, como é o caso de Wei et al. (2011) e Bagatharia et al. (2013). Apesar do valor científico destes dois
trabalhos, ambos apresentam falhas notáveis. No trabalho de Wei et al. (2011), foram
gerados os primeiros genomas mitocondriais de espécies do gênero Panthera (P. tigris,
P. pardus e P. uncia; n° acessos do GenBank, EF551003, EF551002, EF551004, respectivamente). No entanto, nas análises filogenéticas foram utilizadas apenas partições
do DNA mitocondrial, uma vez que as demais espécies não possuíam seus genomas
mitocondriais disponíveis, sendo que utilizaram uma sequência disponível no GenBank
(n° de acesso AY170043) que já havia sido identificada por Davis et al. (2010) como
sendo um erro de identificação de espécie. Esta sequência foi depositada como sendo de
P. leo, porém as análises filogenéticas posteriores demostraram que esta sequência era na realidade de P. uncia. Talvez por este motivo a topologia encontrada por estes autores possua suportes muito baixos e difira tanto das demais filogenias do gênero,
XVII
suportado por diversos trabalhos (Janczewski et al., 1995; Johnson et al., 1996; Bininda‐ Emonds et al., 1999, 2001; Davis et al., 2010).
Apesar de existir previamente um mitogenoma de P. leo persica disponível no GenBank (n° de acesso JQ904290), este não possuía um artigo de referência associado,
de modo que Bagatharia et al. (2013) foram os primeiros a publicarem o genoma
mitocondrial de P. leo persica (n° de acesso: KC834784). Analisando-se este trabalho, nota-se que primeiramente ele menciona P. onca como uma espécie pertencente ao gênero
Panthera (o que é amplamente conhecido), porém nas análises realizadas com os mitogenomas completos os autores excluem esta espécie, não mencionando em momento
algum o porquê deste fato. Uma possível explicação é o fato de que até há pouco tempo
não existia qualquer genoma mitocondrial de onça-pintada disponível no GenBanK.
Entretanto, em novembro de 2013, quando nosso estudo já se encontrava em fase de
finalização, uma sequência de mitogenoma de onça-pintada se tornou disponível no
GenBank (n° de acesso KF483864), porém sem haver qualquer artigo relacionado à
mesma até o momento.
OBJETIVOS
1. Caracterizar o genoma mitocondrial da onça-pintada (Panthera onca), utilizando dados de sequenciamento de RNA, certificando-se da especificidade de um mitogenoma gerado sem numts.
2. Conduzir a primeira análise filogenética dos mitogenomas completos do gênero
XVIII
ARTIGO CIENTÍFICO
“A complete mitochondrial genome of the jaguar (
Panthera
onca
) generated on the basis of RNA-
sequencing data”
Laura Moretti
Heidtmann; Henrique Vieira
Figueiró; Fernanda de Jesus
Trindade; Priscilla Marqui Schmidt Villela; Ricardo Augusto Brassaloti;
Gustavo Gasparin; Sónia Cristina da Silva Andrade; Luiz Lehmann
Coutinho e Eduardo
Eizirik
1
Original article
Draft, Gene
A complete mitochondrial genome of the jaguar (Panthera onca) generated on the basis of RNA-sequencing data
Laura Moretti Heidtmanna; Henrique Vieira Figueiróa; Fernanda de Jesus Trindadea; Priscilla Marqui Schmidt Villelab; Ricardo Augusto Brassalotib; Gustavo Gasparinb; Sónia Cristina da Silva Andradeb; Luiz Lehmann Coutinho b; Eduardo Eizirik a,c*
a Laboratório de Biologia Genômica e Molecular, Faculdade de Biociências, Pontifícia Universidade Católica do Rio Grande do Sul, Av. Ipiranga, 6681, CEP 90619-900, Porto Alegre, RS, Brazil
b Departamento de Zootecnia, Escola Superior de Agricultura Luiz de Queiroz, Universidade de São Paulo, Av. Pádua Dias, 11, CEP 13418-900, Piracicaba, SP, Brazil
c Instituto Pró-Carnívoros, Parque Edmundo Zanoni, Av. Horácio Neto, 1030, CEP 12945-010, Atibaia, SP, Brazil
*Corresponding author: Eduardo Eizirik
Address: Faculdade de Biociências, PUCRS, Av. Ipiranga
2
Abstract
Mitochondrial genomes are usually obtained by using a set of conserved PCR primers, which
may be a good strategy for several species. However, translocations of cytoplasmic
mitochondrial DNA segments into the nuclear genome (numts) are known to be a common
phenomenon in many taxa, including the felid genus Panthera. Available strategies to avoid
contamination with numt segments include the isolation of mitochondrial DNA followed by
PCR, long-PCR, primer walking and, more recently, the use of next-generation sequencing
(NGS) approaches. Among these, RNA sequencing (RNA-seq) may be particularly useful, as
it allows the efficient capture at high coverage of mtDNA transcripts, avoiding pseudogenized
nuclear copies. Using transcriptome data, we have characterized the complete mitochondrial
genome of the jaguar (Panthera onca), the only species of this genus whose mitogenome had
not yet been published. Our results demonstrate that the RNA-seq approach is very efficient
for full mtDNA sequencing in mammals, and holds great promise especially in the case of
groups plagued by the presence of large and recent numts, as is the case of Panthera species.
We use our jaguar sequence and previously available data on other species to conduct the first
complete mitogenomic phylogenetic analysis of the Panthera genus.
3 1. Introduction
Mammalian mitochondria contain a very compact, circular, double-stranded genome,
spanning 15 – 20 kb and containing 37 genes (Anderson et al., 1981). A typical mammalian
mitochondrial genome (mitogenome) encodes 13 protein-coding genes, two mitochondrial
ribosomal RNA subunit genes (rRNAs) and 22 transfer RNAs (tRNAs) (Anderson et al.,
1981; Wolstenholme, 1992). The mammalian mitochondrial DNA (mtDNA) has no introns
and there are few or no nucleotides between genes, with a single non-coding segment called
the control region (CR) or displacement loop (D-loop) (Clayton, 1991; Wolstenholme, 1992).
The D-loop exhibits the greatest length variation among mammalian mitogenomes (Hoelzel et
al., 1994) and has been shown to contain the replication origin of the H strand and the
promoters for RNA transcription of both mtDNA strands (Clayton, 1991; Taanman, 1999;
Asin-Cayuela and Gustafsson, 2007).
Mitogenomes are usually sequenced with the use of conserved PCR primers that
amplify overlapping fragments, which jointly span the entire mtDNA (e.g. Lei et al., 2010).
Although this can be a good strategy for many species, in some cases there may be issues
posed by the translocation of cytoplasmic mitochondrial DNA (cymtDNA) segments into the
nuclear genome (i.e. numt copies) (Lopez et al., 1994; Bensasson et al., 2001). Homologous
segments of the mitochondrial DNA that are inserted into the nuclear genome have been
reported in numerous organisms (e.g. Bensasson et al., 2001; Hazkani-Covo et al., 2010), and
seem to be quite common in general. In addition to posing challenges to accurate mitogenome
reconstruction, the sequence similarity between numt and cymtDNA copies (especially in the
case of recent integrations) can cause other problems. These include the misidentification of
species when using mitochondrial markers (e.g. DNA barcodes), or errors in phylogenetic
reconstruction induced by the comparison of non-orthologous segments (Song et al., 2008;
Davis et al., 2010; Hazkani-Covo et al., 2010).
Seeking to avoid such issues, several methods have been developed to prevent the
unintentional sequencing of numt copies while targeting mtDNA segments or full
mitogenomes. These approaches include long-PCR (e.g. Cheng et al., 1994; Machida et al.,
2002) or mitochondrial isolation/purification followed by PCR with multiple overlapping
primers (e.g Wei et al., 2011). More recently, with the development of next-generation
4 tool to overcome this problem (e.g. Wang et al., 2009; Nabholz et al., 2010; Fabre et al., 2013; Wang et al., 2013). Of the transcripts resulting from RNA-seq experiments, a substantial fraction (up to 25%) is derived from organelle genomes, which enables a variety of studies addressing mitochondrial gene organization and expression in non-model organisms (Torres et al., 2009; Nabholz et al., 2010; Neira-Oviedo et al., 2011; Smith, 2013; Wang et al., 2013). In addition, transcript data are expected to exclude numt contamination, since nuclear
translocations tend to become pseudogenized and therefore cease to undergo effective transcription (Bensasson et al., 2001; Hazkani-Covo et al., 2010).
In the family Felidae, there are well-known examples of numts, including two different episodes of large-scale transposition (e.g. Lopez et al. 1994, 1996; Johnson et al., 1996; Cracraft et al., 1998; Kim et al., 2006; Antunes et al., 2007). The first large numt reported for felids was the translocation of 7.9 kb of the mitochondrial genome into chromosome D2 of the domestic cat (Felis catus) and its close relatives (Lopez et al., 1994, 1996). Subsequently, a different insertion was identified in the five cat species belonging to the Panthera genus: tiger (P. tigris), lion (P. leo), leopard (P. pardus), jaguar (P. onca) and snow leopard (P. uncia) (Johnson et al., 1996; Cracraft et al., 1998; Kim et al., 2006). This Panthera-specific
numt turned out to be one of the largest known nuclear integrations in eukaryotes, comprising
74% of the mitochondrial genome copied into chromosome F2 (Kim et al., 2006).
Given the recent age of this numt insertion (estimated to have occurred ca. 3.5 million years ago, prior to the divergence of extant Panthera species), there is still considerable sequence similarity with respect to the paralogous cymtDNA segments (Kim et al., 2006). Such similarity, combined with the extent of this translocated segment, has led to difficulties in avoiding spurious amplification of numt fragments in PCR-based studies, including efforts to resolve the phylogenetic relationships among Panthera species (Davis et al., 2010).
The resolution of this phylogenetic problem has been notoriously difficult, not only
5
(Janczewski et al., 1995; Johnson et al., 1996; Wei et al., 2011), and the only available study
on full Panthera mitogenomes (Bagatharia et al., 2013) did not include the jaguar in its
analysis. It is therefore necessary to generate and analyze a full jaguar mtDNA sequence,
while striving to completely avoid numt contamination.
Although it is known that organelle-derived content is abundant in transcriptome data
sets (e.g. Neira-Oviedo et al. 2011; Smith, 2013), so far only a few studies have reported the
reconstruction of full mitogenomes with such an approach (e.g. Nabholz et al., 2010; Wang et
al., 2013). In particular, the use of this method with mammals is still quite rare, as to our
knowledge so far only two published studies have reported it (Hampton et al., 2011; Fabre et
al., 2013). In this study, we present the complete mitochondrial genome of the jaguar
(Panthera onca), whose sequence was based almost entirely on RNA-seq data. We also
present the first phylogenetic analyses of the full mitogenomes of all five Panthera species
(including their sister-species Neofelis nebulosa as an outgroup), and show that the resulting
topology differs from the most recent, supermatrix-derived phylogeny of this genus. Our
study demonstrates that RNA-seq is very efficient to generate mitogenome sequences,
especially in cases where large and complex numts are present, such as the Panthera genus.
2. Materials and methods
2.1. Sample collection
Samples of blood, muscle and four areas of the skin were collected from a single
jaguar individual as part of the Jaguar Genome Project currently being conducted by a
consortium of Brazilian institutions. The target individual was a healthy, wild-caught male
housed at the Sorocaba Municipal Zoo in southeastern Brazil. Certified veterinarians and
other zoo personnel performed all anesthesia and sampling procedures, which followed
protocols approved by the Sorocaba Zoo. Upon collection, blood and tissue samples were
immediately stabilized with RNAlater (Invitrogen®), with a 10:1 proportion of this buffer
relative to the sample. In addition, we collected ca. 5 ml of whole blood separately for use in
genomic DNA extractions. This sample was placed in a vacutainer tube containing the
anticoagulant K2EDTA, and stored at 4ºC for less than 48 hours before DNA extractions were
6 2.2. Laboratory procedures and mitogenome assembly
Total RNA was extracted from blood and tissue samples with a standard Trizol RNA
extraction protocol (Chomczynsky & Sacchi, 1987). RNA quantification and quality
assessment (integrity and purity) were performed using a NanoDrop spectrophotometer
(Thermo Scientific®). We constructed a cDNA library for each sample using the TruSeq
RNA Sample Prep Kit v2 (Illumina®), following the manufacturer’s instructions. The cDNA
libraries were then used to perform multiplexed/barcoded RNA-seq with an Illumina HiScan
sequencer.
We performed initial analyses of the Illumina sequence reads using the software
package Galaxy (Giardine et al., 2005; Blankenberg et al., 2010; Goecks et al., 2010). Only
reads presenting a minimum Phred quality scores > 20 per base were included in downstream
analyses. De novo assembly was conducted with the software package Trinity (Grabherr et al.,
2011), applying default parameters. The contigs produced from assembled transcripts were
used to perform pairwise BLAST searches against the Pantheratigris mitogenome (accession
EF551003; Wei et al., 2011), which was used as a reference to identify the mitochondrial
segments covered by our transcript data set. We also performed this assessment by using the ‘Map to reference’ tool implemented in the software package Geneious 6.1.2 (Kearse et al. 2012).
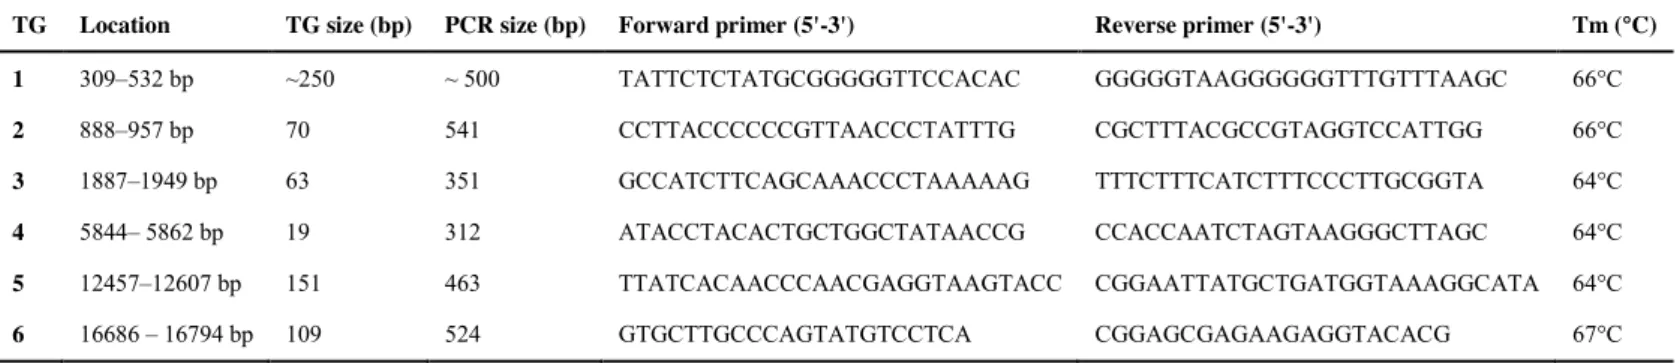
Short segments that were not covered by the transcript data (herein referred to as ‘transcript gaps’ [TGs]) were bridged with a PCR-based approach. We extracted genomic DNA from the blood sample using the DNeasy Blood & Tissue Kit (Qiagen®) following the manufacturer’s instructions. We designed PCR primers (Tab. 1) flanking each TG, applying two criteria to maximize their specificity to the cymtDNA copy: (i) high melting temperatures;
and (ii) at least 100 bp of sequence on either side of the TG, which could be directly
compared to the transcript-based data set. In addition, primers were designed and PCR
experiments were conducted based on the same individual whose transcripts had been
sequenced, which should further improve the specificity of cymtDNA amplification.
Furthermore, each pair of primers was tested with the Primer-BLAST software to ensure their
high probability of success with Panthera mitochondrial DNA (Ye et al., 2012)
PCR reactions were conducted in a total volume of 10µl containing 10-15ng total genomic DNA, 1X Buffer, 1.5mM MgCl2, 100µM dNTPs, 0.25µM of each primer and 0.1U
7 following conditions: initial denaturation at 95°C for 3 min, followed by 30 cycles of 95°C for
45s, 64 - 67°C for 45s, 72°C for 1 min, and a final extension at 72°C for 5 min. PCR products
were visualized on a 1% agarose gel stained with GelRed (Biotium) and purified with
exonuclease I and shrimp alkaline phosphatase before sequencing on a MegaBACE 1000
automated sequencer (GE Healthcare®).
To characterize one of the transcript gaps (TG1), which contained a complex repetitive
region (see Results), PCR products were cloned into a pCR®2.1-TOPO® vector using a
TOPO TA kit (Invitrogen®), following the manufacturer’s protocol. Chemocompetent E. coli were transformed with the recombinant plasmids following standard protocols (Sambrook et
al., 2001). To obtain sequences spanning the full inserts, plasmids were sequenced using the vector’s specific M13 forward (-20) primer (5’ GTAAAACGACGGCCAG 3’) and M13 reverse primer (5’ CAGGAAACAGCTATGAC 3’).
2.3. Jaguar mitogenome annotation
We employed two different strategies to annotate the jaguar mitogenome: (i) direct
comparison to the domestic cat reference mtDNA sequence (accession NC001700; Lopez et
al., 1996); and (ii) use of specific online software packages designed for organellar genome
annotation: DOGMA (Wyman et al., 2004) and MITOS (Bernt et al., 2012). We assessed the
performance of each of these approaches in the accurate prediction of mtDNA content and
exact gene boundaries, and selected the strategy whose result best matched well-annotated
mammalian mtDNA genomes.
2.4. Phylogenetic analyses
We used our jaguar mitogenome, along with mtDNA sequences from the other
Panthera species obtained from GenBank (Tab. 2), to perform multiple sets of phylogenetic
analyses. We initially analyzed a data set containing all Panthera mitogenomes, along with
mtDNA sequences from the immediate outgroup Neofelis nebulosa and the domestic cat
(Felis catus), as well as the two known large felid numts (see Tab. 2). We aligned these
sequences using the ClustalW algorithm implemented in the software package MEGA 5.2.2
(Tamura et al., 2011), and refined the alignment by hand. All sites that presented ambiguous
8
removed from the data set. The remaining 15,940 bp were analyzed as single partition in this initial set of phylogenetic analyses.
We reconstructed the phylogenetic relationships of this data set using four different optimality criteria: (i) minimum evolution using the Neighbor-joining (NJ) algorithm; (ii) Maximum Parsimony (MP); (iii) Maximum Likelihood (ML); and Bayesian Inference (BI). We performed NJ and MP analyses using MEGA, considering only transversions and employing Maximum Composite Likelihood distances (Tamura et al., 2004) in the former, while conducting 10 replicates of random taxon addition combined with tree-bisection-reconnection (TBR) branch-swapping in the latter. We also used MEGA to reconstruct the ML tree of this data set, initially by estimating its best-fitting model of nucleotide substitution based on the Bayesian Information Criterion (BIC). The Tamura-Nei model with gamma correction for rate heterogeneity among sites (TN93+G) was selected and used the subsequent analysis, which employed a NJ starting tree and nearest-neighbor-interchange (NNI) branch swapping. For these NJ, MP and ML analyses, nodal support was assessed with 500 nonparametric bootstrap replicates. The BI phylogeny was reconstructed with BEAST 1.8.0 (Drummond et al., 2012), using a random starting tree and assuming the TN93+G model of substitution, a strictmolecular clock and a Yule process for the tree prior. We ran the MCMC algorithm for 10,000,000 generations and sampled trees and parameters every 1,000 steps. Resulting trees were visualized using FigTree 1.4.
We then conducted a final set of phylogenetic analyses including only the Panthera
mitogenomes and the N. nebulosa outgroup, in which we assessed three different data sets: (i)
full mitogenomes; (ii) full mitogenomes excluding the control region; and (iii) only protein-coding genes. We performed the NJ analyses using the same approach described above, except that both transitions and tranversions were included in the data sets. The MP analyses were performed with PAUP* 4.0b10 (Swofford, 2003), using heuristic searches incorporating 500 replicates of random taxon addition and TBR branch-swapping. MP nodal support was assessed with 500 bootstrap replicates, each consisting of a heuristic search with 50 iterations of random taxon addition followed by TBR.
9
Criterion (AIC). The general-time-reversible model with gamma correction and a proportion
of invariant sites (GTR+G+I) was selected for the first two data sets (complete mitogenomes
with and without the control region). For the data set including only protein-coding genes,
GTR+G was found to be the best model. The ML trees were assessed with the rapid bootstrap
option, based on 1000 bootstrap replicates.
The BI analyses of these data sets were also performed with BEAST, but employing a
data partitioning approach to improve model fitting. We divided the mitogenome into 16
partitions, comprising the CR, the tRNAs joined together, the two rRNAs combined, and each
of the 13 protein-coding genes, respectively. For each partition, the best-fitting model of
nucleotide substitution was estimated with MEGA (see Supplementary Tab. 1) and
incorporated into the analysis. We unlinked substitution models and clock rates among
partitions, and assumed a strict molecular clock and a Yule process tree prior. The MCMC
algorithm was started from a random tree and ran for 20,000,000 generations, with parameters
and trees sampled every 1,000 steps. The first 10,000 trees were discarded as burn-in, and we
used the latter 10,000 samples to infer the consensus topology and the posterior probability of
its included clades.
3. Results and Discussion
3.1. Transcript coverage and PCR-based complementary data
A total of 17,703,707 single-end reads (spanning 50 bp each) were generated from six
samples (blood, muscle and four different skin biopsies) of the same individual. The de novo
assembly resulted in a total of 19,728 contigs (average length 201 – 6,107 bp). Of these, 79
contigs (ranging in length from 260 to 3,903 bp each, and resulting from the overall clustering
of 576,024 raw reads) yielded positive results with a pairwise BLAST against the Panthera
tigris mitogenome, and were therefore used to reconstruct the mitochondrial genome of P.
onca. Fifteen contigs were derived from blood transcripts, 14 from muscle and 50 from the
skin (skin samples 1, 2, 3 and 4; see Supplementary Tab. 2). The set of contigs obtained from
each sample presented similar start and end positions across the mitogenome (Supplementary
Tab. 2), so that we obtained an almost complete mtDNA assembly independently for each of
six replicates. The coverage of raw reads for each base pair included in the transcript data sets
was as follows: blood: 1-821; muscle: 1-1,496; skin1: 1-5,807; skin2: 1-1,707; skin3: 1-1,925;
10
coding genes (Supplementary Fig. 1). The remaining portions presented variable coverage,
which may be due to differences in transcript stability or other post-transcriptional processes
(Torres et al., 2009).
When the data from all six samples were pooled, the number of raw reads per base of
the jaguar mitogenome ranged from 1 to 10,950 (Fig. 1). Moreover, this combined transcript
data set covered ca. 96% of the complete P. onca mitochondrial genome. Read abundance in
protein-coding genes was greater than in other portions of the mitochondrial genome, but we
also mapped some reads to tRNA genes, both rRNA subunit genes and even stretches of the
control region (see Fig. 1).
Typically, tRNAs are lost from main transcripts during post-transcriptional events, as
their structures act as signals for the cleavage of the polycistronic transcript in a process
known as tRNA punctuation model (Ojala et al., 1981; Torres et al., 2009). This excision of
tRNAs is part of the process leading to mature mRNA and rRNA molecules, after which the
mRNAs are typically polyadenylated (Bobrowicz et al., 2008).
Since our approach to cDNA library construction used a purification step with poly-T
oligo beads (that bind to poly-A tails of mature mRNAs), this may be the cause of the
observed lower abundance of transcript reads mapping to tRNAs genes, and even the lack of
coverage of some tRNA segments. It may also account for the observed difference in read
abundance between the two rRNA subunits (see Fig. 1), which might be unexpected since
they are co-transcribed. However, there is evidence indicating that, after cleavage of the
rRNA molecules, the 12S rRNA receives a shorter poly-A tail relative to the 16S rRNA
(Torres et al., 2009; Neira- Oviedo et al., 2011), which would account for the much lower
capture of the former segment using the poly-T beads employed in this study.
Six short segments of the mitogenome were not covered by the RNA-seq data, and were thus identified as ‘transcript gaps’ (TGs). Two of the TGs corresponded to the felid repetitive segments known as RS-2 and RS-3, located in the control region (Hoelzel et al.,
1994; Jae-Heup et al., 2001), while the others comprised portions of tRNAs.
The repetitive sequence RS-3 is known to present considerable length variation within
and among individuals owing to constant duplication, deletion or substitution of the short (6 –
10 bp) tandem repeat units (Jae-Heup et al., 2001). To characterize this region, we cloned and
11 bp (Supplementary Fig. 2). Seven clones exhibited flanking sequences (i.e. immediately
outside the repetitive array) that were identical to the mitogenome generated with
RNA-sequencing data, and were thus considered to reliably represent the cymtDNA copy of this
segment. These seven clones showed internal variation within the repetitive array, and we
selected the longest one (i.e. the one containing the most repeat units) to include in the full
mitogenome sequence reported here.
In addition to these seven clones, three others also contained flanking sequences that
were very similar to the transcript-based data set, with the only observed differences being
two nucleotide substitutions e one nucleotide deletion (located within a poly-T stretch). As
these minor differences may be due to heteroplasmy or to Taq error in the PCR step prior to
cloning, we find it likely that these clones were also derived from the cymtDNA copy. With
their inclusion as likely cymtDNA-derived sequences, we had a total of 10 clones representing
this segment of the mitogenome, whose length varied from 293 to 503 bp due to differences
in RS-3 repeat composition.
The eight remaining clones comprised two very distinct sequences, represented by two
and six copies each. The sequence represented by two clones was quite short (201-bp long)
and very distinct from all others, presenting no identifiable similarity with any
mtDNA-related entry in GenBank. Since they presented some similarity with apparently random
domestic cat genomic segments, we infer that they derive from either spurious amplification
of nuclear DNA stretches, or from old numt insertions that can still be captured with the
mtDNA-targeting primers designed here. On the other hand, the sequence represented by six
clones was quite similar to the cymtDNA copy described above, but shorter (238-bp long) and bearing 17 nucleotide substitutions relative to the latter on the 5’ flank of the repetitive array, as well as a deletion in a conserved segment on the 3’ flank of the repeats. We infer that these
six clones represent the jaguar homolog of the large, recent Panthera numt, which is still
expected to retain considerable sequence similarity with the cymtDNA copy (Kim et al.,
2006). Interestingly, the tiger version of this numt translocation (the only homolog that had
been characterized so far) also displays a rather large (340-bp long) deletion affecting this
repetitive segment and its flanking regions (Kim et al., 2006). Assuming that we have indeed
captured the same numt, and given that these deletions have different start and end positions
in this region, we infer that they occurred independently in each lineage, after the original
12
3.2 Panthera onca mitogenome organization
The complete mitogenome sequence of P. onca was deposited in GenBank under accession number XXXXXX. Due to differences in the control region length, mostly caused
by the RS-3 repetitive sequences, the jaguar mitogenome ranged in size from 16,856 bp to
17,066 bp. As expected, the jaguar mitogenome comprises 13 protein-coding genes, two
mitochondrial ribosomal RNA subunits genes (rRNAs), 22 transfer RNAs (tRNAs) genes and
the control region (Tab. 3).
To annotate gene boundaries, we tested two frequently used online organellar genome
software packages, DOGMA and MITOS. The latter program performed better in the
prediction of gene boundaries, but neither was 100% accurate. At the same time, orientation
of gene transcription (L-strand or H-strand) was accurate with both programs. MITOS
predicted 20 tRNA gene boundaries precisely, but the remaining edges were not perfectly
identified (Supplementary Tab.3). We therefore decided to perform the final annotation of the
jaguar mitogenome by hand, using the Felis catus mitogenome (accession NC001700; Lopez et al., 1996) as a reference, validated by additional comparisons to other mammals.
The jaguar mitochondrial genome presented the same content and the same
transcriptional orientation for homologous genes as other mammals (Tab. 3). The nad1, nad2,
nad3, nad4, nad6 and cox3 genes did not contain complete termination codons, which should be generated post-transcriptionally by the polyadenilation of their respective mRNAs (Ojala et
al., 1981; Bobrowicz et al., 2008; Torres et al., 2009). Overall, we detected 48 transcripts with 3’-end poly-A stretches (Supplementary Tab. 2), which likely represent polyadenilated mature mRNAs. Transcripts from all six tissue samples presented poly-A stretches after the nad4,
nad2 and trnS2 genes. In five of the six samples, we also observed a poly-A tail after nad3,
cyt. B, and cox2. Finally, we also observed poly-A stretches after the trnE and atp6 genes for four different tissue samples. Such observations should be useful to document patterns of
polyadenilation in different mammalian groups, and should become more common if the use
of RNA-seq for mtDNA characterization is expanded.
13
Before we performed phylogenetic analyses, we assessed the composition and
information content of several subsets of the mitogenome alignments to check for potential
biases that could affect the results. Among the 13 protein-coding genes, we verified the
nucleotide composition of each locus and compared it to the overall average. We observed
minor differences in base composition in the atp8 and nad6 genes (Supplementary Fig. 3), but
did not find evidence that they could bias the phylogenetic results. Although other studies
(e.g. Paton et al., 2002; Nabholz et al., 2010) have removed the nad6 gene because it often
presents an outlier nucleotide composition and is encoded in the L-strand (see Fig. 1), in this
case we saw no reason to exclude it from the analysis, and therefore kept it in all data sets
described below.
The first set of phylogenetic analyses, including all Panthera mitogenomes plus those
of Neofelis nebulosa and F. catus, as well as the F. catus and P. tigris numts (see Tab. 2), and
excluding ambiguously aligned sites, resulted in a topology that was congruently supported
by almost all methods (Fig.2A). The only exception was MP, which showed a sister-group
relationship between P. onca and P. uncia, albeit with low (52%) bootstrap support. All other
methods tended to provide moderate to strong support to all nodes in the consensus tree (Tab.
4). As expected, the F. catus mitogenome and numt grouped together, and the P. tigris numt
grouped with the Panthera mitogenomes, which is consistent with previous analyses
assessing the respective origins of these nuclear insertions (Lopez et al., 1996; Kim et al.,
2006). However, our topology did not reconstruct the P. tigris numt as a sister-lineage to a
monophyletic group of Panthera mitogenomes, which would be expected given the inference
that this nuclear translocation occurred only once, before the divergence of extant Panthera
species (Kim et al., 2006). Rather, our trees provided high support for the tiger mitogenome
being the most basal lineage in the clade formed by node 5 in Fig. 2A (see Tab. 4). The most
likely explanation for this result is that the tiger mitogenome presents an accelerated rate of
nucleotide substitution relative to the other Panthera species, leading it to undergo
long-branch-attraction with the outgroup N. nebulosa , and thus drawing it to the base of this clade.
The same conclusion was reached by Davis et al. (2010) when discussing the discrepancy
observed between the topologies reconstructed with their nuclear vs. mtDNA data sets.
The final set of analyses, including only the mitogenomes of Panthera spp. and the N.
nebulosa outgroup, yielded strong and congruent support to a single phylogenetic topology
(Fig. 2B). This tree was consistent with the results obtained in the initial set of analyses (Fig.
14 additional sequences (F. catus and numts). There was maximum support for the sister-group
relationship between lion and leopard with all methods and all data sets (Tab. 5). The same
was observed with respect to the basal position of the tiger within the Panthera genus. The
node uniting the snow leopard (P. uncia) with the lion/leopard clade (node 2 in Fig. 2B)
continued to present less support than the other two, but this set of analyses revealed an
increased robustness of this relationship. Of the four optimality criteria, MP was the only one
that consistently failed to recover this relationship with high support, but at the same time it
did not support any alternative topology. Furthermore, the MP support increased (as did the
NJ and ML support) when only protein-coding genes were analyzed (see Tab. 5). This
observation indicates that homoplasy in the control region and in tRNA and rRNA segments
may be a source of noise that negatively affects the resolution if this node. The protein-coding
data set should be less affected by homoplasy, and thus provides a more conservative
assessment of the phylogeny. Although it included less information (i.e. fewer nucleotide
sites), this data set consistently yielded higher support values for the inferred topology,
suggesting that its signal-to-noise ratio was better than those of the other two data sets.
Overall, these results indicate that the topology recovered here is quite robust, and
reflects the mitochondrial genealogy of genus Panthera. Interestingly, this topology differs
from the recent reconstruction of Panthera relationships based on a large supermatrix
including some mtDNA segments along with substantial information from autosomal,
X-linked and Y-X-linked genes (Davis et al., 2010). Both studies strongly support a sister-group
relationship between lion and leopard, but here the snow leopard (P. uncia) is the sister-group
to the lion/leopard clade. In contrast, Davis et al. (2010) found strong support for the jaguar
(P. onca) as a sister lineage to lion/leopard, which is consistent with morphological data
supporting lion/leopard/jaguar as a monophyletic subgenus Panthera (Hemmer 1978). Our
interpretation of this difference is that the lion/leopard/jaguar clade most likely reflects the
correct genomic/organismal phylogeny, while the distinct mitochondrial topology represents a
case of true genealogical discordance induced by incomplete lineage sorting during the rapid
diversification of Panthera lineages. Another factor that may have affected the mtDNA
topology is homoplasy at fast-evolving sites. As mentioned above, our results (as well as the
observation by Davis et al. [2010]) suggest that the tiger mitogenome presents an accelerated
rate of substitution that induces long-branch-attraction towards the outgroup N. nebulosa.
Such a process would tend to place the tiger mitogenome at the base of Panthera, and
15 which was detected with the supermatrix data (Davis et al., 2010) with high support. In combination, these two processes can account for the differences observed between the supermatrix results (vastly dominated by the nuclear signal) and the mitogenome genealogy resolved here.
As we were finalizing this article for submission, an independently generated sequence of the jaguar mitogenome became available in GenBank (accession number KF483864). We compared it to our sequence and found it to be 98% identical, and to bear essentially the same average nucleotide composition. Phylogenetic analyses showed that the two jaguar sequences clustered together with maximum support in every case, and that their joint position within Panthera was the same as the one we observed with our data alone. At the same time, we observed that an additional lion mitogenome has recently also become available in GenBank (accession KF776494), and performed the same exercise. Again, we observed that the two lions grouped together with maximum support, and their position was the same as we report here.
Conclusions
16 References
Anderson, S., Bankier, A. T., Barrell, B. G., De Bruijn, M. H. L., Coulson, A. R., Drouin, J., ... & Young, I. G. (1981). Sequence and organization of the human mitochondrial genome. Nature, 290, 457 – 465.
Antunes, A., Pontius, J., Ramos, M. J., O'Brien, S. J., & Johnson, W. E. (2007). Mitochondrial introgressions into the nuclear genome of the domestic cat. Journal of Heredity, 98(5), 414-420.
Asin-Cayuela, J., & Gustafsson, C. M. (2007). Mitochondrial transcription and its regulation in mammalian cells. Trends in biochemical sciences, 32(3), 111-117.
Bagatharia, S. B., Joshi, M. N., Pandya, R. V., Pandit, A. S., Patel, R. P., Desai, S. M., ... & Saxena, A. K. (2013). Complete mitogenome of asiatic lion resolves phylogenetic status within Panthera. BMC genomics, 14(1), 572.
Bensasson, D., Zhang, D. X., Hartl, D. L., & Hewitt, G. M. (2001). Mitochondrial
pseudogenes: evolution's misplaced witnesses. Trends in Ecology & Evolution, 16(6), 314-321.
Bernt, M., Donath, A., Jühling, F., Externbrink, F., Florentz, C., Fritzsch, G., ... & Stadler, P. F. (2013). MITOS: Improved de novo Metazoan Mitochondrial Genome
Annotation. Molecular Phylogenetics and Evolution,69(2), 313-319.
Blankenberg, D., Kuster, G. V., Coraor, N., Ananda, G., Lazarus, R., Mangan, M., ... & Taylor, J. (2010). Galaxy: A Web‐Based Genome Analysis Tool for
Experimentalists. Current protocols in molecular biology, 19-10.
Bobrowicz, A., Lightowlers, R., & Chrzanowska-Lightowlers, Z. (2008). Polyadenylation and degradation of mRNA in mammalian mitochondria: a missing link?. Biochemical Society Transactions, 36(Pt 3), 517.
Cheng, S., Higuchi, R., & Stoneking, M. (1994). Complete mitochondrial genome amplification. Nature genetics, 7(3), 350-351.
Chomczynski, P., & Sacchi, N. (1987). Single-step method of RNA isolation by acid
guanidinium thiocyanate-phenol-chloroform extraction. Analytical biochemistry, 162(1), 156-159.
Clayton, D. A. (1991). Replication and transcription of vertebrate mitochondrial DNA. Annual review of cell biology, 7(1), 453-478.
Cracraft, J., Feinstein, J., Vaughn, J., & Helm‐Bychowski, K. (1998). Sorting out tigers (Panthera tigris): mitochondrial sequences, nuclear inserts, systematics, and conservation genetics. Animal Conservation, 1(2), 139-150.
17 Davis, B. W., Li, G., & Murphy, W. J. (2010). Supermatrix and species tree methods resolve phylogenetic relationships within the big cats, Panthera (Carnivora: Felidae). Molecular Phylogenetics and Evolution, 56(1), 64-76.
Drummond, A. J., Suchard, M. A., Xie, D., & Rambaut, A. (2012). Bayesian phylogenetics with BEAUti and the BEAST 1.7. Molecular biology and evolution, 29(8), 1969-1973.
Fabre, P. H., Jønsson, K. A., & Douzery, E. J. (2013). Jumping and gliding rodents: Mitogenomic affinities of Pedetidae and Anomaluridae deduced from an RNA-Seq approach. Gene, 531(2), 388-397.
Giardine, B., Riemer, C., Hardison, R. C., Burhans, R., Elnitski, L., Shah, P., ... & Nekrutenko, A. (2005). Galaxy: a platform for interactive large-scale genome analysis. Genome research, 15(10), 1451-1455.
Goecks, J., Nekrutenko, A., Taylor, J., & Team, T. G. (2010). Galaxy: a comprehensive approach for supporting accessible, reproducible, and transparent computational research in the life sciences. Genome Biol, 11(8), R86.
Grabherr, M. G., Haas, B. J., Yassour, M., Levin, J. Z., Thompson, D. A., Amit, I., ... & Regev, A. (2011). Full-length transcriptome assembly from RNA-Seq data without a reference genome. Nature biotechnology, 29(7), 644-652.
Hampton, M., Melvin, R. G., Kendall, A. H., Kirkpatrick, B. R., Peterson, N., & Andrews, M. T. (2011). Deep sequencing the transcriptome reveals seasonal adaptive mechanisms in a hibernating mammal. PloS one, 6(10), e27021.
Hazkani-Covo, E., Zeller, R. M., & Martin, W. (2010). Molecular poltergeists: mitochondrial DNA copies (numts) in sequenced nuclear genomes. PLoS Genetics, 6(2), e1000834.
Hemmer, H. (1978). The evolutionary systematics of living Felidae: present status and current problems. Carnivore, 1, 71–79.
Hoelzel, A. R., Lopez, J. V., Dover, G. A., & O'Brien, S. J. (1994). Rapid evolution of a heteroplasmic repetitive sequence in the mitochondrial DNA control region of
carnivores. Journal of molecular evolution, 39(2), 191-199.
Jae-Heup, K., Eizirik, E., O'Brien, S. J., & Johnson, W. E. (2001). Structure and patterns of sequence variation in the mitochondrial DNA control region of the great
cats. Mitochondrion, 1(3), 279-292.
Johnson, W. E., Dratch, P. A., Martenson, J. S., & O'Brien, S. J. (1996). Resolution of recent radiations within three evolutionary lineages of Felidae using mitochondrial restriction fragment length polymorphism variation. Journal of Mammalian Evolution, 3(2), 97-120.
18 platform for the organization and analysis of sequence data. Bioinformatics, 28(12), 1647-1649.
Kim, J. H., Antunes, A., Luo, S. J., Menninger, J., Nash, W. G., O'Brien, S. J., & Johnson, W. E. (2006). Evolutionary analysis of a large mtDNA translocation (numt) into the nuclear genome of the Panthera genus species. Gene, 366(2), 292-302.
Lei, R., Shore, G. D., Brenneman, R. A., Engberg, S. E., Sitzmann, B. D., Bailey, C. A., ... & Louis Jr, E. E. (2010). Complete sequence and gene organization of the mitochondrial
genome for Hubbard's sportive lemur (Lepilemur hubbardorum). Gene, 464(1), 44-49.
Lopez, J. V., Cevario, S., & O'Brien, S. J. (1996). Complete Nucleotide Sequences of the Domestic Cat (Felis catus) Mitochondrial Genome and a Transposed mtDNA Tandem Repeat (Numt) in the Nuclear Genome. Genomics, 33(2), 229-246.
Lopez, J. V., Yuhki, N., Masuda, R., Modi, W., & O'Brien, S. J. (1994). Numt, a recent transfer and tandem amplification of mitochondrial DNA to the nuclear genome of the domestic cat. Journal of Molecular Evolution, 39(2), 174-190.
Machida, R. J., Miya, M. U., Nishida, M., & Nishida, S. (2002). Complete mitochondrial DNA sequence of Tigriopus japonicus (Crustacea: Copepoda). Marine Biotechnology, 4(4), 406-417.
Nabholz, B., Jarvis, E. D., & Ellegren, H. (2010). Obtaining mtDNA genomes from next-generation transcriptome sequencing: a case study on the basal Passerida (Aves:
Passeriformes) phylogeny. Molecular phylogenetics and evolution, 57(1), 466-470.
Neira‐Oviedo, M., Tsyganov‐Bodounov, A., Lycett, G. J., Kokoza, V., Raikhel, A. S., & Krzywinski, J. (2011). The RNA‐Seq approach to studying the expression of mosquito mitochondrial genes. Insect molecular biology, 20(2), 141-152.
Ojala, D., Montoya, J., & Attardi, G. (1981). tRNA punctuation model of RNA processing in human mitochondria. Nature290, 470 – 474.
Paton, T., Haddrath, O., & Baker, A. J. (2002). Complete mitochondrial DNA genome sequences show that modern birds are not descended from transitional
shorebirds. Proceedings of the Royal Society of London. Series B: Biological Sciences, 269(1493), 839-846.
Sambrook, J., Russell, D. W., & Russell, D. W. (2001). Molecular cloning: a laboratory manual 1, 3.ed., New York: Cold Spring Harbour Laboratory Press.
Silvestro, D., & Michalak, I. (2012). raxmlGUI: a graphical front-end for RAxML.Organisms Diversity & Evolution, 12(4), 335-337.