Insight into the Interactions between Novel
Isoquinolin-1,3-Dione Derivatives and Cyclin-Dependent
Kinase 4 Combining QSAR and Molecular Docking
Junxia Zheng1, Hao Kong2, James M. Wilson3, Jialiang Guo2, Yiqun Chang2, Mengjia Yang2, Gaokeng Xiao2, Pinghua Sun2,3,4*
1Faculty of Chemical Engineering and Light Industry, Guangdong University of Technology, Guangzhou, P. R. China,2Department of Medicinal Chemistry, College of Pharmacy, Jinan University, Guangzhou, P. R. China,3Department of Drug Discovery, H. Lee Moffitt Cancer Center and Research Institute, Tampa, Florida, United States of America,4College of Pharmacy, University of South Florida, Tampa, Florida, United States of America
Abstract
Several small-molecule CDK inhibitors have been identified, but none have been approved for clinical use in the past few years. A new series of 4-[(3-hydroxybenzylamino)-methylene]-4H-isoquinoline-1,3-diones were reported as highly potent and selective CDK4 inhibitors. In order to find more potent CDK4 inhibitors, the interactions between these novel isoquinoline-1,3-diones and cyclin-dependent kinase 4 was explored via in silico methodologies such as 3D-QSAR and docking on eighty-one compounds displaying potent selective activities against cyclin-dependent kinase 4. Internal and external cross-validation techniques were investigated as well as region focusing, bootstraping and leave-group-out. A training set of 66 compounds gave the satisfactory CoMFA model (q2= 0.695,r2= 0.947) and CoMSIA model (q2= 0.641,
r2= 0.933). The remaining 15 compounds as a test set also gave good external predictive abilities withr2predvalues of 0.875
and 0.769 for CoMFA and CoMSIA, respectively. The 3D-QSAR models generated here predicted that all five parameters are important for activity toward CDK4. Surflex-dock results, coincident with CoMFA/CoMSIA contour maps, gave the path for binding mode exploration between the inhibitors and CDK4 protein. Based on the QSAR and docking models, twenty new potent molecules have been designed and predicted better than the most active compound12in the literatures. The QSAR, docking and interactions analysis expand the structure-activity relationships of constrained isoquinoline-1,3-diones and contribute towards the development of more active CDK4 subtype-selective inhibitors.
Citation:Zheng J, Kong H, Wilson JM, Guo J, Chang Y, et al. (2014) Insight into the Interactions between Novel Isoquinolin-1,3-Dione Derivatives and Cyclin-Dependent Kinase 4 Combining QSAR and Molecular Docking. PLoS ONE 9(4): e93704. doi:10.1371/journal.pone.0093704
Editor:Eugene A. Permyakov, Russian Academy of Sciences, Institute for Biological Instrumentation, Russian Federation
ReceivedDecember 12, 2013;AcceptedMarch 6, 2014;PublishedApril 10, 2014
Copyright:ß2014 Zheng et al. This is an open-access article distributed under the terms of the Creative Commons Attribution License, which permits unrestricted use, distribution, and reproduction in any medium, provided the original author and source are credited.
Funding:This work was supported by the grant from National Nature Science Foundation of China (81202889). The funders had no role in study design, data collection and analysis, decision to publish, or preparation of the manuscript.
Competing Interests:The authors have declared that no competing interests exist.
* E-mail: [email protected]
Introduction
Cyclin-dependent kinases (CDKs), a family of serine/threonine protein kinases, play a central role in the growth, development, proliferation and death of eukaryotic cells [1,2]. There are more than 13 CDKs of which 12 different cyclin families have been identified up to now, and different CDK/cyclin combinations are active during each phase of the cell cycle [3–5]. Among these CDK/cyclin complexes, the D/CDK4 and E/CDK2 complexes have been greatly concerned [6]. In the G1-S phase transition, the retinoblastoma susceptibility gene family of proteins (Rb) was phosphorylated by the D-type cyclins (D1, D2 or D3) in combination with CDK4 and cyclin E/CDK2 complexes. Phosphorylation of the Rb activated the E2F transcription factors and resulted in the transcription of genes required for DNA synthesis. This kind of function exerted by D/CDK4 and E/ CDK2 complexes is positively regulated by the mitogenic signaling pathways and negatively regulated by the cyclin-dependent kinase inhibitors (CKIs) [7–13]. Inhibition of cyclin-dependent kinases (CDKs) with small molecules has been suggested as a strategy for treatment of cancer, based on deregulation of CDKs commonly
found in many types of human tumors. Selective CDK inhibitors such as CYC-202 [14] and BMS-387032 [15] targeting CDK2, and PD0332991 [16] targeting CDK4 have been under clinical evaluations. Recently, a series of novel isoquinoline-1, 3-(2H, 4H )-diones have been found to possess excellent selective inhibitory activity against the CDK4 [7,8].
The three-dimensional quantitative structure-activity relation-ship (3D-QSAR) models derived from the most widely used computational methods, CoMFA (comparative molecular field analysis) and CoMSIA (comparative molecular similarity indices analysis), could be used to guide rational synthesis of potent novel inhibitors and now aimed to elucidate the structural features required for CDK4 inhibitors. The best developed models have been duly validated by a systemic external validation, on the basis of which a set of twenty new potent molecules have been designed and predicted stronger activity than12,the most active compound reported in the literatures[7,8].
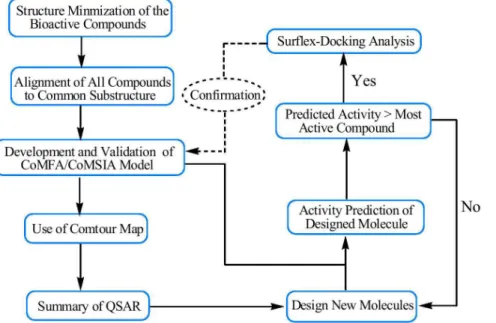
sites, docking uses an incremental construction algorithm to place flexible ligands into a fully specified active site. Surflex-Dock is particularly successful at eliminating false positive results and therefore used to narrow down the screening pool significantly, while retaining a large number of active compounds. The binding interactions of the isoquinolinedione derivatives within the CDK4 active sites were discussed. The step-wise description of method-ology used for 3D-QSAR analysis, molecular docking and designing of new CDK4 inhibitors is as shown in Figure 1.
Materials and Methods
Data Set
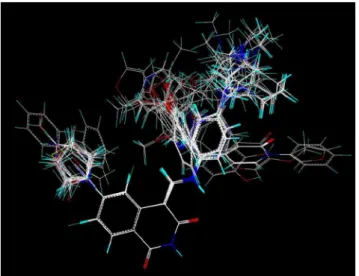
All isoquinoline-1,3-(2H,4H)-dione derivatives and their biolog-ical activities were collected from literatures [7,8] (Figure 2). A total set of 81 molecules were randomly segregated into training and test sets comprising 66 and 15 molecules, respectively, based on the following rules: (i) Diversity of the molecules was very necessary to assess the statistical significance. (ii) To avoid any redundancy or bias in terms of structure features and activity range, the information of the selected compounds must be clear and concise. (iii) The most active and least active compounds should be included in the training set. The activities of the CDK4 inhibitors were reported in IC50 and converted to pIC50 by taking Log (1/IC50) for the convenience. The activity range from 4.6 to 8.6 log units of these compounds provided a broad and homogenous data set for 3D-QSAR study. In general, the spread of activity should cover at least 3 log units for a reliable 3D-QSAR model [22].
Molecular Modeling and Alignment
The structures of the derivatives were sketched in SYBYL 8.1 (Tripos, Inc., St. Louis, MO, USA) molecular modeling package and Gasteiger-Hu¨ckel charges were assigned to the atoms of all the compounds. A good alignment is the most essential for the quality and the predictive ability of CoMFA and CoMSIA models [23], and common substructure, pharmacophore or docking overlaps can be available to align molecules [24,25]. The isoquinoline-1,
3-(2H, 4H)-dione ring with structural rigidity was selected as the common substructure and the compound12 with the strongest inhibitory activity as the template molecule (Figure3). It can be seen that all the compounds studied have similar active conformations.
CoMFA and CoMSIA Setup
Three-dimensional grid spacing was set at 2 A˚ in the x, y, and z directions. The steric and electrostatic field energies were calculated using the Lennard-Jones and the Coulomb potentials [26]. For CoMFA method, asp3hybridized carbon atom with a+1 charge was identified as the probe atom to determine the magnitude of the steric and electrostatic field values, whose truncation was set at 30 kcal/mol [27–29].
The CoMSIA method, similar to CoMFA in terms of fields around the molecule, was based on the assumption that changes of ligands in binding affinities are associated with changes of molecular properties. Besides steric and electrostatic fields, three other different fields of hydrophobic, hydrogen bond donor and hydrogen bond acceptor are also calculated [30]. Moreover, a Gaussian function introduced in similarity indices makes it be calculated at all grid points, inside and outside different molecular surfaces. Equation used to calculate the similarity indices is as follows:
AqF,K(j)~
X
i
Wprobe,kWike{ ar2
iq
Where,Ais the similarity index at grid pointq, summed over all atomsiof the moleculejunder investigation.Wprobe, kis the probe atom with radius 1 A˚ , charge +1, hydrophobicity +1, hydrogen bond donating +1 and hydrogen bond accepting +1. Wik is the actual value of the physicochemical propertykof atomi.riqis the mutual distance between the probe atom at grid pointqand atomi
of the test molecule. a is the attenuation factor whose optimal
value is normally between 0.2 and 0.4, with a default value of 0.3 [31].
Figure 1. Step-wise description ofmethodology used for 3D-QSAR analysis, molecular docking and designing of new inhibitors for CDK4.
Partial Least Squares (PLS) Analysis
For Partial Least Squares (PLS) analysis [32], the ‘‘leave-one-out’’ cross-validation method was first carried out to generate a cross-validated r2 (q2) value and the optimal number of compo-nents (ONC), based on the lowest standard error of prediction (SEP) which usually corresponds to the highest cross-validated squared coefficient (q2). To avoid over-fitting the models, a higher
component was accepted only when theq2 differences between two components was larger than 10% [24]. Region focusing was performed to maximizeq2value by rotating the extracted principal components [33]. Theq2 is a good indicator of the accuracy of actual predictions and aq2value of 0.5 means halfway between no model and a perfect model [34]. Non-cross-validation was then executed to establish the final 3D-QSAR model after the optimal
number of components was determined. The consequential final PLS models gave the conventional correlation coefficient (r2), standard errors of estimate (SEE) and F ratio between the variances of calculated and observed activities. The equation for SEE is given below
SEE~
ffiffiffiffiffiffiffiffiffiffiffiffiffiffiffiffiffi
PRESS n{c{1
r
Where, n and c is the number of compounds and components, respectively, and PRESS is the sum of squared deviations between predicted and actual activity values for each molecule in the test set.
External Validation
q2 is often a useful but not sufficient criterion for model validation. In many cases, a model with highr2
cvandr2values were
proved to be inaccurate. Even though a model may exhibit a good
predictive ability based on the statistics for the test set, it is not always sure that the model will perform well on a new set of data [35]. Therefore, an external test sets (r2
pred) [36] was recommended
for the estimation of predictive ability. Predictive valuesr2
pred were
calculated as follows:
r2pred~1{(PRESS=SD)
Therein, SD is the sum of squared differences between the measured activities of the test set and the average measured activity of the training set.
Several other statistics such asr2m,r20, R and k were calculated
using the following equations, and 3D-QSAR models were considered acceptable only if they satisfy the following conditions:
r2cv.0.5,r2.0.6, [(r22r02)/r2],0.1, 0.85#k#1.15 and r2m.0.5
[36,37].
R~
P
(yi{yyo)(yy~i{yyp) ffiffiffiffiffiffiffiffiffiffiffiffiffiffiffiffiffiffiffiffiffiffiffiffiffiffiffiffiffiffiffiffiffiffiffiffiffiffiffiffiffiffiffiffiffiffiffi P
(yi{yyo) P
(~yyi{yyp)2 q
rm2~r2 1{
ffiffiffiffiffiffiffiffiffiffiffiffiffiffiffiffiffi Dr2
{r02D
p
r20~1{
P
(~yyi{y
r0 i )2 P
(~yyi{~yyp)2
k~
P
yi~yyi P
~ y y2
i
yir0~k~yyi
Where, yi and yyp are the actual and predicted activities,
respectively. yyo and yyp are the average values of the observed
and predicted pIC50values of the test set molecules, respectively.r2
is the non-cross-validated correlation coefficient from PLS process.
Molecular Docking
Surflex-Dock in SYBYL 8.1, using a patented search engine and an empirical scoring function to dock ligands into a protein’s binding site [19], was applied to study molecular docking in the
Figure 3. Alignment of the compounds used in the training set. doi:10.1371/journal.pone.0093704.g003
Table 1.PLS results of CoMFA and CoMSIA models.
CoMFA(before region focusing) CoMFA (after region focusing) CoMSIA
PLSstatistics
LOO crossq2/SEP 0.544/0.727 0.695/0.348 0.641/0.496
Group crossq2/SEP 0.578/0.706 0.711/0.334 0.638/0.498
Non-validatedr2/SEE 0.914/0.294 0.947/0.185 0.933/0.210
F 104.511 139.423 121.534
r2bootstrap 0.91660.023 0.96560.010 0.92860.015
Sbootstrap 0.28560.098 0.15260.071 0.23160.135
Optimal components 6 6 6
Field distribution%
Steric 45.0 47.9 16.0
Electrostatic 55.0 52.1 25.2
Hydrophobic 18.9
H-bond Donor 10.1
H-bond Acceptor 29.8
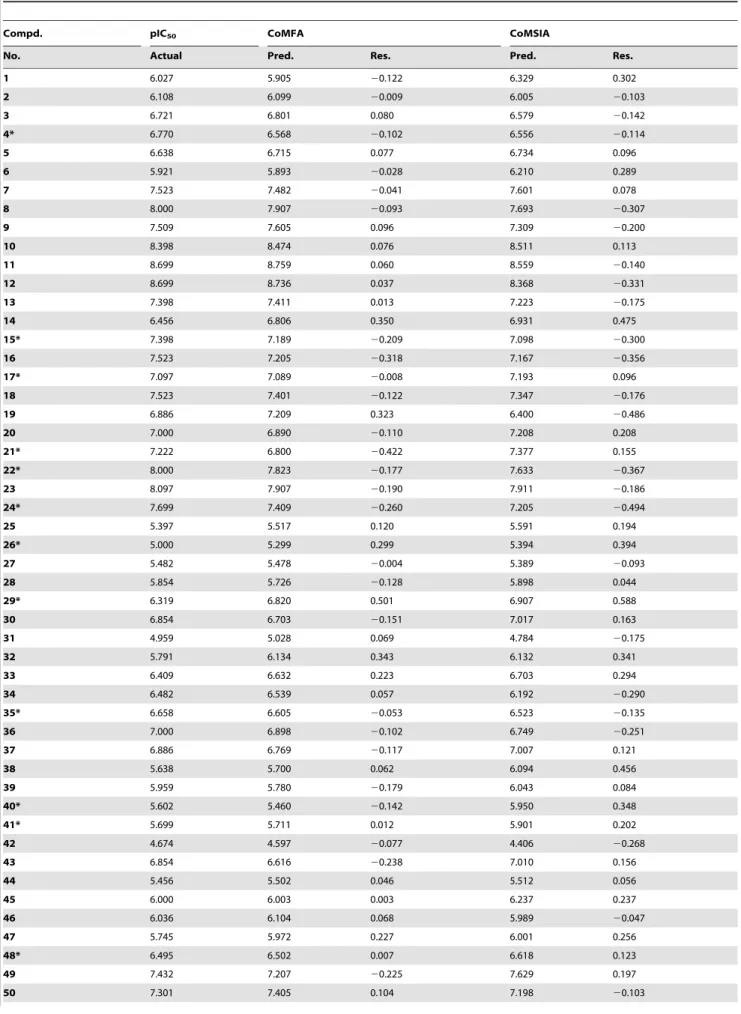
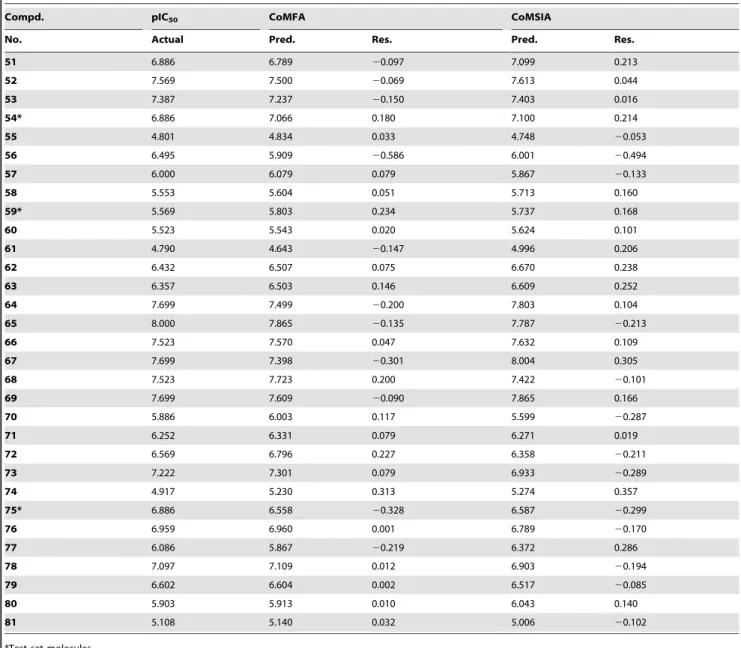
Table 2.The actual pIC50, predicted pIC50(Pred.) and their residuals (Res.) of the training and test set molecules.
Compd. pIC50 CoMFA CoMSIA
No. Actual Pred. Res. Pred. Res.
1 6.027 5.905 20.122 6.329 0.302
2 6.108 6.099 20.009 6.005 20.103
3 6.721 6.801 0.080 6.579 20.142
4* 6.770 6.568 20.102 6.556 20.114
5 6.638 6.715 0.077 6.734 0.096
6 5.921 5.893 20.028 6.210 0.289
7 7.523 7.482 20.041 7.601 0.078
8 8.000 7.907 20.093 7.693 20.307
9 7.509 7.605 0.096 7.309 20.200
10 8.398 8.474 0.076 8.511 0.113
11 8.699 8.759 0.060 8.559 20.140
12 8.699 8.736 0.037 8.368 20.331
13 7.398 7.411 0.013 7.223 20.175
14 6.456 6.806 0.350 6.931 0.475
15* 7.398 7.189 20.209 7.098 20.300
16 7.523 7.205 20.318 7.167 20.356
17* 7.097 7.089 20.008 7.193 0.096
18 7.523 7.401 20.122 7.347 20.176
19 6.886 7.209 0.323 6.400 20.486
20 7.000 6.890 20.110 7.208 0.208
21* 7.222 6.800 20.422 7.377 0.155
22* 8.000 7.823 20.177 7.633 20.367
23 8.097 7.907 20.190 7.911 20.186
24* 7.699 7.409 20.260 7.205 20.494
25 5.397 5.517 0.120 5.591 0.194
26* 5.000 5.299 0.299 5.394 0.394
27 5.482 5.478 20.004 5.389 20.093
28 5.854 5.726 20.128 5.898 0.044
29* 6.319 6.820 0.501 6.907 0.588
30 6.854 6.703 20.151 7.017 0.163
31 4.959 5.028 0.069 4.784 20.175
32 5.791 6.134 0.343 6.132 0.341
33 6.409 6.632 0.223 6.703 0.294
34 6.482 6.539 0.057 6.192 20.290
35* 6.658 6.605 20.053 6.523 20.135
36 7.000 6.898 20.102 6.749 20.251
37 6.886 6.769 20.117 7.007 0.121
38 5.638 5.700 0.062 6.094 0.456
39 5.959 5.780 20.179 6.043 0.084
40* 5.602 5.460 20.142 5.950 0.348
41* 5.699 5.711 0.012 5.901 0.202
42 4.674 4.597 20.077 4.406 20.268
43 6.854 6.616 20.238 7.010 0.156
44 5.456 5.502 0.046 5.512 0.056
45 6.000 6.003 0.003 6.237 0.237
46 6.036 6.104 0.068 5.989 20.047
47 5.745 5.972 0.227 6.001 0.256
48* 6.495 6.502 0.007 6.618 0.123
49 7.432 7.207 20.225 7.629 0.197
Table 2.Cont.
Compd. pIC50 CoMFA CoMSIA
No. Actual Pred. Res. Pred. Res.
51 6.886 6.789 20.097 7.099 0.213
52 7.569 7.500 20.069 7.613 0.044
53 7.387 7.237 20.150 7.403 0.016
54* 6.886 7.066 0.180 7.100 0.214
55 4.801 4.834 0.033 4.748 20.053
56 6.495 5.909 20.586 6.001 20.494
57 6.000 6.079 0.079 5.867 20.133
58 5.553 5.604 0.051 5.713 0.160
59* 5.569 5.803 0.234 5.737 0.168
60 5.523 5.543 0.020 5.624 0.101
61 4.790 4.643 20.147 4.996 0.206
62 6.432 6.507 0.075 6.670 0.238
63 6.357 6.503 0.146 6.609 0.252
64 7.699 7.499 20.200 7.803 0.104
65 8.000 7.865 20.135 7.787 20.213
66 7.523 7.570 0.047 7.632 0.109
67 7.699 7.398 20.301 8.004 0.305
68 7.523 7.723 0.200 7.422 20.101
69 7.699 7.609 20.090 7.865 0.166
70 5.886 6.003 0.117 5.599 20.287
71 6.252 6.331 0.079 6.271 0.019
72 6.569 6.796 0.227 6.358 20.211
73 7.222 7.301 0.079 6.933 20.289
74 4.917 5.230 0.313 5.274 0.357
75* 6.886 6.558 20.328 6.587 20.299
76 6.959 6.960 0.001 6.789 20.170
77 6.086 5.867 20.219 6.372 0.286
78 7.097 7.109 0.012 6.903 20.194
79 6.602 6.604 0.002 6.517 20.085
80 5.903 5.913 0.010 6.043 0.140
81 5.108 5.140 0.032 5.006 20.102
*Test set molecules.
doi:10.1371/journal.pone.0093704.t002
present paper. The crystal structure of CDK4 with ligand 1GIH was retrieved from the RCSB Protein Data Bank [38]. A protomol, a computational representation of the receptor’s binding cavity to which putative ligands are aligned, was generated automatically with a threshold parameter of 0.31 and a bloat parameter of 1 A˚ , and composed of a collection of fragments or probe molecules such as CH4, N-H, and C = O that characterize steric effects in the binding pocket, hydrogen bond donor and acceptor groups, respectively.[39,40] All the water molecules and sulfate salt in CDK4 1GIH (receptor) were deleted, and hydrogen atoms and Gasteiger charges were added [41,42]. All of the eighty-one ligands were docked sequentially into the binding pocket of CDK4 using the parameters previously optimized. Surflex-Dock total scores are expressed in log10(Kd) to represent binding
affinities. The scores of 10 docked conformers of each isoquino-linedione derivatives were ranked in a molecular spreadsheet, and the highest total score was taken into consideration for ligand-receptor interactions. To visualize the binding mode between the protein and ligands, the MOLCAD (Molecular Computer Aided Design) program was applied to calculate and display the surfaces of channels and cavities, as well as the separating surface between protein subunits. MOLCAD program provides several types to create a molecular surface, in which the Robbin surfaces illustrating the secondary structure elements of the binding structure was applied to build the MOLCAD Robbin and Multi-Channel surfaces displayed with several potentials. Other parameters were established in default.
Results and Discussion
CoMFA and CoMSIA Analysis
The results taken from the PLS analysis were summarized in Table 1. The actual versus the predicted pIC50 values for the
training and the test set molecules were listed in Table 2 and depicted graphically in Figure 4. For the CoMFA model after region focusing, the leave-one-out cross-validated q2 value was 0.695 (.0.5) and non-cross-validatedr2value was 0.947 with an optimized component of 6, standard error estimate (SEE) of 0.185 andF value of 139.423. Contributions of steric and electrostatic fields were 0.479 and 0.521, respectively.
The CoMSIA model comprising all five descriptors gave a q2
value of 0.641 andr2value of 0.933 with an optimized component of 6, standard error estimate (SEE) of 0.210 and F value of 121.534. Contributions of steric, electrostatic, hydrophobic, hydrogen bond donor and acceptor fields were 0.160, 0.252, 0.189, 0.101 and 0.298, correspondingly.
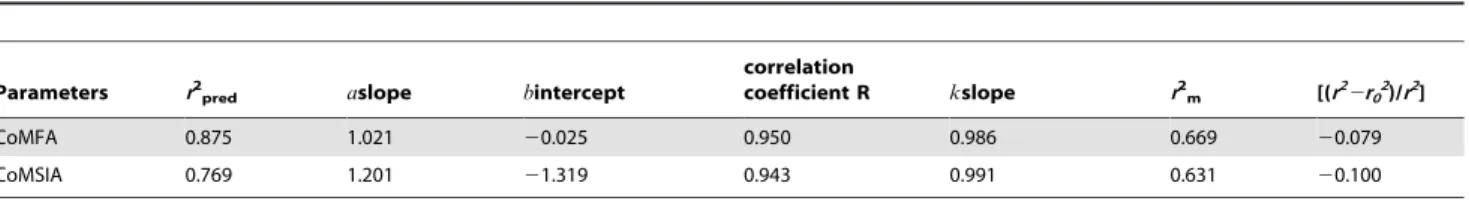
External Validation Results
The calculated results of the external validation were listed in Table3. For CoMFA and CoMSIA models, the calculatedr2pred
values were 0.875 and 0.769, with the slope (a) values of 1.021 and 1.201 (close to 1), intercept (b) values of20.025 and20.039 (close to 0) and the correlation coefficient (R) values of 0.950 and 0.943 (close to 1), respectively. The validr2
mvalues of 0.669 and 0.631
(.0.5) as well as high slope of regression lines through the origin (k) values of 0.986 and 0.991 (0.85#k#1.15) and the calculated [(r22r02)/r2] values of 20.079 and 20.100 (,0.1) were also
obtained respectively. These external validation statistics revealed that both the CoMFA and CoMSIA models possessed high accommodating capacities and they would be reliable for predicting the pIC50values of new derivatives.
CoMFA Contour Maps
Figure5. depicted the CoMFA steric and electrostatic contour plots for the most active compound12. For the steric field, the
Table 3.Results of the external validation for CoMFA and CoMSIA models.
Parameters r2
pred aslope bintercept
correlation
coefficient R kslope r2
m [(r22r02)/r2]
CoMFA 0.875 1.021 20.025 0.950 0.986 0.669 20.079
CoMSIA 0.769 1.201 21.319 0.943 0.991 0.631 20.100
doi:10.1371/journal.pone.0093704.t003
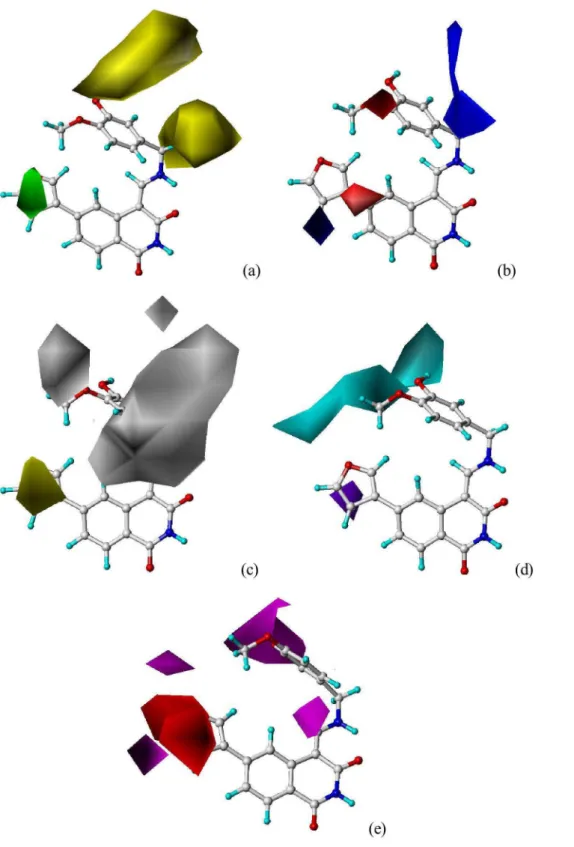
Figure 5. Std* coeff contour maps of CoMFA analysis in combination with compound 12.(a) Steric fields: green contours suggest regions where bulky groups increase activity, while yellow contours indicate regions where bulky groups decrease activity, and (b) Electrostatic fields: blue contours represent regions where electron-donating groups increase activity, while red contours highlight regions where electron-withdrawing groups increase activity.
Figure 6. Std* coeff contour maps of CoMSIA in combination with compound 12.(a) Steric contour map. Green and yellow contours refer to sterically favored and unfavored regions. (b) Electrostatic contour map. Blue and red contours refer to regions where electron-donating and electron withdrawing groups are favored. (c) Hydrophobic contour map. White and yellow contours represent regions where hydrophilic and hydrophobic substituent are favored. (d) Hydrogen bond donor contour map. The cyan and purple contours indicate favorable and unfavorable hydrogen bond donor groups. (e) Hydrogen bond acceptor contour map. The magenta and red contours demonstrated favorable and unfavorable hydrogen bond acceptor groups.
green contours represent regions of high steric tolerance (80% contribution) and the yellow contours (20% contribution) for unfavorable steric effect. The electrostatic field defined blue contours (80%) and red contours (20%) for electrondonating and -withdrawing substituents, respectively.
In Figure 5a, one huge green contour around the R1position
revealed that bulky substituents at this site would benefit the activity, and two huge yellow contours near the R2 and R3
positions suggested bulky groups at these sites unfavorable. This may explain the facts that derivatives10–12with relative bulkier groups (e.g.N-pyrrolyl, 3-furyl and 3-thienyl) at R1displayed the
strongest activity, while derivatives25–28,31–32,38–42,44–45,
47,55,57–60,74and80bearing a relative bulkier substituents (e.g. 4-methylpiperazinyl, -CH2-(1-piperidinyl)) at R3 position
showed a weak activity. Especially, derivatives5,7and8with the corresponding substituent of chloro, bromo and iodo showed their activities in the following order of5,7,8.
One red contour near the R1and one red around the R2and R3
in Figure 5bindicated an electron-withdrawing group favorable.
The most potential derivatives 10–12 possessed corresponding electron-withdrawing aromatic groups (e.g.N-pyrrolyl, 3-furyl and 3-thienyl) at R1, while the activities of compounds31–32,42and
44–46 bearing electron-donating substituents (e.g. piperidinyl, -NHAc, morpholinyl,N,N-dimethylformamido-) decreased signif-icantly. This also explained why compounds1,3–5,7–16and19– 24with the corresponding methoxyl, hydroxyl, 2-furyl, furyl, 3-pyridyl or 4-3-pyridyl group at R3showed much more active than
derivatives25–60 and74–75with electron-donating substituent (1-piperidinylmethyl, substituted piperazinyl). A blue contour around the N-10 and C-11 positions emphasized the extreme importance of the electron-donating aminomethyl group.
CoMSIA Contour Maps
The CoMSIA steric, electrostatic, hydrophobic, hydrogen bond donor and acceptor contours plots for the compound 12 were shown in Figure6. The CoMSIA steric and electrostatic contour maps (Figs.6a and 6b) were similar as the CoMFA steric and electrostatic contour maps (Figure5). For hydrophobic field, white (20% contribution) and yellow (80% contribution) contours highlighted hydrophilic and hydrophobic properties, respectively. Hydrogen bond donor and acceptor fields take the cyan (80%) and purple (20%) contours for hydrogen bond donor, and the magenta (80%) and red (20%) contours as favor and unfavor for hydrogen bond acceptor, correspondingly.
In Figure 6c, one yellow contour near the R1 region
demonstrated that a hydrophobic substituent at this site would benefit the activity. Most of the active derivatives involved in present study possessed a hydrophobic group (e.g. 3-furyl, N -pyrrolyl, 3-thienyl, bromo-, chloro-, iodo-, phenyl) at R1, while
those with only a hydrogen atom (e.g.2,3,6and25–27) exhibited significantly decreased potencies. Three pieces of white contour around the R2position highlighted the hydrophilic properties of
compounds1–25and 62–69. One purple contour near the R1
position in Figure 6d suggested a hydrogen bond donor group unfavorable. Therefore, the compounds10–12,49,50and52–53
with hydrogen bond acceptor oxygen or nitrogen atoms at R1site
exhibited better potencies. Both one red and two magenta contours located near the R1position in Figure6erevealed that
the hydrogen bond acceptor field was not very important for this site. The magenta contour near the R2 and R3 sites indicated
hydrogen bond acceptor properties favorable. The hydroxyl groups at R2 could act as hydrogen bond acceptor at the same
time. Therefore, the magenta contour confirmed the importance of the hydroxyl group at this region. Compounds7–12and 23
bearing a hydrogen bond acceptor substituent (methoxyl, 4-pyridyl) at R3showed the most activities.
Figure 7. The binding mode between selected compound 12 and the ATP pocket of CDK4 (PDB code: 1GIH).
doi:10.1371/journal.pone.0093704.g007
Molecular Docking Analysis
Figure7. illustrated the binding modes between compound12
and the ATP pocket. The carbonyl group at C-3 position acted as a hydrogen bond acceptor by forming a H-bond with the -NH group of Leu83 residue; the imino group at N-10 position served as a hydrogen bond donor and formed H-bond with the carbonyl group of Gln131 residue; the hydroxyl group at R2site acted as
both hydrogen bond donor and acceptor and formed two H-bonds with the carbonyl group of Asp145 and the -NH group of Asn132 residues, respectively. The observations taken from Figure 7
satisfactorily matched the corresponding CoMSIA hydrogen bond donor and acceptor contour maps.
Summary of Structure-activity Relationship
The structure-activity relationship revealed by 3D-QSAR and docking studies was illustrated in Figure 8. In short, the bulky, electron-withdrawing, hydrophobic and hydrogen bond acceptor groups at R1 position are favorable; the minor,
electron-withdrawing, hydrophilic, hydrogen bond donor and acceptor groups at R2 position may benefit the potency; the minor,
electron-withdrawing and hydrogen bond acceptor substituent at R3position would increase the activity. The carbonyl group at C-3
and the imino group at N-10 site were essential for binding to the ATP pocket of CDK4.
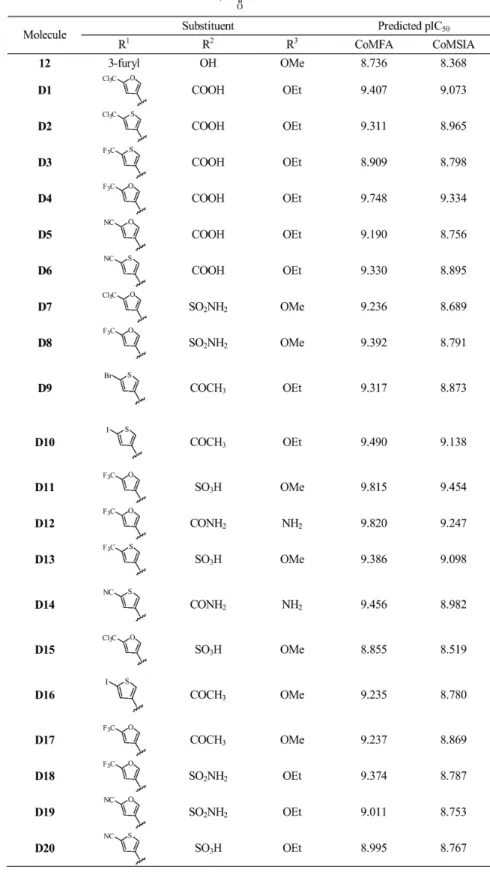
Designing of Potent Derivatives
Based on the structure-activity relationship revealed by the present study, twenty novel isoquinoline- 1, 3-(2H,4H)-dione derivatives were designed. These molecules were aligned to the database and their activities were predicted better than compound
12 by the best CoMFA and CoMSIA models established
previously, especiallyD4, D11 and D12 showed 10 folds more active than compound12. The chemical structures and predicted pIC50 values of these compounds were shown in Figure9. The
results validated the structure-activity relationship in this present work.
Conclusions
In this frame-work, a combined docking and 3D-QSAR analysis was performed to explore the interactions between isoquinoline-1,3-diones and CDK4 protein. The satisfactory CoMFA model (q2= 0.695,r2= 0.947) and CoMSIA model (q2= 0.641,r2= 0.933)
showing good correlative and predictive abilities were obtained via internal and external cross-validation techniques, region focusing, bootstraping and leave-group-out. Our analyses found that all five parameters (steric, electrostatic, hydrophobic, hydrogen bond donor and acceptor properties) are highly desirable for potent inhibitory activity. The contour maps and the docking binding structures showed that the carbonyl group at C-3 and the imino group at N-10 site were necessary for binding to the ATP pocket of CDK4. Based on the interactions, twenty new designed molecules predicted higher activities than compound12, confirming that the models could provide a valuable clue for the development of more active CDK4 subtype-selective inhibitors.
Author Contributions
Conceived and designed the experiments: PS JZ JMW GX. Performed the experiments: JZ HK JMW YC. Analyzed the data: PS JZ YC MY. Contributed reagents/materials/analysis tools: PS JG GX. Wrote the paper: PS JZ JMW.
References
1. Chu XJ, DePinto W, Bartkovitz D, So SS, Vu BT, et al. (2006) Discovery of [4-Amino-2-(1-methanesulfonyl-piperidin-4-ylamino)pyrimidin-5-yl] (2,3-difluoro-6-methoxyphenyl) methanone (R547), a potent and selective cyclin-dependent kinase inhibitor with significant in vivo antitumor activity. J Med Chem 49: 6549–6560.
2. Kuo GH, Deangelis A, Emanuel S, Wang A, Zhang Y, et al. (2005) Synthesis and identification of [1,3,5]triazine-pyridine biheteroaryl as a novel series of potent cyclin-dependent kinase inhibitors. J Med Chem 48: 4535–4546. 3. Shimamura T, Shibata J, Kurihara H, Mita T, Otsuki S, et al. (2006)
Identification of potent 5-pyrimidinyl-2-aminothiazole CDK4, 6 inhibitors with significant selectivity over CDK1, 2, 5, 7, and 9. Bioorg Med Chem Lett 16: 3751–3754.
4. Jones CD, Andrews DM, Barker AJ, Blades K, Daunt P, et al. (2008) The discovery of AZD5597, a potent imidazole pyrimidine amide CDK inhibitor suitable for intravenous dosing. Bioorg Med Chem Lett 18: 6369–6373. 5. Power DP, Lozach O, Meijer L, Grayson DH, Connon SJ (2010) Concise
synthesis and CDK/GSK inhibitory activity of the missing 9-azapaullones. Bioorg Med Chem Lett 20: 4940–4944.
6. McInnes C, Wang S, Anderson S, O’Boyle J, Jackson W, et al. (2004) Structural determinants of CDK4 inhibition and design of selective ATP competitive inhibitors. Chem Biol 11: 525–534.
7. Tsou HR, Liu X, Birnberg G, Kaplan J, Otteng M, et al. (2009) Discovery of 4-(benzylaminomethylene)isoquinoline-1,3-(2H,4H)-diones and 4-[(pyridylmethyl) aminomethylene] isoquinoline-1,3-(2H,4H)-diones as potent and selective inhibitors of the cyclin-dependent kinase 4. J Med Chem 52 : 2289–2310. 8. Tsou HR, Otteng M, Tran T, Floyd MB Jr, Reich M, et al. (2008)
4-(Phenylaminomethy- lene)isoquinoline-1,3(2H,4H)-diones as potent and selective inhibitors of the cyclin-dependent kinase 4 (CDK4). J Med Chem 51: 3507–3525.
9. Amendola D, DeSalvo M, Marchese R, Verga FC, Stigliano A, et al. (2009) Myc down-regulation affects cyclin D1/cdk4 activity and induces apoptosis via Smac/Diablo pathway in an astrocytoma cell line. Cell Prolif 42: 94–109. 10. Pratt DJ, Bentley J, Jewsbury P, Boyle FT, Endicott JA, et al. (2006) Dissecting
the determinants of cyclin-dependent kinase 2 and cyclin-dependent kinase 4 inhibitor selectivity. J Med Chem 49: 5470–5477.
11. Heady L, Fernandez-Serra M, Mancera RL, Joyce S, Venkitaraman AR, et al. (2006) Novel structural features of CDK inhibition revealed by an ab initio computational method combined with dynamic simulations. J Med Chem 49: 5141–5153.
12. Lu H, Schulze-Gahmen U (2006) Toward understanding the structural basis of cyclin-dependent kinase 6 specific inhibition. J Med Chem 49: 3826–3831. 13. Horiuchi T, Chiba J, Uoto K, Soga T (2009) Discovery of novel
thieno[2,3-d]pyrimidin-4-yl hydrazone-based inhibitors of Cyclin D1-CDK4: synthesis, biological evaluation, and structure-activity relationships. Bioorg Med Chem Lett 19: 305–308.
14. McClue SJ, Blake D, Clarke R, Cowan A, Cummings L, et al. (2002) In vitro and in vivo antitumor properties of the cyclin dependent kinase inhibitor CYC202 (R-roscovitine). Int J Cancer 102: 463–468.
15. Misra RN, Xiao HY, Kim KS, Lu S, Han WC, et al. (2004) N-(cycloalkylamino)acyl-2-aminothia- zole inhibitors of cyclin-dependent kinase 2. N-[5-[[[5-(1,1-dimethylethyl)-2–oxazolyl]methyl]thio]- 2-thiazolyl]-4-piperidinecarboxamide (BMS-387032), a highly efficacious and selective antitumor agent. J Med Chem 47: 1719–1728.
16. Toogood PL, Harvey PJ, Repine JT, Sheehan DJ, VanderWel SN, et al. (2005) Discovery of a potent and selective inhibitor of cyclin-dependent kinase 4/6. J Med Chem 48: 2388–2406.
17. Wang J, Kollman PA, Kuntz ID (1999) Flexible ligand docking: a multistep strategy approach. Proteins 36: 1–19.
18. Spitzer GM, Wellenzohn B, Laggner C, Langer T, Liedl KR (2007) DNA minor groove pharmacophores describing sequence specific properties. J Chem Inf Model 47: 1580–1589.
19. Jain AN (2003) Surflex: fully automatic flexible molecular docking using a molecular similarity-based search engine. J Med Chem 46: 499–511. 20. Jain AN (2007) Surflex-Dock 2.1: robust performance from ligand energetic
modeling, ring flexibility, and knowledge-based search. J Comput Aided Mol Des 21: 281–306.
21. Ambure PS, Gangwal RP, Sangamwar AT (2012) 3D-QSAR and molecular docking analysis of biphenyl amide derivatives as p38 alpha mitogen-activated protein kinase inhibitors. Molec Div 16: 377–388.
22. Cramer RD 3rd, Patterson DE, Bunce JD (1989) Recent advances in comparative molecular field analysis (CoMFA). Prog Clin Biol Res 291: 161– 165.
23. Cho SJ, Tropsha A (1995) Cross-validated R2-guided region selection for comparative molecular field analysis: a simple method to achieve consistent results. J Med Chem 38: 1060–1066.
25. Afantitis A, Melagraki G, Sarimveis H, Koutentis PA, Markopoulos J, et al. (2006) A novel simple QSAR model for the prediction of anti-HIV activity using multiple linear regression analysis. Molec Div 10: 405–414.
26. Murumkar PR, Giridhar R, Yadav MR (2008) 3D-quantitative structure-activity relationship studies on benzothiadiazepine hydroxamates as inhibitors of tumor necrosis factor-alpha converting enzyme. Chem Biol Drug Des 71: 363–373. 27. Lan P, Huang ZJ, Sun JR, Chen WM (2010) 3D-QSAR and Molecular Docking
Studies on Fused Pyrazoles as p38alpha Mitogen-Activated Protein Kinase Inhibitors. Int J Mol Sci 11: 3357–3374.
28. Hu R, Barbault F, Delamar M, Zhang R (2009) Receptor- and ligand-based 3D-QSAR study for a series of non-nucleoside HIV-1 reverse transcriptase inhibitors. Bioorg Med Chem 17: 2400–2409.
29. Reddy RN, Mutyala RR, Aparoy P, Reddanna P, Reddy MR (2010) An analysis of hydrophobic interactions of thymidylate synthase with methotrexate: free energy calculations involving mutant and native structures bound to metho-trexate. J Mol Model 16: 203–209.
30. Klebe G, Abraham U (1999) Comparative molecular similarity index analysis (CoMSIA) to study hydrogen-bonding properties and to score combinatorial libraries. J Comput Aided Mol Des 13: 1–10.
31. Sivan SK, Manga V (2010) Molecular docking and 3D-QSAR studies on triazolinone and pyridazinone, non-nucleoside inhibitor of HIV-1 reverse transcriptase. J Mol Model 16: 1169–1178.
32. Zhang N, Zhong R (2010) Docking and 3D-QSAR studies of 7-hydroxycou-marin derivatives as CK2 inhibitors. Eur J Med Chem 45: 292–297.
33. Lindgren F, Geladi P, Ra¨nnar S, Wold S (1994) Interactive variable selection (IVS) for PLS. Part 1: Theory and algorithms. J Chemometrics 8: 349–363. 34. Clark M, Cramer RD 3rd (1993) The probability of chance correlation using
partial least squares (PLS). QSAR 12: 137–145.
35. Roy K, Paul S (2010) Docking and 3D-QSAR studies of acetohydroxy acid synthase inhibitor sulfonylurea derivatives. J Mol Model 16: 951–964. 36. Golbraikh A, Tropsha A (2002) Beware of q2! J Mol Graph Model 20: 269–276. 37. Roy PP, Roy K (2008) On some aspects of variable selection for partial least
squares regression models. Qsar Comb Sci 27: 302–313.
38. Ikuta M, Kamata K, Fukasawa K, Honma T, Machida T, et al. (2001) Crystallographic approach to identification of cyclin-dependent kinase 4 (CDK4)-specific inhibitors by using CDK4 mimic CDK2 protein. J Biol Chem
276: 27548–27554.
39. Ruppert J, Welch W, Jain AN (1997) Automatic identification and represen-tation of protein binding sites for molecular docking. Protein Sci 6: 524–533. 40. Holt PA, Chaires JB, Trent JO (2008) Molecular docking of intercalators and
groove-binders to nucleic acids using Autodock and Surflex. J Chem Inf Model 48: 1602–1615.
41. Muthas D, Sabnis YA, Lundborg M, Karlen A (2008) Is it possible to increase hit rates in structure-based virtual screening by pharmacophore filtering? An investigation of the advantages and pitfalls of post-filtering. J Mol Graph Model 26: 1237–1251.